Abstract
A full understanding of the microenvironmental factors that control the activities of skeletal stem cells (also known as mesenchymal stem cells [MSCs]) in the adult bone marrow holds great promise for developing new therapeutic strategies to mitigate age-related diseases of bone and cartilage degeneration. Bone loss is an understudied manifestation of Marfan syndrome, a multisystem disease associated with mutations in the extracellular matrix protein and TGFβ modulator fibrillin-1. Here we demonstrate that progressive loss of cancellous bone in mice with limbs deficient for fibrillin-1 (Fbn1Prx1−/− mice) is accounted for by premature depletion of MSCs and osteoprogenitor cells combined with constitutively enhanced bone resorption. Longitudinal analyses of Fbn1Prx1−/− mice showed incremental bone loss and trabecular microarchitecture degeneration accompanied by a progressive decrease in the number and clonogenic potential of MSCs. Significant paucity of marrow fat cells in the long bones of Fbn1Prx1−/− mice, together with reduced adipogenic potential of marrow stromal cell cultures, indicated an additional defect in MSC differentiation. This postulate was corroborated by showing that an Fbn1-silenced osteoprogenitor cell line cultured in the presence of insulin yielded fewer than normal adipocytes and exhibited relatively lower PPARγ levels. Consonant with fibrillin-1 modulation of TGFβ bioavailability, cultures of marrow stromal cells from Fbn1Prx1−/− limb bones showed improper overactivation of latent TGFβ. In line with this finding, systemic TGFβ neutralization improved bone mass and trabecular microarchitecture along with normalizing the number of MSCs, osteoprogenitor cells, and marrow adipocytes. Collectively, our findings show that fibrillin-1 regulates MSC activity by modulating TGFβ bioavailability within the microenvironment of marrow niches.
Keywords: EXTRACELLULAR MATRIX, FIBRILLIN-1, MARFAN SYNDROME, BONE MARROW NICHE, OSTEOPENIA/OSTEOPOROSIS, TGFβ
Introduction
Partition of adult bone marrow tissue into functionally distinct microenvironments (aka, niches) is central to the maintenance, commitment, and differentiation of skeletal stem cells (aka, mesenchymal stem cells [MSCs]) during bone growth and remodeling.(1,2) Although substantial progress has been made in delineating the cell types, cell-cell interactions, and soluble biochemical signals that define adult bone marrow niches, there is still limited information about the roles that extracellular matrix (ECM) plays in determining the structural organization of these highly specialized tissue microenvironments and, consequently, in influencing the activities of resident MSCs.(3) Studies of mouse models of Marfan syndrome (MFS) have strongly suggested that fibrillin-1 assemblies (microfibrils and elastic fibers) may fulfill the hypothetical criteria of structural ECM elements involved in specifying bone marrow niches.(4) Such a belief is based on experimental evidence that has implicated fibrillin-1 assemblies in determining ECM organization and integrity, propagating mechanical signals across tissues, interacting with integrin receptors on resident cells, and modulating local signals by TGFβ superfamily members.(5–7) Relevant to the last function, binding of fibrillin-1 to secreted TGFβ and BMP complexes is thought to concentrate bioactive ligands for either immediate presentation to differentiating cells or subsequent release during tissue remodeling/repair.(5) Relevant to bone formation and homeostasis, local BMP signals have been associated with determining the number and activity of MSCs, and latent TGFβ activation in the highly acidic osteoclastic microenvironment has been reported to promote MSC recruitment to bone resorption sites.(8,9)
MFS is a relatively common disease of connective tissue with cardinal manifestations in the cardiovascular, ocular, and musculoskeletal systems.(10) A disproportionate increase in linear bone growth that causes serious malformations of the limbs, spine, and anterior chest wall is the most striking and immediately evident manifestation in MFS patients.(10) Additionally, reduced bone mineral density (BMD) has been reported in children, premenopausal women, and adult men afflicted with MFS.(11) We have previously shown that 3-month-old male mice with progressively severe MFS (Fbn1mgR/mgR mice) display reduced BMD and trabecular bone content (bone volume over total volume [BV/TV]), as well as longer than normal limb bones with thinner cortical areas.(12,13) Clinical signs of osteopenia in these MFS mice were associated with enhanced osteoblast maturation and osteoblast-supported osteoclast activity secondary to promiscuous TGFβ and BMP signaling.(12,14,15) Subsequent characterization of 3-month-old mice deficient for fibrillin-1 in either the limb mesenchyme or early preosteoblasts (Fbn1Prx1−/− and Fbn10sx−/− mice, respectively) has suggested a probable acceleration of osteoprogenitor cell differentiation.(16)
As a follow-up to the above studies, here we performed an extensive longitudinal analysis of bone loss in Fbn1Prx1−/− mice to fully characterize the natural history of osteopenia in MFS. Our study revealed an age-dependent pathology in which premature depletion of MSCs exacerbates osteoclast-driven bone loss. Additional evidence demonstrated that fibrillin-1 normally regulates MSC activities by modulating TGFβ bioavailability within the microenvironment of bone marrow niches. Indeed, systemic TGFβ neutralization normalized MSC deficiency in Fbn1Prx1−/− mice along with preventing bone loss and trabecular microarchitecture deterioration. Our findings therefore identified fibrillin-1 as the first component of the architectural matrix that defines the structural boundaries and functional properties of marrow niches, in addition to arguing for anti-TGFβ therapies to treat osteopenia in MFS.
Materials and Methods
Animals
Fbn1Prx1−/− mice were maintained on a mixed C57BL/6-129SvEv genetic background and all experiments and procedures were performed with male mutant and wild-type (WT) littermates. The institutional Animal Care and Use Committees of the Icahn School of Medicine at Mount Sinai and Genzyme Corporation reviewed and approved all animal studies. The pan-TGFβ-neutralizing antibody 1D11 (10 mg/kg body weight) was administered by intraperitoneal injection to 1-month-old WT and Fbn1Prx1−/− mice three times a week for 8 weeks; an antibody of the same IgG1 isotype (clone 13C4) was used as placebo treatment.(7) Mice were euthanized at the designated time points, and femurs and tibias were collected and processed for further analyses as previously described.(12–16) Contralateral limb bones were used to isolate marrow cells for flow cytometry and cell culture experiments, and the relative amounts of excreted deoxypyridinoline (Dpd) collagen crosslinks were used as surrogate readout of bone resorption in WT versus mutant mice.(12,15) To ablate marrow proliferating cells, WT and Fbn1Prx1−/− mice were injected with a single dose of either 5-fluorouracil (5-FU; 150 mg/kg; Sigma-Aldrich, St. Luis, MO, USA) or PBS, and their marrow-derived cells were subjected to colony-forming unit-fibroblast (CFU-F) clonogenic assays 5 days later.(17)
Micro–computed tomography and bone histomorphometry
Analyses of trabecular bone were carried out using micro–computed tomography (µCT) as previously described.(12,14–16) Mouse femurs were fixed with 4% formalin for 24 hours before imaging and then scanned by µCT (1172; SkyScan, Kontich, Belgium) in a custom-made holder filled with PBS. Five X-ray acquisitions were captured at a resolution of 6.7 µm with rotation step of 0.3 degrees for 180 degrees, and a 10-W (100 kV, 100 µA) power level was used with an exposure time of 1.767 s per X-ray projection. An implementation of a 0.5-mm aluminum filter was used to reduce beam-hardening effects. By using the modified back-projection algorithm in NRecon software (ver. 1.6.1.3; SkyScan, Kontich, Belgium), cross-section images from X-ray projections were reconstructed. Images were digitally compensated for beam-hardening effects and optimized with a prealignment and postalignment compensation algorithm. Ring artifacts were reduced by applying a software ring reduction factor equal to 10. The 3D data sets were low-pass-filtered using a Gaussian filter (σ = 0.66, support = 1 voxel) and segmented with a fixed threshold value of 0.44 g hydroxyapatite gHA/cm3. The metaphyseal volume of interest (VOI) was delineated within the endocortical edges of the proximal femur starting about 200 µm below the most distal part of growth plate, in order to exclude the primary spongiosa, and with a longitudinal extension of 2 mm in the direction of the diaphysis. The cortical bone was excluded by means of marking the outer bounds by freehand drawn regions of interest (ROIs). For dynamic bone formation analyses, mice were injected with 25 mg/kg calcein 10 and 2 days (Sigma-Aldrich, St. Luis, MO, USA) before being sacrificed to measure derived kinetics indices of bone formation and mineral apposition rates (BFR and MAR, respectively).(12,15) Fluorescent calcein-labeled 6-µm-thick methylmethacrylate sections from proximal tibias were analyzed using Osteomeasure software (OsteoMetrics, Inc., Decatur, GA, USA). Consecutive methylmethacrylate sections were stained with toluidine blue (Sigma-Aldrich, St. Louis, MO, USA) and the number of osteoblasts, osteoclasts, and osteocytes were estimated as previously described.(12,14) Similarly, paraffin sections from contralateral bones were tartrate-resistant acid phosphatase (TRAP)-stained using a commercial kit (Sigma-Aldrich, St. Louis, MO, USA) to assess the number of active osteoclasts.(14)
Cell culture experiments
Marrow cells from the tibias and femurs of 3-month-old WT and Fbn1Prx1−/− mice were cultured in α-MEM (Life Technologies, Grand Island, NY, USA) supplied with 20% FBS (Thermo Fisher Scientific, Pittsburgh, PA, USA), 100 U/mL penicillin, and 100 µg/mL streptomycin (Life Technologies, Grand Island, NY, USA).(15,16) Medium was changed every other day, unattached cells were discarded, and adherent cells were grown for an additional 10 days. Reporter cells for TGFβ and BMP bioassays (kindly provided by Dr. D. Rifkin) were incubated with conditioned media collected from WT and mutant marrow cell cultures.(18,19) Conditioned media (1:10 dilution) was heat-activated to measure total TGFβ versus bioactive TGFβ.(18) Reporter cell lysates were collected after 24 hours for luciferase activity assays (Promega, San Luis Obispo, CA, USA).(15) CFU-F clonogenic assays were carried out as previously described.(16) CFU-F colonies were differentiated into adipocytes (CFU-A) in (Life Technologies, Grand Island, NY, USA) DMEM supplemented with 200 µM indomethacin, 1 µM dexamethasone, 500 mM isobutylmethylxanthine (Sigma-Aldrich, St. Louis, MO, USA), insulin/transferrin and selenium (1% ITS premix; Gibco, Grand Island, NY, USA), and Oil-Red-O-staining (Sigma-Aldrich, St. Louis, MO, USA) evidenced differentiated CFU-A colonies.(20) For chondrogenic assays, micromass cultures were established from 2 × 10⁵ nucleate stromal marrow cells and cultured for 3 weeks in DMEM supplemented with 1% ITS, 50 µg/mL of ascorbic acid, 100nM dexamethasone (Sigma-Aldrich, St. Louis, MO, USA), with and without addition of 2 ng/mL of hrTGFβ-1 (R&D Systems, Minneapolis, MN, USA).(21) ImageJ software (NIH; http://imagej.nih.gov/ij) was used to estimate the percentage of Alcian blue–stained areas as a surrogate readout of chondrogenic differentiation in the various samples.(21)
RNA interference, protein, and immunostaining analyses
Fbn1-silenced Kusa-1 cells were grown in pro-adipogenic medium and analyzed by Oil-Red-O staining for intracellular fat droplets.(22) Total protein extracts from the same cells were analyzed by immunoblots using anti-PPARγ antibodies (Millipore, Billerica, MA, USA). Histomorphometric quantification of bone marrow fat content in the secondary spongiosa of proximal tibias were performed on two not-consecutive paraffin sections labeled with anti-perilipin antibodies (Cell Signaling Technology, Beverly, MA, USA) using Osteomeasure software. Anti-fibrillin-1 antibodies (a kind gift of Dr. L. Sakai) were employed to visualize Fbn1 expression in CFU-F cultures and bone cryosections;(15) goat anti-mouse LepR antibodies (R&D Systems, Minneapolis, MN, USA) were used to identify marrow MSCs in bone cryosections.(23) Alexa Fluor 568 and 488 anti-rabbit antibodies (Molecular Probes, Eugene, OR, USA) were used for immunofluorescent labeling. Anti-caspase-3 antibodies (Cell Signaling Technology, Danvers, MA, USA) were used to analyze protein extracts from primary bone marrow cultures.
Flow cytometry
Marrow stromal cells were flushed out from the long bones of WT and Fbn1Prx1−/− and digested for 15 min with collagenase type IV (Worthington Biochemical Co., Lakewood, NJ, USA; lot# 40E11939) and trypsin (Corning Cellgro; Mediatech, Manassas, VA, USA).(16) About 1 × 10⁶ marrow cells were labeled with the MSC multicolor flow kit (R&D Systems, Minneapolis, MN, USA) and MSC frequency was evaluated with an LSR II analyzer and FACSDIVA 6.1 software (BD Biosciences, San Jose, CA, USA) and a minimum of 3 × 10⁵ live cell events were recorded for each analysis.(24) For adipocyte quantification, marrow cells were stained with 10 µg/mL Nile-red (Sigma-Aldrich, St. Louis, MO, USA) for 20 min and the 488-nm laser-excited Nile-red dye was examined with the bandpass filter (BP) 585/42 nm.(25)
Statistics
Two investigators blinded to genotype and treatment group examined all bone samples for comparative analyses of osteopenia (n ≥ 5 per genotype and treatment). Similarly, cell culture experiments were performed on three or more independent samples in duplicate. Unpaired two-tailed t tests were used to determine the statistical significance of all experimental data between two groups, assuming a significance of p < 0.05. All values are graphically expressed as mean ± SD.
Results
Fbn1Prx1−/− mice display incremental age-dependent bone loss
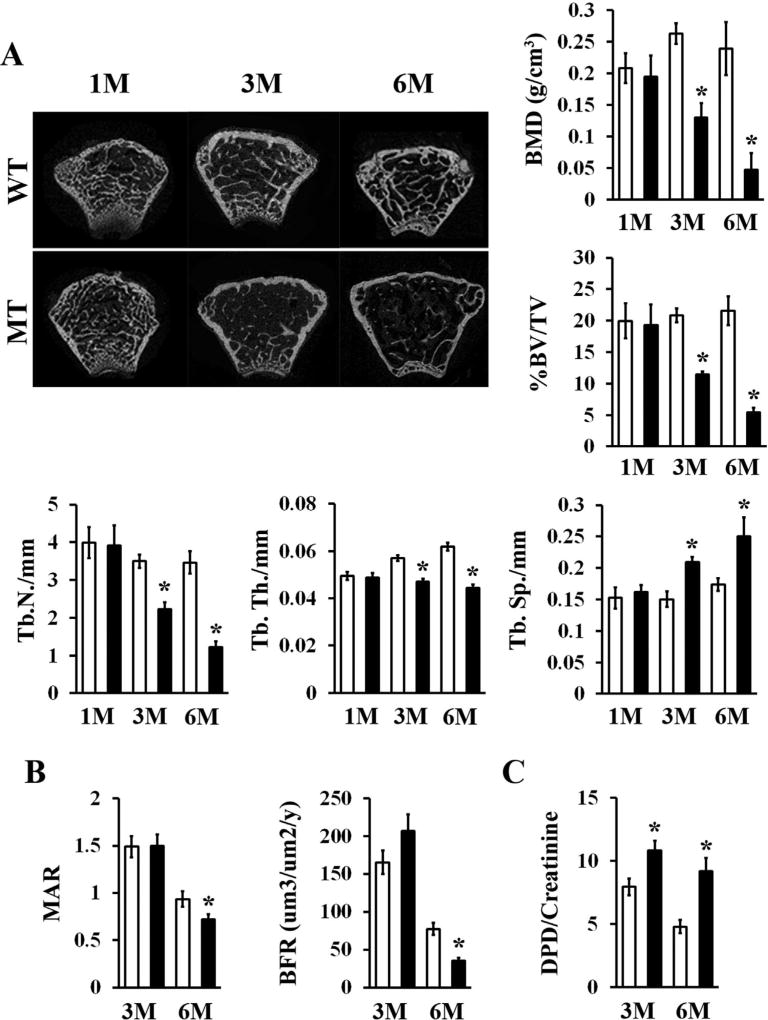
Mice deficient for fibrillin-1 in all cells derived from skeletal progenitors in the limb buds (Fbn1Prx1−/− mice) were originally generated to circumvent the cardiovascular complications that cause the early demise of Fbn1mgR/mgR mice, a validated animal model of progressively severe MFS.(16) By revealing significant bone loss associated with enhanced clonogenic and osteogenic potential of marrow cell cultures, a preliminary characterization of 3-month-old Fbn1Prx1−/− mice (herein referred to as mutant [MT] mice) has implicated a probable MSC/osteoprogenitor cell defect in the genesis of MFS-related osteopenia.(16) Indeed, here we found that fibrillin-1 is produced by WT marrow-derived CFU-Fs (Fig. 1A) and that fibrillin-1 assemblies surround leptin receptor (LepR)-positive MSCs located at the vascular surface of WT bones (Fig. 1B).(23) As expected, no fibrillin-1 was detected in either marrow-derived CFU-Fs or long bones of MT mice (Fig. 1). Because the preliminary characterization of MT mice had been performed at 3 months of age,(16) static and dynamic parameters of bone formation and degradation were examined at 1, 3, and 6 months to delineate the natural history of osteopenia in MFS mice. In contrast to the apparently normal bone phenotype of 1-month-old MT mice, incremental loss of cancellous bone and progressive deterioration of trabecular microarchitecture were observed in 3-month-old and 6-month-old MT animals relative to WT littermates (Fig. 2A). Even though our analyses focused on trabecular bone, we nonetheless noted appreciable thinning of cortical bone in MT relative to WT femurs that did not, however, reach the statistical significance previously observed in Fbn1mgR/mgR mice (Supporting Fig. 1).(13) We believe that the different genetic backgrounds account for the extent of cortical bone thinning in Fbn1mgR/mgR versus MT mice (C57BL/6 and C57BL/6-129SvEv, respectively).(13) This last point notwithstanding, our findings showed that fibrillin-1 plays a significant role in regulating adult bone remodeling.
Fig. 1.
Fibrillin-1 localization in bone marrow niches. (A) Immunostaining of fibrillin-1 (red) and fibronectin (green) in WT and MT CFU-F cultures (top) and q-PCR estimates of fibrillin-1 transcript levels, normalized against GAPDH, in WT and MT CFU-F cultures (bottom). Asterisk indicates a statistically significant difference between WT and MT samples (n = 5 per genotype). (B) Representative images of tibia sections from 3-month-old WT and MT mice stained with anti-fibrillin1 (green) and anti-LepR (red) antibodies (scale bar = 50 µm) showing fibrillin-1 accumulation at the bone surface and around perivascular cells in the bone marrow; on the right side, are magnified views (×3) of the merged images. WT = wild-type; MT = mutant; GAPDH = glyceraldehyde 3-phosphate dehydrogenase; b = bone surface; m = bone marrow.
Fig. 2.
Progressive bone loss in aging fibrillin-1–deficient limbs. (A) Representative µCT images of femoral metaphyses of WT and MT mice of the indicated ages in months with bar graphs showing measurements of BMD, BV/TV, Tb.N, Tb.Th, and Tb.Sp in WT (white bars) and MT (black bars) bones (n = 5 per genotype and time point). (B) Values of MAR, BFR, and (C) excreted Dpd crosslinks normalized to creatinine levels in 3-month-old and 6-month-old WT and MT mice (n ≥ 8 per genotype and time point). Asterisks in relevant panels indicate statistically significant differences between samples of the same age. WT = wild-type; MT = mutant; M = months; Tb.N = trabecular number; Tb.Th = trabecular thickness; Tb.Sp = trabecular spacing; Dpd = deoxypyridinoline.
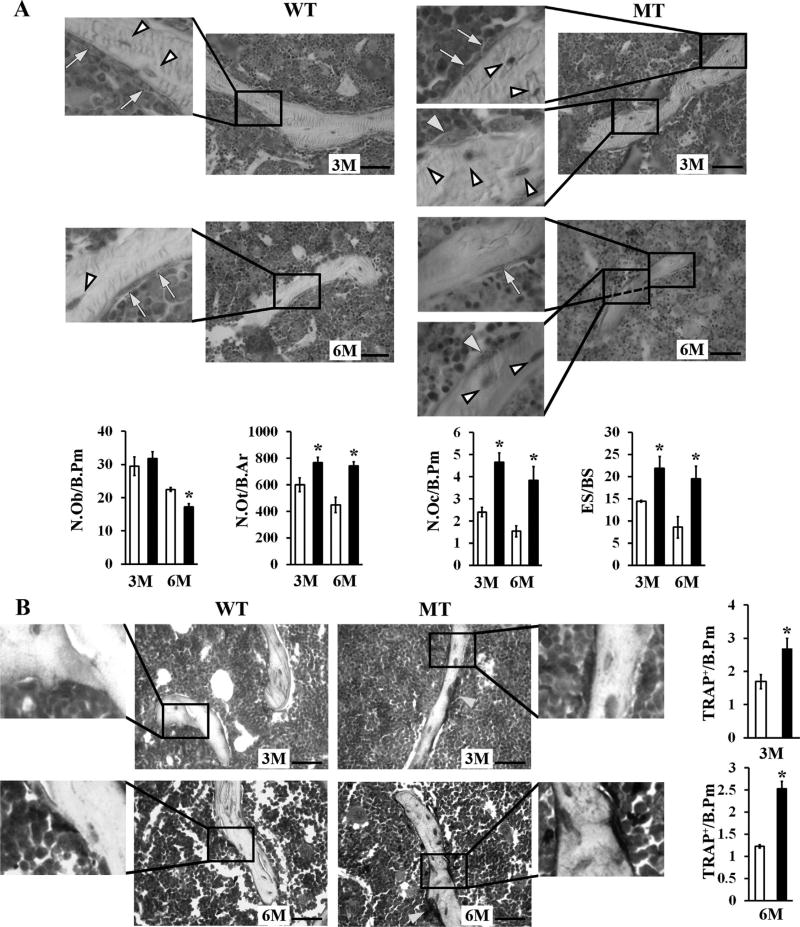
Reduced calcein incorporation in the MT bony matrix and increased amounts of crosslinked collagen peptides in the urine of MT mice related osteopenia with progressively declining bone formation and constitutively high bone resorption, respectively (Fig. 2B, C). Consistent with an age-dependent decline in bone formation (Fig. 2B), histomorphometric analyses revealed fewer osteoblasts associated with a constitutive increase of long-lived osteocytes in 3-month-old and 6-month-old MT bones (Fig. 3A). In line with the biochemical evidence of augmented ECM degradation (Fig. 2C), histomorphometric analyses showed a dramatic increase in osteoclast number paralleled by abnormally high bone erosion in 3-month-old and 6-month-old MT limbs (Fig. 3A). Comparative estimates of TRAP-positive cells in 3-month-old and 6-month-old WT and MT bones confirmed that fibrillin-1 deficiency was associated with a greater number of matrix-resorbing osteoclasts (Fig. 3B). Altogether, these findings established that osteopenia in MFS is an age-dependent pathology involving the combination of both progressively reduced bone anabolism and constitutively enhanced bone catabolism.
Fig. 3.
Cellular abnormalities in aging fibrillin-1–deficient limb bones. (A) Representative toluidine-stained methyl methacrylate sections (scale bar = 50 µm) of 3-month-old and 6-month-old WT and MT tibias; yellow arrows, and white and yellow arrowheads point at osteoblasts, osteocytes and osteoclasts in magnified (×3) images, respectively. Bar graphs below show the N.Ob, N.Ot, N.Oc, and ES/BS in 3-month-old and 6-month-old WT (white bars) and MT mice (black bars). (B) Representative TRAP-stained tibia sections (scale bar = 50 µm) with bar graphs showing the TRAP/B.Pm in 3-month-old and 6-month-old WT (white bars) and MT (black bars) mice. Yellow arrows point to osteoclasts not included in the magnified (×3) images. Asterisks in relevant panels indicate statistically significant differences between samples of the same ages (n = 4 per genotype and time point). WT = wild-type; MT = mutant; N.Ob/B.Pm = number of osteoblasts per bone perimeter; N.Ot/B.Pm = number of osteocytes per bone perimeter; N.Oc/B.Pm = number of osteoclasts per bone perimeter; ES/BS = eroded surface per bone surface; TRAP/B.Pm = number of TRAP-positive osteoclasts per bone perimeter.
MSC content declines at a faster rate in aging MT mice
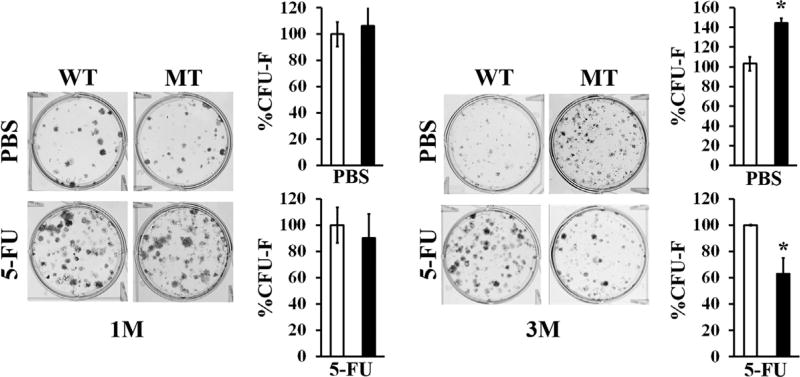
Because the scope of our study was to characterize the underlying mechanism of reduced cancellous bone anabolism, marrow stromal cells were isolated from the long bones of WT and MT mice at different ages and monitored for the relative abundance and clonogenic potential of MSCs. Whereas flow cytometry analyses showed fewer CD45−-marked, Sca-1+-marked, CD29+-marked, and CD105+-marked MSCs in 3-month-old and 6-month-old MT bones relative to the WT counterparts (Fig. 4A), CFU-F assays documented a transient increment of mesenchymal progenitor cells in MT long bones at 3 months, followed by a decline at 6 months (Fig. 4B). We interpreted these findings to indicate that age-dependent reduced bone formation is accounted for by accelerated osteolineage commitment and differentiation of MSCs, leading to premature depletion of these niche cells. Indeed, immunostaining analyses revealed appreciably fewer LepR-positive MSCs in 3-month-old MT compared to WT bones (Fig. 1B). To further support the notion of MSC dysregulation in fibrillin-1-deficient bones, we performed CFU-F assays with 1-month-old and 3-month-old MT mice injected 5 days before with a sublethal dose of 5-FU. By eliminating all rapidly cycling marrow cells, 5-FU treatment enabled us to infer MSC abundance at 1 and 3 months of age from the number of CFU-F colonies in experimental versus control marrow samples.(17) Consistent with the flow cytometry data showing a reduction in MSC frequency between 1 and 3 months of age (Fig. 4A), marrow stromal cells from 1-month-old or 3-month-old MT mice treated with 5-FU yielded the same number and fewer CFU-F colonies than the WT counterparts, respectively (Fig. 5). Similar to the clonogenic assays of untreated MT mice (Fig. 4B), a greater than normal number of CFU-F colonies was identified in marrow samples from 3-month-old MT mice treated with vehicle, indicating enhanced MSC commitment (Fig. 5). Collectively, these ex vivo experiments showed that fibrillin-1 normally participates in maintaining the physiological complement of quiescent marrow MSCs.
Fig. 4.
Abnormal MSC frequency and clonogenicity in fibrillin-1–deficient limb bones. (A) Representative flow cytometry plots of CD45−, Sca-1+, CD29+, and CD105+ MSC analyses with bar graphs on the right summarizing MSC relative frequency in bone marrow aspirates from 1-month-old, 3-month-old, and 6-month-old WT (white bar) and MT (black bar) mice (n = 5 per genotype and time point). (B) CFU-F assays of marrow cells from 1-month-old, 3-month-old, and 6-month-old WT and MT limb bones with bar graphs on the right summarizing the percentage of CFU-F colonies at the different ages (n = 10 per genotype and time point). Reference CFU-F values of WT samples were arbitrarily expressed as 100%. Asterisks in relevant panels indicate statistically significant differences between samples of the same age. WT = wild-type; MT = mutant; M = month; MSC = mesenchymal stem cell; CFU-F = colony-forming unit-fibroblast.
Fig. 5.
Premature depletion of MSCs in growing fibrillin-1–deficient limb bones. CFU-F assays of marrow cells isolated from 1-month-old and 3-month-old WT and MT mice 5 days after either 5-FU or PBS injections. Asterisks indicate statistically significant differences between samples of the same experimental group (n = 5 per genotype and treatment). WT = wild-type; MT = mutant; M = month; MSC = mesenchymal stem cell; CFU-F = colony-forming unit-fibroblast; 5-FU = 5-fluorouracil.
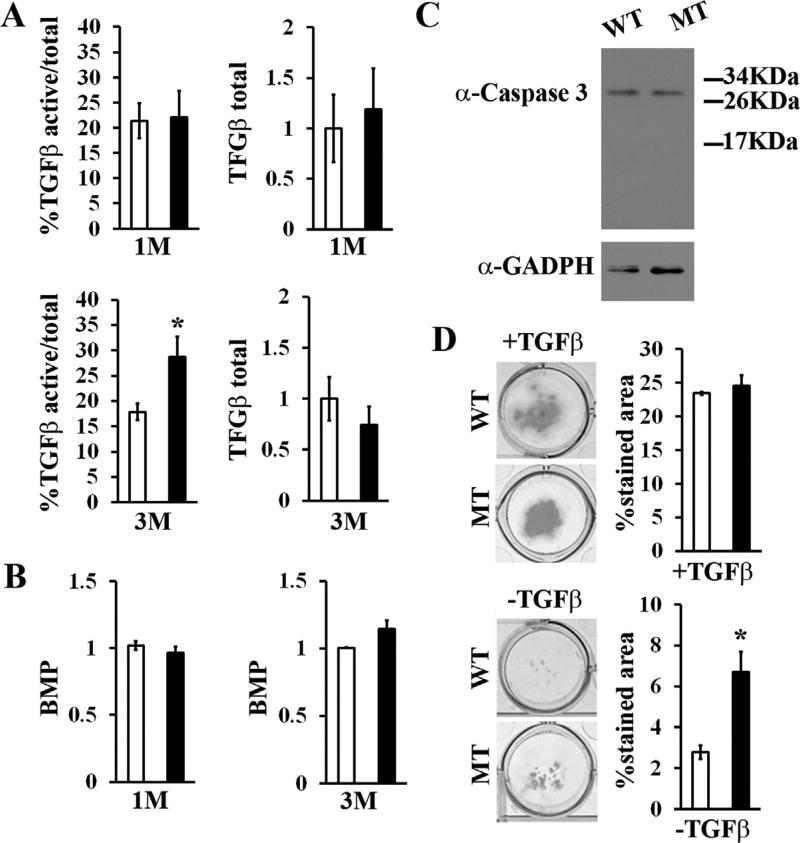
In accordance with fibrillin-1 modulation of TGFβ bioavailability and TGFβ regulation of osteoblastogenesis,(5,26) we found greater than normal activation of latent TGFβ in cultured marrow cells isolated from 3-month-old MT mice (Fig. 6A). By contrast, levels of active TGFβ were comparable between marrow cells isolated from 1-month-old WT and MT mice (Fig. 6A). Together, these findings documented the contextual specificity of fibrillin-1 regulation of TGFβ bioactivity in the postnatal bone marrow. The bioassays also revealed an appreciable (albeit statistically nonsignificant) decrease of total (latent plus active) TGFβ in the conditioned media of 3-month-old of fibrillin-1–deficient cell cultures (Fig. 6A). The significance of this last finding was not explored further. Even though fibrillin-1 can bind BMPs in vitro and enhanced BMP signaling has been involved in differentiation of fibrillin-1-deficient calvarial osteoblasts,(15,27) marrow stromal cell cultures isolated from both 1-month-old and 3-month-old WT and MT mice displayed comparable BMP activity (Fig. 6B). Similar to prior evidence from primary cultures of fibrillin-1–deficient calvarial osteoblasts,(14) no compensatory upregulation of the structurally and functionally related fibrillin-2 protein was noted in MT marrow cell cultures (data not shown). In contrast to mice deficient for both biglycan and decorin,(28) unremarkable levels of proapoptotic caspase-3 in MT marrow cell cultures excluded that TGFβ overactivation might also stimulate apoptosis (Fig. 6C). Together, these results identified TGFβ as the sole member of the TGFβ superfamily whose activity is influenced by fibrillin-1 deficiency in the bone marrow matrix.
Fig. 6.
Contextual specificity of fibrillin-1–regulated TGFβ activity. Bar graphs summarize the results of TGFβ (A) and BMP (B) bioassays performed with conditioned media of marrow cell cultures isolated from 1 and 3-month-old WT and MT limb bones (n = 7 per genotype and bioassay). (C) Representative caspase-3 immunoblot of total protein extracts from marrow cultures derived from 3-month-old WT and MT mice. (D) Alcian blue–stained micromass cultures of WT and MT MSCs (with or without exogenously added TGFβ) with bar graphs showing the percentage of Alcian blue–stained areas (n = 5 per genotype). Asterisks in all panels indicate statistically significant differences between samples of the same experimental group. WT = wild-type; MT = mutant; M = month; MSC = mesenchymal stem cell.
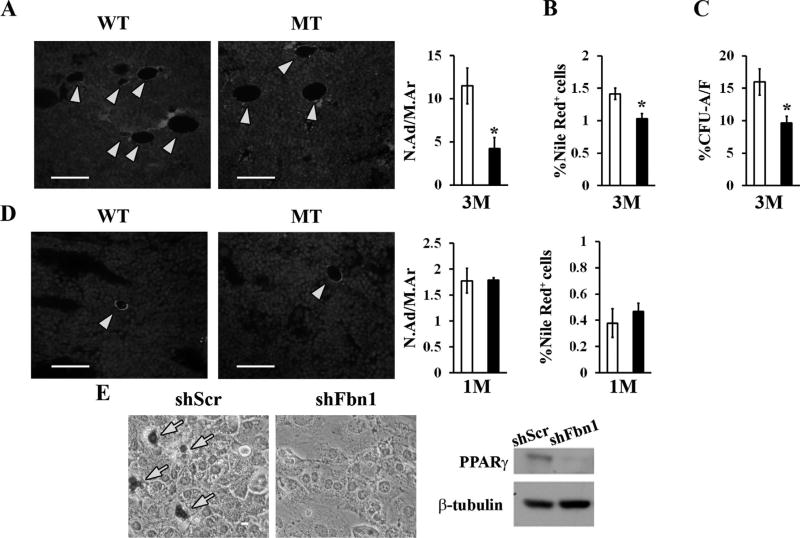
Two additional lines of evidence documented TGFβ hyperactivity in fibrillin-1–deficient bones. First, MSC-derived micromass cultures from MT mice exhibited greater than normal differentiation into proteoglycan-producing chondrocytes in the absence of exogenously added TGFβ (Fig. 6D). Second, and consistent with TGFβ inhibition of adipogenesis,(29) bones of 3-month-old MT mice displayed fewer marrow adipocytes than the WT counterparts (Fig. 7A, B). Moreover, insulin-induced CFU-A differentiation documented a significantly lower adipocyte/fibroblast ratio in MT versus WT cultures (Fig. 7C). The additional finding of a normal complement of marrow adipocytes in 1-month-old MT bones reiterated the notion that contextual, fibrillin-1-induced TGFβ hyperactivity perturbs MSC commitment (Fig. 7D). Similar to primary cultures of fibrillin-1–deficient calvarial osteoblast,(15) Kusa-1 osteoprogenitor cells stably expressing small hairpin RNAs against Fbn1 transcripts were previously reported to exhibit increased osteoblast-induced differentiation associated with augmented expression of the bone-formation stimulator Osterix.(22) Accordingly, we assessed the adipogenic potential and relative levels of the fat metabolism regulator PPARγ in insulin-stimulated, Fbn1-silenced Kusa-1 cultures. As anticipated, these in vitro experiments showed significantly impaired Kusa-1 differentiation into fat-storing cells associated with a substantial reduction of PPARγ protein levels (Fig. 7E). Altogether, our findings causally connected fibrillin-1 deficiency in limb bones with local TGFβ overactivation and abated PPARγ-driven marrow adipogenesis.
Fig. 7.
Impaired adipogenesis in the fibrillin-1–deficient marrow and progenitor cells. (A) Illustrative immunostaining of tibia sections from 3-month-old WT and MT mice (scale bar = 50 µm) showing perilipin-positive adipocytes (yellow arrows); bar graphs summarize the N.Ad/M.Ar (mm2) inWT (white bar) and MT (black bar) samples (n = 4 per genotype). (B) Frequency of Nile Red–positive cells in marrow aspirates from WT and MT mice (n = 5 per genotype). (C) Percentage of CFU-As versus CFU-Fs from 3-month-old WT and MT mice (n = 10 per genotype). (D) Illustrative perilipin staining, adipocyte number, and flow cytometry-based estimate of Nile Red–positive cell frequency in 1-month-old WT and MT marrows (n = 4 per genotype and assay). (E) Oil-Red-O lipid staining (left panel) and representative PPARγ immunoblot (right panel) of Kusa-1 cells cultured in adipogenic media and stably expressing shRNAs complementary to either the coding or a scrambled sequence of fibrillin-1 (shFbn1 and shScr, respectively). WT = wild-type; MT = mutant;M = month; N. Ad/M.Ar = number of adipocytes per marrow area; CFU-F = colony-forming unit-fibroblast; CFU-A = colony-forming unit-adipocyte. PPARγ = Peroxisome Proliferator-Activated Receptor gamma.
TGFβ hyperactivity contributes to MSC-dependent loss of bone mass and marrow fat
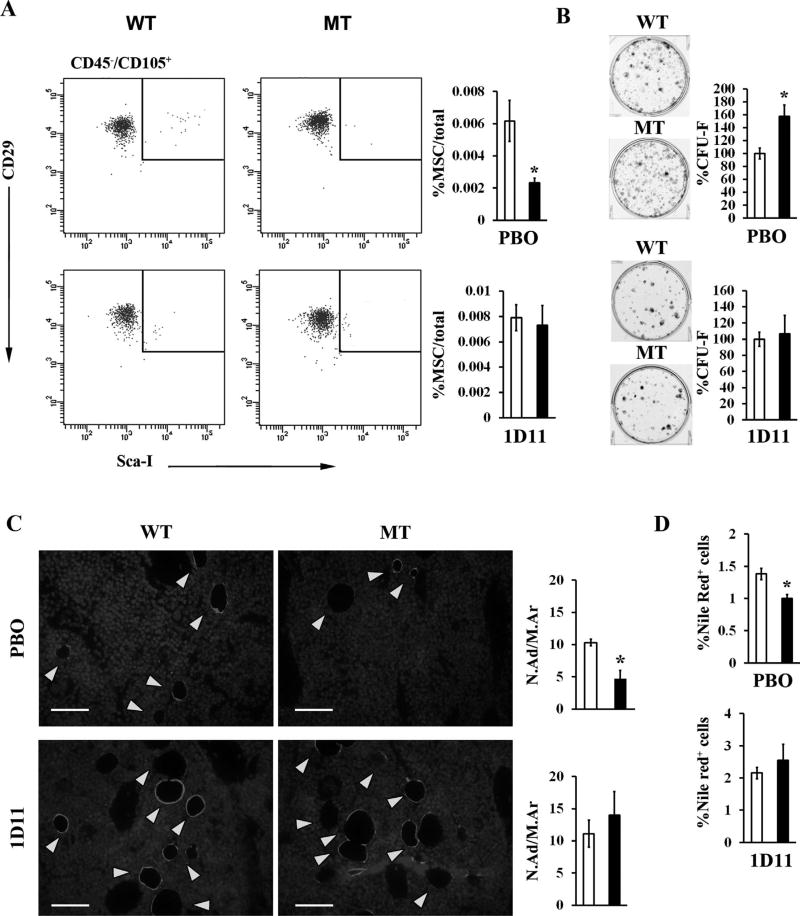
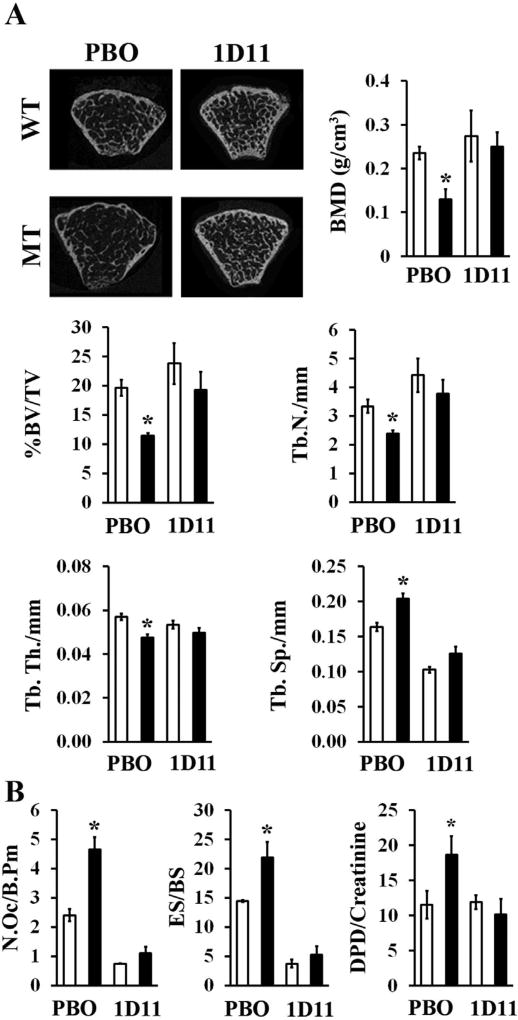
In light of the above evidence, next we tested if systemic TGFβ neutralization could modify bone pathology in MT mice. The dose and dosing regimen of the mouse monoclonal pan-TGFβ neutralizing antibody 1D11 were first determined to achieve maximal neutralization of circulating TGFβ, estimated to be ~115 ng/mL in MFS mice.(30) Accordingly, WT and MT mice received 10 mg/kg of 1D11 three times per week for 8 weeks starting at 1 month of age, which translated in circulating levels of 1D11 ranging between 1200-fold and 800-fold over the estimated Ki for 1D11.(31) Systemic TGFβ neutralization by this 1D11 dosing normalized the frequency of CD45−, Sca-1+, CD29+, and CD105+ MSCs and the number of CFU-F colonies (Fig. 8A, B), in addition to restoring normal adipogenesis in the MT marrow (Fig. 8C, D). Importantly, 1D11 treatment significantly improved bone mass and trabecular microarchitecture (Fig. 9A). As shown previously in Fbn1mgR/mgR mice,(14) systemic TGFβ neutralization also normalized osteoclast number and bone resorption in MT mice (Fig. 9B). Collectively, our findings demonstrated that fibrillin-1 assemblies regulate bone anabolism predominantly by modulating TGFβ bioavailability within marrow niches.
Fig. 8.
TGFβ-inhibition rescues marrow cell abnormalities in fibrillin-1–deficient mice. (A) Flow cytometry MSC analyses and (B) CFU-F assays of marrow cells from placebo-treated and 1D11-treated WT and MT mice; bar graphs summarize relevant data derived from WT (white bar) and MT (black bar) samples (n = 7 per genotype, assay and treatment). (C) Illustrative immunostaining of perilipin-positive adipocytes (yellow arrows) in tibia sections (scale bar = 50 µm) with bar graph summarizing their relative frequencies in the marrow of either PBO-treated or 1D11-treated 3-month-old WT (white bar) and MT (black bar) mice (n = 4 per genotype and treatment). (D) Frequency of Nile Red–positive cells in marrow aspirates from WT and MT mice treated with either PBO or 1D11 (n = 5 per genotype and treatment). Asterisks in all relevant panels indicate statistically significant differences between samples of the same experimental group. WT = wild-type; MT = mutant; MSC = mesenchymal stem cell; CFU-F = colony-forming unit-fibroblast; PBO = placebo; 1D11 = pan-TGFβ-neutralizing antibody; N.Ad/M.Ar = number of adipocytes per marrow area.
Fig. 9.
TGFβ inhibition prevents bone loss in fibrillin-1–deficient mice. (A) Representative µCT images and relevant bone parameters of 3-month-old WT and MT mice treated with either placebo or 1D11 (n=7 per genotype and treatment). (B) Number of osteoclasts, eroded surface, and Dpd levels in 3-month-old WT and MT mice treated with either PBO or 1D11 (n = 5 per genotype and treatment). WT = wild-type; MT = mutant; PBO = placebo; 1D11 = pan-TGFβ-neutralizing antibody; Dpd = deoxypyridinoline; Tb.N = trabecular number; Tb.Th = trabecular thickness; Tb.Sp = trabecular spacing; N.Oc/B.Pm = number of osteoclasts/bone perimeter; ES/BS = eroded surface per bone surface.
Discussion
ECM components can broadly be divided into the architectural elements that specify higher-order tissue structures (ie, collagen and fibrillin/elastin assemblies) and the nonstructural molecules that participate in matrix organization by interacting with other extracellular proteins, cell receptors, and soluble biochemical signals (eg, small leucine-rich proteoglycans [SLRPs]).(32) Characterization of mice deficient for both biglycan and decorin has implicated these collagen-interacting and TGFβ-interacting SLRPs in modulating the proliferation and survival of marrow stromal cells.(28) In accordance with these earlier findings, perturbed interactions between collagen I and SLRPs have recently been invoked to explain the causal relationship between TGFβ hyperactivity and bone loss in mouse models of osteogenesis imperfecta.(33) By establishing a causal connection between TGFβ overactivation, reduced bone formation, and decreased marrow adipogenesis, our study identified fibrillin-1 as the first component of the architectural matrix directly involved in controlling MSC fate. A clinically important corollary of our findings is that anti-TGFβ therapies may represent an effective new strategy to mitigate accelerated bone loss in pediatric and adult MFS patients.
Our analyses of fibrillin-1–deficient long bones, together with previous studies of Fbn1mgR/mgR mice,(12–15) show that premature loss of MSC and osteoprogenitor cells combined with abnormally high osteoclastogenesis drive progressively severe osteopenia in MFS. In vivo and ex vivo analyses have previously attributed the latter abnormality to RANKL upregulation in osteoblasts secondary to local TGFβ hyperactivity.(12) Preliminary findings of defective bone marrow hematopoiesis in MT mice raise the possibility that the ECM abnormality may indirectly influence osteoclast progenitor cell differentiation. It is also possible that enhanced osteoclastogenesis might increase osteocyte density by reducing the amount of bone in MT mice. Ongoing investigations are examining the potential contribution of these factors to augmented bone catabolism in MFS mice. Additional unresolved issues being addressed experimentally include the MSC population and stage of adipogenesis affected by fibrillin-1 deficiency, and the potential relationship between reduced bone mass and increased bone length in MFS. Although mechanistically distinct from the phenotype of SLRP-deficient mice,(29) progressive bone loss in fibrillin-1–deficient limbs is remarkably similar to the disease mechanism of mice deficient for the stem cell antigen Sca-1, which closely replicates human type II (age-related) osteoporosis.(34) Similar to fibrillin-1, this glycosyl phosphatidylinositol-anchored cell surface protein has been shown to regulate MSC fate and indirectly, osteoclast differentiation.(34) This correlative evidence, therefore, reiterates the notion that fibrillin-1 is an integral component of the interacting complex of cell surface molecules and secreted biochemical signals that specify MSC activities in bone marrow niches.
In contrast to our findings, others have recently reported that bone loss inmice with a unique Fbn1 mutation causing tight skin (Tsk/+ mice) is associated with decreased osteogenesis and increased adipogenesis due to integrin-linked kinase 4 (ILK4)-induced, mammalian target of rapamycin (mTOR)-mediated perturbation of MSC commitment.(35) Whereas MFS is associated with loss-of-function mutations in fibrillin-1,(36,37) the Tsk mutation apparently exerts a dominant-negative effect on integrin-directed microfibril biogenesis.(38,39) Bone loss in MFS and Tsk/+ mice therefore represents another example of mutations in the same gene that trigger distinct disease mechanisms. Along the same lines, an increasing amount of experimental evidence indicates that the multiple functions of fibrillin-1 assemblies translate into discrete organ-specific disease mechanisms in MFS.(7,12,40) A case in point is our previous demonstration that, in contrast to the observed benefits of systemic TGFβ neutralization on bone metabolism, losartan-mediated antagonism of angiotensin receptor 1 signaling mitigated TGFβ-driven aneurysm progression but not bone loss in MFS mice.(12) In line with age-specific dysregulation of MSCs in fibrillin-1–deficient marrow niches, we argue that differences in disease mechanisms between organ systems reflect how the fibrillin-1 matrix and resident cells interact within the context of individual tissues and differentiation states.
Supplementary Material
Acknowledgments
This work was supported by a grant from the National Institutes of Health (AR064868) and the Elster Family research endowment (to FR). We thank Rachel Zipursky, Jelena Basta-Pljakic, and Sella Takei for excellent technical assistance, and Karen Johnson for organizing the manuscript.
Authors’ roles: SS performed all the experiments with the assistance of MdS and GPG and under the guidance of MBS and the supervision of FR. NPC, SHC, and BMW optimized the conditions for dosing systemic TGFβ neutralization in mice. FR supervised all aspects of the project, including study design, experiments’ execution, data interpretation and manuscript writing together with SS and in consultation with MBS and the Genzyme team.
Footnotes
Additional Supporting Information may be found in the online version of this article.
Disclosures
Genzyme Corporation manufactured the monoclonal antibodies 1D11 and 13C4. All authors state that they have no conflicts of interest.
References
- 1.Zhang J, Li L. Stem cell niche: microenvironment and beyond. J Biol Chem. 2008;283:9499–508. doi: 10.1074/jbc.R700043200. [DOI] [PubMed] [Google Scholar]
- 2.Smith JN, Calvi LM. Regulatory interactions in the bone marrow microenvironment. IBMS Bonekey. 2011;2:96–111. doi: 10.1138/20110495. [DOI] [PMC free article] [PubMed] [Google Scholar]
- 3.Schipani E, Kronenberg HM. StemBook [Internet] Cambridge (MA): Harvard Stem Cell Institute; 2009. [cited 2015 July 30]. Adult mesenchymal stem cells. Available from: http://www.ncbi.nlm.nih.gov/books/NBK27056. [PubMed] [Google Scholar]
- 4.Chen XD. Extracellular matrix provides an optimal niche for the maintenance and propagation of mesenchymal stem cells. Birth Defects Res C Embryo Today. 2010;90:45–54. doi: 10.1002/bdrc.20171. [DOI] [PubMed] [Google Scholar]
- 5.Ramirez F, Rifkin DB. Extracellular microfibrils: contextual platforms for TGFb and BMP signaling. Curr Opin Cell Biol. 2009;21:616–22. doi: 10.1016/j.ceb.2009.05.005. [DOI] [PMC free article] [PubMed] [Google Scholar]
- 6.Ramirez F, Sakai LY. Biogenesis and function of fibrillin assemblies. Cell Tissue Res. 2010;339:71–82. doi: 10.1007/s00441-009-0822-x. [DOI] [PMC free article] [PubMed] [Google Scholar]
- 7.Cook JR, Carta L, Benard L, et al. Abnormal muscle mechanosignaling triggers cardiomyopathy in mice with Marfan syndrome. J Clin Invest. 2014;124:1329–39. doi: 10.1172/JCI71059. [DOI] [PMC free article] [PubMed] [Google Scholar]
- 8.Blank U, Karlsson G, Karlsson S. Signaling pathways governing stem-cell fate. Blood. 2008;111:492–503. doi: 10.1182/blood-2007-07-075168. [DOI] [PubMed] [Google Scholar]
- 9.Tang Y, Wu X, Lei W, et al. TGF-β1-induced migration of bone mesenchymal stem cells couples bone resorption with formation. Nat Med. 2009;15:757–65. doi: 10.1038/nm.1979. [DOI] [PMC free article] [PubMed] [Google Scholar]
- 10.Pyeritz RE. The Marfan syndrome. Annu Rev Med. 2000;51:481–510. doi: 10.1146/annurev.med.51.1.481. [DOI] [PubMed] [Google Scholar]
- 11.Giampietro PF, Peterson M, Schneider R, et al. Assessment of bone mineral density in adults and children with Marfan syndrome. Osteoporos Int. 2003;14:559–63. doi: 10.1007/s00198-003-1433-0. [DOI] [PubMed] [Google Scholar]
- 12.Nistala H, Lee-Arteaga S, Carta L, et al. Differential effects of alendronate and losartan therapy on osteopenia and aortic aneurysm in mice with severe Marfan syndrome. Hum Mol Genet. 2010;19:4790–8. doi: 10.1093/hmg/ddq409. [DOI] [PMC free article] [PubMed] [Google Scholar]
- 13.Arteaga-Solis E, Arteaga SL, Kim M, et al. Material and mechanical properties of bones deficient for fibrillin-1 or fibrillin-2 microfibrils. Matrix Biol. 2011;30:188–94. doi: 10.1016/j.matbio.2011.03.004. [DOI] [PMC free article] [PubMed] [Google Scholar]
- 14.Nistala H, Lee-Arteaga S, Smaldone S, Siciliano G, Ramirez F. Extracellular microfibrils control osteoblast-supported osteoclasto-genesis by restricting TGFβ stimulation of RANKL production. J Biol Chem. 2010;285:34126–33. doi: 10.1074/jbc.M110.125328. [DOI] [PMC free article] [PubMed] [Google Scholar]
- 15.Nistala H, Lee-Arteaga S, Smaldone S, et al. Fibrillin-1 and -2 differentially modulate endogenous TGF-b and BMP bioavailability during bone formation. J Cell Biol. 2010;190:1107–21. doi: 10.1083/jcb.201003089. [DOI] [PMC free article] [PubMed] [Google Scholar]
- 16.Cook JR, Smaldone S, Cozzolino C, et al. Generation of Fbn1 conditional null mice implicates the extracellular microfibrils in osteoprogenitor recruitment. Genesis. 2012;50:635–41. doi: 10.1002/dvg.22022. [DOI] [PMC free article] [PubMed] [Google Scholar]
- 17.Wang Z, Song J, Taichman RS, Krebsbach PH. Ablation of proliferating marrow with 5-fluorouracil allows partial purification of mesenchymal stem cells. Stem Cells. 2006;24:1573–82. doi: 10.1634/stemcells.2005-0399. [DOI] [PubMed] [Google Scholar]
- 18.Abe M, Harpel JG, Metz CN, et al. An assay for transforming growth factor-β using cells transfected with a plasminogen activator inhibitor-1 promoter-luciferase construct. Anal Biochem. 1994;216:276–84. doi: 10.1006/abio.1994.1042. [DOI] [PubMed] [Google Scholar]
- 19.Zilberberg L, ten Dijke P, Sakai LY, Rifkin DB. A rapid and sensitive bioassay to measure bone morphogenetic protein activity. BMC Cell Biol. 2007;8:41. doi: 10.1186/1471-2121-8-41. [DOI] [PMC free article] [PubMed] [Google Scholar]
- 20.Zhang W, Ou G, Hamrick M, et al. Age-related changes in the osteogenic differentiation potential of mouse bone marrow stromal cells. J Bone Miner Res. 2008;23:1118–28. doi: 10.1359/JBMR.080304. [DOI] [PMC free article] [PubMed] [Google Scholar]
- 21.Johnstone B, Hering TM, Caplan AI, Goldberg VM, Yoo JU. In vitro chondrogenesis of bone marrow-derived mesenchymal progenitor cells. Exp Cell Res. 1998;238:265–72. doi: 10.1006/excr.1997.3858. [DOI] [PubMed] [Google Scholar]
- 22.Smaldone S, Carta L, Ramirez F. Establishment of fibrillin-deficient osteoprogenitor cell lines identifies molecular abnormalities associated with extracellular matrix perturbation of osteogenic differentiation. Cell Tissue Res. 2011;344:511–7. doi: 10.1007/s00441-011-1167-9. [DOI] [PMC free article] [PubMed] [Google Scholar]
- 23.Zhou BO, Yue R, Murphy MM, Peyer JG, Morrison SJ. Leptin-receptor-expressing mesenchymal stromal cells represent the main source of bone formed by adult bone marrow. Cell Stem Cell. 2014;15:154–68. doi: 10.1016/j.stem.2014.06.008. [DOI] [PMC free article] [PubMed] [Google Scholar]
- 24.Sung JH, Yang HM, Park JB, et al. Isolation and characterization of mouse mesenchymal stem cells. Transplant Proc. 2008;40:2649–54. doi: 10.1016/j.transproceed.2008.08.009. [DOI] [PubMed] [Google Scholar]
- 25.Schaedlich K, Knelangen JM, Navarrete Santos A, Fischer B, Navarrete Santos A. A simple method to sort ESC-derived adipocytes. Cytometry A. 2010;77:990–5. doi: 10.1002/cyto.a.20953. [DOI] [PubMed] [Google Scholar]
- 26.Alliston T, Piek E, Derynck R. TGF-β family signaling in skeletal development, maintenance, and disease. In: Rik Derynck R, Miyazono K, editors. The TGFb family. Cold Spring Harbor, NY: Cold Spring Harbor Laboratory Press; 2008. pp. 667–723. (Cold Spring Harbor Monograph Series 50) [Google Scholar]
- 27.Sengle G, Ono RN, Sasaki T, Sakai LY. Prodomains of transforming growth factor b (TGFb) superfamily members specify different functions: extracellular matrix interactions and growth factor bioavailability. J Biol Chem. 2011;286:5087–99. doi: 10.1074/jbc.M110.188615. [DOI] [PMC free article] [PubMed] [Google Scholar]
- 28.Bi Y, Stuelten CH, Kilts T, et al. Extracellular matrix proteoglycans control the fate of bone marrow stromal cells. J Biol Chem. 2005;280:30481–9. doi: 10.1074/jbc.M500573200. [DOI] [PubMed] [Google Scholar]
- 29.Zamani N, Brown CW. Emerging roles for the transforming growth factor-β superfamily in regulating adiposity and energy expenditure. Endocr Rev. 2011;32:387–403. doi: 10.1210/er.2010-0018. [DOI] [PMC free article] [PubMed] [Google Scholar]
- 30.Matt P, Schoenhoff F, Habashi J, et al. Circulating transforming growth factor-β in Marfan syndrome. Circulation. 2009;120:526–32. doi: 10.1161/CIRCULATIONAHA.108.841981. [DOI] [PMC free article] [PubMed] [Google Scholar]
- 31.Nelson CA, Hunter RB, Quigley LA, et al. Inhibiting TGF-β activity improves respiratory function in mdx mice. Am J Pathol. 2011;178:2611–21. doi: 10.1016/j.ajpath.2011.02.024. [DOI] [PMC free article] [PubMed] [Google Scholar]
- 32.Ramirez F. Extracellular matrix in the skeleton. In: Pourquié O, editor. The skeletal system. Cold Spring Harbor, NY: Cold Spring Harbor Laboratory Press; 2009. pp. 341–53. (Cold Spring Harbor Monograph Series 53) [Google Scholar]
- 33.Grafe I, Yang T, Alexander S, et al. Excessive transforming growth factor-beta signaling is a common mechanism in osteogenesis imperfecta. Nat Med. 2014;20:670–5. doi: 10.1038/nm.3544. [DOI] [PMC free article] [PubMed] [Google Scholar]
- 34.Bonyadi M, Waldman SD, Liu D, et al. Mesenchymal progenitor self-renewal deficiency leads to age-dependent osteoporosis in Sca-1/Ly-6A null mice. Proc Natl Acad Sci U S.A. 2003;100:5840–5. doi: 10.1073/pnas.1036475100. [DOI] [PMC free article] [PubMed] [Google Scholar]
- 35.Chen C, Akiyama K, Wang D, et al. mTOR inhibition rescues osteopenia in mice with systemic sclerosis. J Exp Med. 2015;212:73–91. doi: 10.1084/jem.20140643. [DOI] [PMC free article] [PubMed] [Google Scholar]
- 36.Pereira L, Lee SY, Gayraud B, et al. Pathogenetic sequence for aneurysm revealed in mice underexpressing fibrillin-1. Proc Natl Acad Sci U S.A. 1999;96:3819–23. doi: 10.1073/pnas.96.7.3819. [DOI] [PMC free article] [PubMed] [Google Scholar]
- 37.Judge DP, Biery NJ, Keene DR, et al. Evidence for a critical contribution of haploinsufficiency in the complex pathogenesis of Marfan syndrome. J Clin Invest. 2004;114:172–81. doi: 10.1172/JCI20641. [DOI] [PMC free article] [PubMed] [Google Scholar]
- 38.Gayraud B, Keene DR, Sakai LY, Ramirez F. New insights into the assembly of extracellular microfibrils from the analysis of the fibrillin 1 mutation in the tight skin mouse. J Cell Biol. 2000;150:667–80. doi: 10.1083/jcb.150.3.667. [DOI] [PMC free article] [PubMed] [Google Scholar]
- 39.Jensen SA, Igbal S, Bulseiwicz A, Handford PA. A microfibril assembly assay identifies different mechanisms of dominance underlying Marfan syndrome, stiff skin syndrome and acromelic dysplasias. Hum Mol Genet. 2015 Aug 1;24(15):4454–63. doi: 10.1093/hmg/ddv181. [DOI] [PMC free article] [PubMed] [Google Scholar]
- 40.Cook JR, Clayton NP, Carta L, et al. Dimorphic effects of transforming growth factor-b signaling during aortic aneurysm progression in mice suggest a combinatorial therapy for Marfan syndrome. Arterioscler Thromb Vasc Biol. 2015;35:911–7. doi: 10.1161/ATVBAHA.114.305150. [DOI] [PMC free article] [PubMed] [Google Scholar]
Associated Data
This section collects any data citations, data availability statements, or supplementary materials included in this article.


