

Abstract
Objective
Infantile-onset spinal muscular atrophy (SMA) is the most common genetic cause of infant mortality, typically resulting in death prior to age 2. Clinical trials in this population require an understanding of disease progression and identification of meaningful biomarkers to hasten therapeutic development and predict outcomes.
Methods
A longitudinal, multi-center, prospective natural history study enrolled 26 SMA infants, and 27 control infants less than six months of age. Recruitment occurred at 14 centers over 21 months within the NINDS-sponsored NeuroNEXT Network. Infant motor function scales (TIMPSI, CHOP-INTEND and AIMS) and putative physiologic and molecular biomarkers were assessed prior to 6 months of age and at 6, 9, 12, 18 and 24-months with progression, correlations between motor function and biomarkers and hazard ratios were analyzed.
Results
Motor function scores (MFS) and CMAP decreased rapidly in SMA infants, whereas MFS in all healthy infants rapidly increased. Correlations were identified between TIMPSI and CMAP in SMA infants. TIMPSI at first study visit was associated with risk of combined endpoint of death or permanent invasive ventilation in SMA infants. Post hoc analysis of survival to combined endpoint in SMA infants with 2 copies of SMN2 indicated a median age of 8 months at death (95%CI: 6,17).
Interpretation
These data of SMA and control outcome measures delineates meaningful change in clinical trials in infantile-onset SMA. The power and utility of NeuroNEXT to provide “real world”, prospective natural history data sets to accelerate public and private drug development programs for rare disease is demonstrated.
Keywords: SMN, CHOP-INTEND, TIMPSI, AIMS, CMAP
Introduction
Spinal muscular atrophy (SMA) is the leading genetic cause of infant death with an incidence of 1 in 11,000 live births (1, 2). Infantile onset or type 1 SMA is characterized by muscle weakness, respiratory insufficiency and premature death(3, 4). SMA is a recessive disorder caused by deletion or mutation in the SMN1 (survival motor neuron 1) gene and retention of one or more copies of a nearly identical gene, SMN2 (survival motor neuron 2), which results in reduced expression of full-length SMN protein (5, 6). SMN2 differs from SMN1 by a nucleotide substitution that results in exclusion of exon 7 in approximately 90% of transcripts (7, 8). The mRNA that results, SMNΔ7, produces a non-functional truncated protein targeted for degradation (9, 10). SMN2 copy number correlates inversely with clinical severity in humans and motor function and survival in murine models (11–14). An understanding of the molecular genetics, and the ability to produce faithful SMA animal models has led to the development of small molecule, therapeutic antisense oligonucleotides (ASO) and gene replacement therapies(15, 16). Nusinersen, an ASO that alters SMN2 splicing to favor expression of full-length SMN protein(17, 18), was approved by the U.S. Food and Drug Administration in December 2016 and European Commission in June 2017 and is the first of many promising SMN disease modifying therapies.
To identify and compare effective therapies expeditiously requires accurate, reliable natural history data. Initial studies in SMA type 1 demonstrated shortened lifespan, with 68% mortality within the first two years of life (3, 4). Standardized care guidelines (19) have helped reduce mortality of SMA type 1 at two years of age to 30%, but nearly half of these infants are dependent upon noninvasive ventilation (20, 21). More recently, SMA infants with 2 copies of SMN2 and symptom onset prior to 6-months were shown to have poor motor function and significant motor unit loss electrophysiologically with a median age of death (or at least 16 hours/day required non-invasive ventilation) at 10.5-months of age (22). In a retrospective study, no SMA type 1 infants achieved major motor milestones such as rolling over or sitting independently (23). A critical challenge for the use of natural history data in infantile-onset SMA is that data is often wholly or partially retrospective, is collected at one or a few specialty academic sites in a non-systematic fashion and has no comparison control group.
The National Network for Excellence in Neuroscience Clinical Trials (NeuroNEXT) SMA Infant biomarker Study was initiated in 2012 to describe and prospectively compare the natural history of motor function assessments during the first two years of life in SMA and healthy infants enrolled prior to 6-months of age and to model the design of interventional studies in infantile-onset SMA(24). In addition to creating novel data sets, a primary goal was to examine correlations between candidate physiological and molecular biomarkers with motor function scores to inform the use of these measures in future clinical trials and clinical management.
Methods
Study design and participants
This was a prospective, multi-center, longitudinal natural history study in SMA and healthy infants designed to mimic a clinical trial. Fourteen sites in the United States participated. The protocol, patient demographics and baseline characteristics were published previously(24). Enrollment was restricted to infants who were ≤ 6-months of age and were born between 36 and 42 weeks gestation. The study was performed and supported by the NeuroNEXT Clinical Trial Network and originated from The Ohio State University Wexner Medical Center (Table S1) (25, 26). Parents or guardians of all participants provided written, informed consent approved by the NeuroNEXT central institutional review board (27) at each site.
SMA was confirmed by genetic testing prior to enrollment. Asymptomatic participants genetically diagnosed prior to the enrollment were included. Participants were excluded if they required non-invasive ventilatory support for >12 hours/day, had a comorbid illness, were on therapies thought to increase SMN expression, or were enrolled in a therapeutic trial. SMN1 gene deletion/mutation was excluded for the control infants, with confirmation of the SMN1 exon 7 deletion and SMN2 copy number were performed as previously described(28). Exclusion of the SMN2 gene modifier mutation c.859G>C (29, 30) was confirmed.
Procedures
A description of the procedures has been published(24). All participants were evaluated by trained evaluators, first using the Test of Infant Motor Performance Screening Items (TIMPSI), a 29-item, 99 point scale evaluation of motor function shown to be valid and reliable in type 1 SMA infants(31). After testing, all participants rested for 20 minutes. Participants scoring less than 41 on the TIMPSI were then evaluated using The Children’s Hospital of Philadelphia Infant Test for Neuromuscular Disorders (CHOP-INTEND), a validated 16-item, 64 point scale shown to be reliable in SMA type 1 (22, 32). Participants scoring 41 or greater on the TIMPSI were evaluated using the Alberta Infant Motor Scale (AIMS) (33, 34). Ulnar compound muscle action potential (CMAP) measurements were obtained (24). SMN mRNA analysis from blood was performed using Droplet Digital PCR (ddPCR) (Bio-Rad Laboratories, Hercules, CA) (24, 35). SMN protein was measured at PharmOptima (Portage, MI) using the company’s proprietary electrochemiluminescence (ECL) immunoassay based on the Meso Scale Discovery technology (24, 36).
Statistical Analysis
Mixed effects models were used to compare outcome variables between SMA and control participants longitudinally(37). For a given outcome variable, the model included terms for disease status, study visit, and the interaction between these two effects. The Akaike Information Criteria was applied to determine the most appropriate covariance structure. No adjustments were made for site-specific effects due to the small sample size. Due to the prognosis of SMA, it was expected that not all participants would survive until final follow-up. In these cases, all available data was used in the models. Study visit was modeled as a categorical variable to allow for possible non-linear trends over time and the interaction between study visit and disease status was retained in the model if the p-value associated with this effect was less than 0.20. Unless otherwise noted, a significance level of 0.05 was used to determine statistical significance.
Correlation between motor function scores and putative biomarkers were assessed separately for SMA and control participants. To assess the correlation between motor function scores and biomarkers, a linear mixed effects model approach was used. In these analyses, motor function scores were modeled longitudinally across study visit as a function of the biomarker corresponding to the same study visit. Correlation for these analyses was defined as the mean change in motor function score given a 1 unit increase in the biomarker. The parameter estimate associated with the biomarker indicates the direction and magnitude of the association.
The survival function for time to death or intubation was estimated using the Kaplan-Meier method. Participants who did not die or require intubation were considered to be censored events. Cox proportional regression models were used to estimate the hazard ratio for time to death or intubation as a function of motor function scores and biomarkers.
Results
Between December 14, 2012 and September 10, 2014, 26 SMA and 27 healthy infants were enrolled. The two cohorts were well matched for age, gender and birth weight and height; detailed description of the baseline characteristics was published in 2016 (24). The last study visit occurred in August, 2015. Twenty-three healthy infants (85.2%) completed the study. Two healthy infants (7.4%) discontinued because parents moved from a study site, and two were lost to follow up. Seven SMA infants (26.9%) completed the study. There were 12 deaths (46.2%) in the SMA cohort, and 7 infants (26.9%) withdrew from the study prior to the 24-month visit (Figure 1). Two infants received invasive ventilatory support during the study at 5-months and 18-months of age; both survived to the 24-month visit.
Figure 1. Retention in SMA cohort.
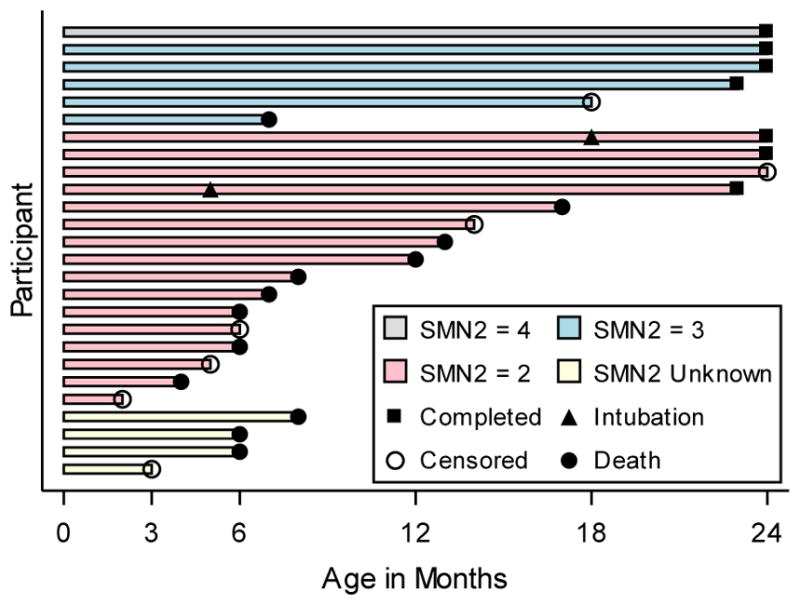
Age of infants at the time of death (filled circle), completion of the study (filled square) or loss to follow up (censored event, open circle). Age of scheduled study visits denoted on the x axis. Approximate age of permanent endotracheal intubation for respiratory support (closed triangle) is denoted for two infants. Bar colors denote SMN2 copy number; 4 copies = Grey, 3 copies = Blue, 2 copies = Red, Unknown copies = White.
In the SMA cohort, sixteen infants had 2 copies of SMN2, five had 3 copies and a single infant had 4 copies (38). SMN2 copy number was not determined in 4 SMA infants because of insufficient blood samples. These 4 participants were imputed to have 2 copies of SMN2 based upon their baseline scores(38) and were included in that subgroup for analysis. SMN2 copy number was inversely associated with risk of death or permanent invasive ventilatory support when comparing those with SMN2 copy number = 2 or unknown versus those with SMN2 copy number > 2 (HR 8.13; 95% CI 1.05, 63.00). Given the differences between infants with 2 versus 3 or 4 SMN2 copies, and to make direct comparisons with current ASO(18), gene therapy and future trials, the SMA cohort was studied as a whole (primary analysis) and as a subgroup where SMN2 = 2 or was unknown, excluding participants where SMN2 > 2 (secondary analysis).
Weight Gain and Nutritional Support
Control infants gained more weight than SMA infants over the first two years of life; at 6-months, control participants were approximately 0.95 kilogram heavier than SMA participants, and by the 24-month visit they were 2.27 kilograms heavier (Figure 2A and Table S2). Nine of the 20 SMA infants excluding participants with SMN2 > 2 received nutrition via gastrostomy tubes while enrolled.
Figure 2. Progression of Outcomes.

Longitudinal average weight and motor function test results in first two years of life for healthy infants (blue), SMA infants where SMN2 copy number = 2 or is unknown (red) and SMA infants where SMN2 copy number > 2 (grey). A) Average weight in kilograms at each study visit. B) Average Test of Infant Motor Performance Screening Items (TIMPSI) score, C) The Children’s Hospital of Philadelphia Infant Test for Neuromuscular Disorders (CHOP-INTEND) score and D) Alberta Infant Motor Score (AIMS) score at each study visit. E) Average ulnar CMAP peak area (mV/s). Study visits linked to infant age (in months, +/− 2 weeks for visits 6, 12, 18 and 24 months). Shaded areas describe the standard deviation for each mean at each study visit. F) Kaplan-Meier curve of time to death or endotracheal tube placement plotted separately for the subgroup of SMA infants with SMN2 copy number equal to 3 or 4 (solid red line, n = 6) and for the subgroup of SMA infants with SMN2 copy number equal to 2 or unknown (dashed red line, n = 20). Circles represent censored events that occurred when participants left the study before observing either event in the combined endpoint.
Motor Function
At enrollment, SMA infant TIMPSI scores were significantly lower than controls (24). This difference increased with time (Table S3). TIMPSI decreased in the SMA cohort excluding SMN2 > 2 participants and rapidly increased in the control cohort (Figure 2B). TIMPSI plateaued to a mean score of nearly 90 in the control cohort by the 6-month visit, while the mean TIMPSI in this SMA cohort, excluding SMN2 > 2 participants, steadily declined to a score of 7 (SD 6.56, n = 3) by the 24-month visit. TIMPSI scores in the SMA infants where SMN2 > 2 increased initially (Figure 2B).
CHOP-INTEND scores in the SMA cohort were also significantly lower than in controls at enrollment (24). All healthy controls reached a TIMPSI of greater than 41 after the 3-month visit and were thereafter not evaluated by CHOP-INTEND. Similarly, no SMA participants with SMN2 > 2 were evaluated by the CHOP- INTEND after the 3-month visit. In the SMA cohort excluding SMN2 > 2 participants, there was a decrease in the CHOP-INTEND (Figure 2C, Table S4). The highest CHOP-INTEND score in the SMA cohort excluding SMN2 > 2 participants was 33 for one infant at the 6-month visit. When analyzed by calculating the difference in scores from the 6-month visit, progression decline occurred through the first 12 months and then plateaued. (Figure 3 and Table 1).
Figure 3. Change in CHOP-INTEND in SMA Infants.
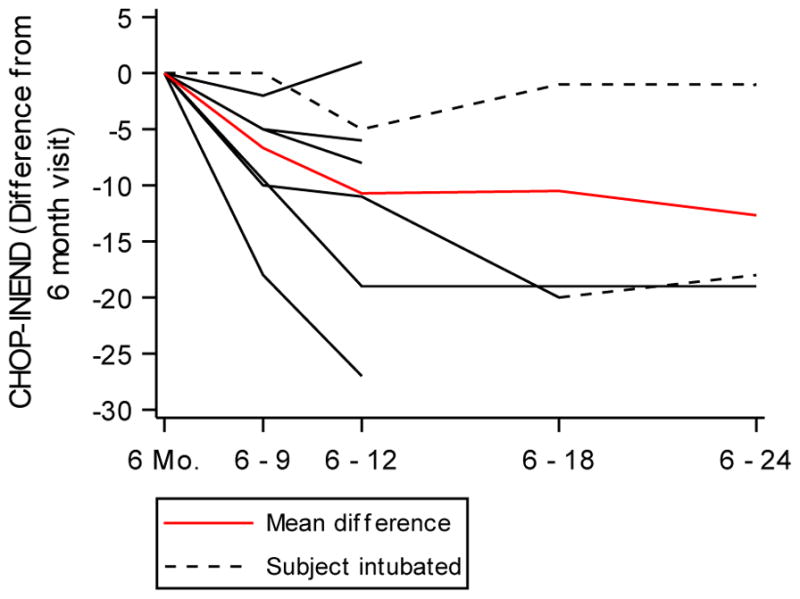
Change in CHOP-INTEND score from the score obtained on the 6-month study visit for each infant in the SMA cohort (black lines). A mixed effects model was fit to model change for each time period and was adjusted for the 6-month CHOP-INTEND score (red line). Dashed black lines denote infants who received invasive ventilatory support. All differences in CHOP-INTEND from 6-months on were statistically significant. A test for linear trend was performed using orthogonal polynomials and the observed trend in differences was not linear (p = 0.1161).
Table 1.
Descriptive statistics and model based results for change in CHOP-INTEND in SMA infants
| Observed | Model Based | |||
|---|---|---|---|---|
| Time period | Mean change (sd) | Min. – max. | Estimate (se) | 95% CI |
| 6 to 9 months | −6.67 (6.50) | −18 – 0 | −9.97 (2.80) | (−16.90, −2.52) |
| 6 to 12 months | −10.71 (9.43) | −27 – 1 | −9.41 (2.91) | (−16.12, −2.70) |
| 6 to 18 months | −10.50 (13.44) | −20 – −1 | −11.96 (3.76) | (−20.62, −3.30) |
| 6 to 24 months | −12.67 (10.12) | −19 – −1 | −11.00 (3.42) | (−18.89, −3.11) |
Data are graphically illustrated in Figure 3.
The AIMS test was used for infants who had a TIMPSI ≥ 41 to account for infants whose motor function would “max out” on the TIMPSI. As a result, all control infants and only SMA infants where SMN2 > 2 had the AIMS performed after the 3-month visit. Performance increased for the first 9-months and then plateaued; control infant scores were higher than the SMN2 > 2 infants. (Figure 2D, Table S5).
Progression of Candidate Biomarkers
CMAP amplitude and area were stable in control infants. (Figure 2E, Table S6 and S7)). The peak amplitude was 6.00 mV (SD=2.14, n=26) at the 6-month visit and 6.87mV (SD=2.02, n=21) at the 24-month visit. The peak area was 11.28 mV/s (SD=4.52, n=26) at the 6-month visit and 14.61 mV/s (SD=4.11, n=21) at the 24-month visit. CMAP amplitude and area rapidly fell and were lower in the SMA cohort excluding SMN2 > 2 participants than in controls at all time points and were often not detectable (Figure 2E, Table S6 and S7). CMAP amplitude was never higher than 0.6 mV in SMA infants excluding SMN2 > 2 participants 6-months or older.
SMN mRNA and protein levels from peripheral blood were stable over the first two years of life in healthy controls (6-month SMN/HPRT ratio: 1.30 (SD=0.44, n=22), 24-month: 1.19 (SD=0.40, n=17); 6-month protein level: 8622 pg/107 PBMCs (SD=6878, n=18), 24-month: 11767 pg/107 PBMCs (SD=5789, n=12)). SMN mRNA and protein levels in the SMA cohort were significantly lower than controls at all time points and were also stable (Table S8 and S9).
Time to combined endpoint
The combined survival endpoint was defined as age at death or permanent ventilatory support. This endpoint has been used in clinical trials in infantile-onset SMA(18). The median survival time for SMA infants excluding SMN2 > 2 participants was 8-months (95% CI, 6, 17, n = 20) (Figure 2F). The median survival time for the SMA infants with >2 SMN2 copies was not reached, with 85% living at the 24-month end-of-study time point.
Correlations between Motor Function and Candidate Biomarkers
Weight correlated negatively with the CHOP-INTEND in the SMA cohort and when participants with SMN2 > 2 were excluded from analysis, weight correlated negatively with the CHOP-INTEND and TIMPSI (Table S10). CMAP peak amplitude and area correlated positively with the TIMPSI in the SMA cohort and in the SMA cohort excluding SMN2 > 2 participants. The magnitude of this correlation varied by study visit in the SMA cohort, however was constant in the SMA cohort excluding SMN2 > 2 participants (Table S10). CMAP peak area had a positive correlation with the CHOP-INTEND at the 6-month visit but at no other visits in the SMA cohort and CMAP peak amplitude was not correlated with CHOP-INTEND in the SMA cohort or the SMA cohort excluding SMN2 > 2 participants (Table S10). There were no correlations between motor function (TIMPSI or CHOP-INTEND) and SMN mRNA or protein levels in the SMA cohort excluding SMN2 > 2 participants, however SMN mRNA levels correlated positively with the TIMPSI score in the total SMA cohort at the 12 and 18-month visits and in the healthy cohort at all study visits (Table S10).
Association of Biomarkers with Risk of Combined Endpoint
Hazard ratios were calculated to determine whether an outcome measure obtained at the first study visit predicted the time to combined endpoint in the SMA cohort (Table 2). Initial TIMPSI score was inversely associated with risk of combined endpoint (HR 0.53, 95% CI: 0.30, 0.93), and this association was lost when participants with SMN2 > 2 were excluded from the analysis. Initial weight, CHOP-INTEND score and CMAP were not significantly associated with risk of combined endpoint in the total SMA cohort. Hazard ratios were not calculated for the SMN mRNA and protein levels because the collection of blood samples did not occur regularly in the SMA cohort and often were not collected until 12-months after enrollment. Thus, the potential bias associated with the fact that blood samples were more likely collected from healthier infants made it an unfair comparison to determine the HRs for SMN mRNA and protein levels.
Table 2. Hazard Ratios for Motor Function Scores and Putative SMA Biomarkers.
Estimated hazard ratios from proportional hazards regression – time to combined endpoint
| Predictor | Estimated hazard ratio (95%
CI) SMA cohort excluding SMN2 > 2 (n = 20) |
Estimated hazard ratio (95%
CI) Total SMA cohort (n = 26) |
|---|---|---|
| Weight** | 1.71 (0.93, 3.14) | 1.65 (0.91, 3.01) |
| TIMPSI* | 0.80 (0.35, 1.82) | 0.53 (0.30, 0.93) |
| CHOP-INTEND* | 0.94 (0.41, 2.20) | 0.69 (0.38, 1.27) |
| CMAP peak amplitude** | 0.56 (0.04, 7.43) | 0.31 (0.06, 1.60) |
| CMAP peak area** | 0.82 (0.28, 2.43) | 0.55 (0.26, 1.16) |
Hazard ratio shown for a 10 unit increase
Hazard ratio shown for a 1 unit increase
For SMN2 copy number, the risk of endpoint for subjects with SMN2 copy number equal to two is 8.13 times that of subjects where copy number is greater than two, 95% CI (1.05, 63.00)
Discussion
This study has generated definitive controlled data on the natural history of infantile onset SMA. With the advent of effective disease-modifying therapies(18), it is likely not ethical or feasible to perform future clinical trials that have a placebo arm. Thus, our data sets are critical for future investigation of improved therapies. The control infant data obtained here is also novel, contributes to our understanding of postnatal neuromuscular development and provides a first benchmark to indicate full recovery in SMA trials and optimal clinical management.
SMA infants rapidly lost motor function and CMAP responses within 6-months of age and continued to lose function over the first two years of life. The median survival time in the SMA cohort excluding participants with > 2 SMN2 copies of 8 months, determined in a multicenter study that best mimics the design of interventional trials, increases the significance of recent clinical trials using ASO and gene therapy approaches in SMA infants with 2 copies of SMN2(17, 18). A recent observational study of SMA infants reported a median survival to death or >16 hours of required respiratory support of 10.5 months for infants with 2 copies of SMN2 gene(22). This is consistent with our results despite the different respiratory endpoint. Indeed, it is possible that the median survival in our cohort would have been even earlier had we used the same respiratory endpoint. Of note is that the standard of care and the timing of the initiation of hospice care in a non-treatment trial may differ from that in a clinical trial. Nevertheless, the rapid divergence of motor function and CMAP in SMA and control infants, manifest as early as 6-months of age, suggests that this bias was not a major influence on median time to combined endpoint. Moreover, because there appears to be an early, nonlinear reduction of motor function by CHOP-INTEND, the data adds urgency to the need for the inclusion of SMA genetic testing on newborn screening panels and for early therapeutic intervention.
Meaningful biomarkers for SMA would shorten clinical trial timelines, reduce sample sizes and predict treatment response(39). CMAP responses were reliably lower in SMA infants than controls and correlated with MFS in SMA infants, consistent with previous reports (22, 40–42). Given its promise in SMA animal model studies (43, 44), future studies in infants who receive effective disease-modifying therapy may indicate that CMAP is, if not a prognostic biomarker, a predictive biomarker of treatment response. This may be particularly important because effective SMN-targeted therapy trials indicate a clear relationship between treatment response and timing of delivery(18). SMN levels from blood samples were lower in SMA infants and were stable over the first two years of life in SMA and control cohorts. The stability over time is consistent with the stability of SMN levels observed in the postnatal period of a large animal model of SMA(35) and suggests that SMN blood levels may be useful as a pharmacodynamic biomarker for systemic SMN-targeted interventions. Correlations between SMN mRNA levels and TIMPSI in the control cohort may suggest that SMN expression is a positive modifier for motor function in healthy individuals that warrants further study. We successfully recruited and retained SMA and healthy control infants using 14 clinical sites geographically distributed across the US. The ability to enroll and retain participants in this vulnerable, rare pediatric population illustrates the utility and power of the clinical trial infrastructure of the NeuroNEXT Clinical Trial Network. Moreover, the public data sharing from this study has and will continue to be useful for drug development efforts, illustrating successful public investment in science that delineates meaningful outcomes for public health.
Considerations for effective clinical trial design in infantile-onset SMA can be gleaned from this study and recent clinical trials. With the FDA’s approval of nusinersen, all future trails will involve infants receiving a disease-modifying medication. One must define the molecular genetics for each infant, including potential genetic modifiers, and ensure a stratification plan based on SMN2 copy number. Ensuring that baseline values for motor milestones, MFS, respiratory status, and CMAP are well-matched between cohorts will also be crucial, as will pretreatment measurements of potential predictive biomarkers with particular attention to electrophysiological outcomes. Future clinical trial design should also include the longitudinal collection of blood, possibly CSF samples, and electrophysiological outcomes to anticipate the need to predict how treated infants will fare throughout their lifetimes. With these recommendations, the optimization of future successful therapies for infantile-onset SMA will move forward with even greater alacrity.
Supplementary Material
Acknowledgments
This study was made possible by the courage and strength of the infants and their families who volunteered to participate. We thank Dr. Elizabeth McNeil for her steady support throughout this project. We are grateful to Kelly and David Sopp at Wrybaby.com for the use of artwork and material support for this study. We are indebted to Allison Kingsley who served as the patient advocate during the design phase of this study on behalf of her son, Brett Kingsley. We are grateful to the NeuroNEXT Executive Committee for their guidance and support and to Dr. Brenda Wong who served as the Independent Medical Monitor for the study. The study was funded by NINDS(U01NS079163), Cure SMA, Muscular Dystrophy Association, SMA Foundation; The NeuroNEXT Network is supported by the NINDS (Central Coordinating Center: U01NS077179, Data Coordinating Center: U01NS077352); This study is registered at ClinicalTrials.gov, NCT01736553. The corresponding author (SJK) had full access to all the data from the study and had final responsibility for the content of the report decision to submit for publication.
Footnotes
Author Contributions:
SJK, AHMB, KK, WDA, SBR, KJS, STI, EK, AK and JTK conceived and designed the study. SJK, CSC, JWY, KK, WDA, KJS, AS, BTD, RS, NK, DC, STI, JP, AC, CC, CM, WBB, KW, MT, PS, EF, SRR, VLM, XW, PGZ and TWP and the NN101 SMA Biomarker Investigators (Table S1) acquired and analyzed the data. SJK, CSC, JWY, KK, WDA, and JTK drafted the manuscript.
Potential Conflicts of Interest:
The authors have nothing to report.
References
- 1.Pearn JH. The gene frequency of acute Werdnig-Hoffmann disease (SMA type 1). A total population survey in North-East England. Journal of medical genetics. 1973;10(3):260–5. doi: 10.1136/jmg.10.3.260. [DOI] [PMC free article] [PubMed] [Google Scholar]
- 2.Sugarman EA, Nagan N, Zhu H, Akmaev VR, Zhou Z, Rohlfs EM, et al. Pan-ethnic carrier screening and prenatal diagnosis for spinal muscular atrophy: clinical laboratory analysis of >72,400 specimens. European journal of human genetics : EJHG. 2012;20(1):27–32. doi: 10.1038/ejhg.2011.134. [DOI] [PMC free article] [PubMed] [Google Scholar]
- 3.Zerres K, Rudnik-Schoneborn S. Natural history in proximal spinal muscular atrophy. Clinical analysis of 445 patients and suggestions for a modification of existing classifications. Archives of neurology. 1995;52(5):518–23. doi: 10.1001/archneur.1995.00540290108025. [DOI] [PubMed] [Google Scholar]
- 4.Munsat T, Davies K. Spinal muscular atrophy. 32nd ENMC International Workshop. Naarden, The Netherlands, 10–12 March 1995. Neuromuscular disorders : NMD. 1996;6(2):125–7. doi: 10.1016/0960-8966(95)00032-1. [DOI] [PubMed] [Google Scholar]
- 5.Lefebvre S, Burlet P, Liu Q, Bertrandy S, Clermont O, Munnich A, et al. Correlation between severity and SMN protein level in spinal muscular atrophy. Nature genetics. 1997;16(3):265–9. doi: 10.1038/ng0797-265. [DOI] [PubMed] [Google Scholar]
- 6.Coovert DD, Le TT, McAndrew PE, Strasswimmer J, Crawford TO, Mendell JR, et al. The survival motor neuron protein in spinal muscular atrophy. Human molecular genetics. 1997;6(8):1205–14. doi: 10.1093/hmg/6.8.1205. [DOI] [PubMed] [Google Scholar]
- 7.Lorson CL, Hahnen E, Androphy EJ, Wirth B. A single nucleotide in the SMN gene regulates splicing and is responsible for spinal muscular atrophy. Proceedings of the National Academy of Sciences of the United States of America. 1999;96(11):6307–11. doi: 10.1073/pnas.96.11.6307. [DOI] [PMC free article] [PubMed] [Google Scholar]
- 8.Monani UR, Lorson CL, Parsons DW, Prior TW, Androphy EJ, Burghes AH, et al. A single nucleotide difference that alters splicing patterns distinguishes the SMA gene SMN1 from the copy gene SMN2. Human molecular genetics. 1999;8(7):1177–83. doi: 10.1093/hmg/8.7.1177. [DOI] [PubMed] [Google Scholar]
- 9.Burnett BG, Munoz E, Tandon A, Kwon DY, Sumner CJ, Fischbeck KH. Regulation of SMN protein stability. Molecular and cellular biology. 2009;29(5):1107–15. doi: 10.1128/MCB.01262-08. [DOI] [PMC free article] [PubMed] [Google Scholar]
- 10.Kashima T, Manley JL. A negative element in SMN2 exon 7 inhibits splicing in spinal muscular atrophy. Nature genetics. 2003;34(4):460–3. doi: 10.1038/ng1207. [DOI] [PubMed] [Google Scholar]
- 11.McAndrew PE, Parsons DW, Simard LR, Rochette C, Ray PN, Mendell JR, et al. Identification of proximal spinal muscular atrophy carriers and patients by analysis of SMNT and SMNC gene copy number. American journal of human genetics. 1997;60(6):1411–22. doi: 10.1086/515465. [DOI] [PMC free article] [PubMed] [Google Scholar]
- 12.Feldkotter M, Schwarzer V, Wirth R, Wienker TF, Wirth B. Quantitative analyses of SMN1 and SMN2 based on real-time lightCycler PCR: fast and highly reliable carrier testing and prediction of severity of spinal muscular atrophy. American journal of human genetics. 2002;70(2):358–68. doi: 10.1086/338627. [DOI] [PMC free article] [PubMed] [Google Scholar]
- 13.Elsheikh B, Prior T, Zhang X, Miller R, Kolb SJ, Moore D, et al. An analysis of disease severity based on SMN2 copy number in adults with spinal muscular atrophy. Muscle & nerve. 2009;40(4):652–6. doi: 10.1002/mus.21350. [DOI] [PubMed] [Google Scholar]
- 14.Monani UR, Sendtner M, Coovert DD, Parsons DW, Andreassi C, Le TT, et al. The human centromeric survival motor neuron gene (SMN2) rescues embryonic lethality in Smn(-/-) mice and results in a mouse with spinal muscular atrophy. Human molecular genetics. 2000;9(3):333–9. doi: 10.1093/hmg/9.3.333. [DOI] [PubMed] [Google Scholar]
- 15.Arnold WD, Burghes AH. Spinal muscular atrophy: development and implementation of potential treatments. Annals of neurology. 2013;74(3):348–62. doi: 10.1002/ana.23995. [DOI] [PMC free article] [PubMed] [Google Scholar]
- 16.Kolb SJ, Kissel JT. Spinal muscular atrophy: a timely review. Archives of neurology. 2011;68(8):979–84. doi: 10.1001/archneurol.2011.74. [DOI] [PMC free article] [PubMed] [Google Scholar]
- 17.Chiriboga CA, Swoboda KJ, Darras BT, Iannaccone ST, Montes J, De Vivo DC, et al. Results from a phase 1 study of nusinersen (ISIS-SMNRx) in children with spinal muscular atrophy. Neurology. 2016;86(10):890–7. doi: 10.1212/WNL.0000000000002445. [DOI] [PMC free article] [PubMed] [Google Scholar]
- 18.Finkel RS, Chiriboga CA, Vajsar J, Day JW, Montes J, De Vivo DC, et al. Treatment of infantile-onset spinal muscular atrophy with nusinersen: a phase 2, open-label, dose-escalation study. Lancet. 2017;388(10063):3017–26. doi: 10.1016/S0140-6736(16)31408-8. [DOI] [PubMed] [Google Scholar]
- 19.Wang CH, Finkel RS, Bertini ES, Schroth M, Simonds A, Wong B, et al. Consensus statement for standard of care in spinal muscular atrophy. Journal of child neurology. 2007;22(8):1027–49. doi: 10.1177/0883073807305788. [DOI] [PubMed] [Google Scholar]
- 20.Oskoui M, Levy G, Garland CJ, Gray JM, O’Hagen J, De Vivo DC, et al. The changing natural history of spinal muscular atrophy type 1. Neurology. 2007;69(20):1931–6. doi: 10.1212/01.wnl.0000290830.40544.b9. [DOI] [PubMed] [Google Scholar]
- 21.Mercuri E, Bertini E, Iannaccone ST. Childhood spinal muscular atrophy: controversies and challenges. Lancet Neurol. 2012;11(5):443–52. doi: 10.1016/S1474-4422(12)70061-3. [DOI] [PubMed] [Google Scholar]
- 22.Finkel RS, McDermott MP, Kaufmann P, Darras BT, Chung WK, Sproule DM, et al. Observational study of spinal muscular atrophy type I and implications for clinical trials. Neurology. 2014;83(9):810–7. doi: 10.1212/WNL.0000000000000741. [DOI] [PMC free article] [PubMed] [Google Scholar]
- 23.De Sanctis R, Coratti G, Pasternak A, Montes J, Pane M, Mazzone ES, et al. Developmental milestones in type I spinal muscular atrophy. Neuromuscular disorders : NMD. 2016;26(11):754–9. doi: 10.1016/j.nmd.2016.10.002. [DOI] [PMC free article] [PubMed] [Google Scholar]
- 24.Kolb SJ, Coffey CS, Yankey JW, Krosschell K, Arnold WD, Rutkove SB, et al. Baseline results of the NeuroNEXT spinal muscular atrophy infant biomarker study. Annals of clinical and translational neurology. 2016;3(2):132–45. doi: 10.1002/acn3.283. [DOI] [PMC free article] [PubMed] [Google Scholar]
- 25.Heemskerk J, Farkas R, Kaufmann P. Neuroscience networking: linking discovery to drugs. Neuropsychopharmacology. 2012;37(1):287–9. doi: 10.1038/npp.2011.177. [DOI] [PMC free article] [PubMed] [Google Scholar]
- 26.The Lancet N. NeuroNEXT: accelerating drug development in neurology. Lancet Neurol. 2012;11(2):119. doi: 10.1016/S1474-4422(12)70008-X. [DOI] [PubMed] [Google Scholar]
- 27.Kaufmann P, O’Rourke PP. Central institutional review board review for an academic trial network. Academic medicine : journal of the Association of American Medical Colleges. 2015;90(3):321–3. doi: 10.1097/ACM.0000000000000562. [DOI] [PMC free article] [PubMed] [Google Scholar]
- 28.Prior TW, Snyder PJ, Rink BD, Pearl DK, Pyatt RE, Mihal DC, et al. Newborn and carrier screening for spinal muscular atrophy. Am J Med Genet A. 2010;152A(7):1608–16. doi: 10.1002/ajmg.a.33474. [DOI] [PubMed] [Google Scholar]
- 29.Prior TW, Krainer AR, Hua Y, Swoboda KJ, Snyder PC, Bridgeman SJ, et al. A positive modifier of spinal muscular atrophy in the SMN2 gene. American journal of human genetics. 2009;85(3):408–13. doi: 10.1016/j.ajhg.2009.08.002. [DOI] [PMC free article] [PubMed] [Google Scholar]
- 30.Bernal S, Alias L, Barcelo MJ, Also-Rallo E, Martinez-Hernandez R, Gamez J, et al. The c.859G>C variant in the SMN2 gene is associated with types II and III SMA and originates from a common ancestor. Journal of medical genetics. 2010;47(9):640–2. doi: 10.1136/jmg.2010.079004. [DOI] [PubMed] [Google Scholar]
- 31.Krosschell KJ, Maczulski JA, Scott C, King W, Hartman JT, Case LE, et al. Reliability and validity of the TIMPSI for infants with spinal muscular atrophy type I. Pediatric physical therapy : the official publication of the Section on Pediatrics of the American Physical Therapy Association. 2013;25(2):140–8. doi: 10.1097/PEP.0b013e31828a205f. discussion 9. [DOI] [PMC free article] [PubMed] [Google Scholar]
- 32.Glanzman AM, Mazzone E, Main M, Pelliccioni M, Wood J, Swoboda KJ, et al. The Children’s Hospital of Philadelphia Infant Test of Neuromuscular Disorders (CHOP INTEND): test development and reliability. Neuromuscular disorders : NMD. 2010;20(3):155–61. doi: 10.1016/j.nmd.2009.11.014. [DOI] [PMC free article] [PubMed] [Google Scholar]
- 33.Piper MC, Darrah J. In: Motor assessment of the developing infant. Co WS, editor. Philadelphia: 1994. [Google Scholar]
- 34.Blanchard Y, Neilan E, Busanich J, Garavuso L, Klimas D. Interrater reliability of early intervention providers scoring the alberta infant motor scale. Pediatric physical therapy : the official publication of the Section on Pediatrics of the American Physical Therapy Association. 2004;16(1):13–8. doi: 10.1097/01.PEP.0000113272.34023.56. [DOI] [PubMed] [Google Scholar]
- 35.Iyer CC, Wang X, Renusch SR, Duque SI, Wehr AM, Mo XM, et al. SMN Blood Levels in a Porcine Model of Spinal Muscular Atrophy. J Neuromuscul Dis. 2017;4(1):59–66. doi: 10.3233/JND-170209. [DOI] [PMC free article] [PubMed] [Google Scholar]
- 36.Zaworski P, von Herrmann KM, Taylor S, Sunshine SS, McCarthy K, Risher N, et al. SMN Protein Can Be Reliably Measured in Whole Blood with an Electrochemiluminescence (ECL) Immunoassay: Implications for Clinical Trials. PloS one. 2016;11(3):e0150640. doi: 10.1371/journal.pone.0150640. [DOI] [PMC free article] [PubMed] [Google Scholar]
- 37.McCulloch CE, Searle SR. Generalized, Linear, and Mixed Models. John Wiley & Sons, Inc; 2005. Linear Mixed Models (LMMs) pp. 156–86. [Google Scholar]
- 38.Kolb SJ, Coffey CS, Yankey JW, Krosschell KP, Arnold WD, Rutkove SB, et al. Baseline Results of the NeuroNEXT Spinal Muscular Atrophy Infant Biomarker Study. Annals of clinical and translational neurology. 2016 doi: 10.1002/acn3.283. [DOI] [PMC free article] [PubMed] [Google Scholar]
- 39.Arnold WD, Rutkove SB, Simard LR, Kolb SJ. In: SMA Biomarkers. Sumner CJ, Paushkin S, Ping C-P, editors. San Diego: Academic Press; 2016. [Google Scholar]
- 40.Lewelt A, Krosschell KJ, Scott C, Sakonju A, Kissel JT, Crawford TO, et al. Compound muscle action potential and motor function in children with spinal muscular atrophy. Muscle & nerve. 2010;42(5):703–8. doi: 10.1002/mus.21838. [DOI] [PMC free article] [PubMed] [Google Scholar]
- 41.Swoboda KJ, Prior TW, Scott CB, McNaught TP, Wride MC, Reyna SP, et al. Natural history of denervation in SMA: Relation to age, SMN2 copy number, and function. Annals of neurology. 2005;57(5):704–12. doi: 10.1002/ana.20473. [DOI] [PMC free article] [PubMed] [Google Scholar]
- 42.Kaufmann P, McDermott MP, Darras BT, Finkel RS, Sproule DM, Kang PB, et al. Prospective cohort study of spinal muscular atrophy types 2 and 3. Neurology. 2012;79(18):1889–97. doi: 10.1212/WNL.0b013e318271f7e4. [DOI] [PMC free article] [PubMed] [Google Scholar]
- 43.Duque SI, Arnold WD, Odermatt P, Li X, Porensky PN, Schmelzer L, et al. A large animal model of spinal muscular atrophy and correction of phenotype. Annals of neurology. 2015;77(3):399–414. doi: 10.1002/ana.24332. [DOI] [PMC free article] [PubMed] [Google Scholar]
- 44.Arnold W, McGovern VL, Sanchez B, Li J, Corlett KM, Kolb SJ, et al. The neuromuscular impact of symptomatic SMN restoration in a mouse model of spinal muscular atrophy. Neurobiology of disease. 2016;87:116–23. doi: 10.1016/j.nbd.2015.12.014. [DOI] [PMC free article] [PubMed] [Google Scholar]
Associated Data
This section collects any data citations, data availability statements, or supplementary materials included in this article.