Abstract
L-lysine and other amino acids are commonly produced through fermentation using strains of heterotrophic bacteria such as Corynebacterium glutamicum. Given the large amount of sugar this process consumes, direct photosynthetic production is intriguing alternative. In this study, we report the development of a cyanobacterium, Synechococcus sp. strain PCC 7002, capable of producing L-lysine with CO2 as the sole carbon-source. We found that heterologous expression of a lysine transporter was required to excrete lysine and avoid intracellular accumulation that correlated with poor fitness. Simultaneous expression of a feedback inhibition resistant aspartate kinase and lysine transporter were sufficient for high productivities, but this was also met with a decreased chlorophyll content and reduced growth rates. Increasing the reductant supply by using NH4+, a more reduced nitrogen source relative to NO3−, resulted in a two-fold increase in productivity directing 18% of fixed carbon to lysine. Given this advantage, we demonstrated lysine production from media formulated with a municipal wastewater treatment sidestream as a nutrient source for increased economic and environmental sustainability. Based on our results, we project that Synechococcus sp. strain PCC 7002 could produce lysine at areal productivities approaching that of sugar cane to lysine via fermentation using non-agricultural lands and low-cost feedstocks.
Keywords: Cyanobacteria, Synechococcus sp. PCC 7002, Lysine, Amino acids, metabolic engineering
1. Introduction
L-lysine is one of the essential amino acids required for human and animal growth. As demand for meat (e.g. poultry, swine, cattle) has grown, so has demand for essential amino acids, especially lysine (Eggeling and Bott, 2015). Lysine and other amino acids are commonly produced by fermentation using strains of heterotrophic bacteria, such as Escherichia coli and Corynebacterium glutamicum (Brautaset and Ellingsen, 2011). C. glutamicum has been engineered to produce lysine with a yield of 0.31 g lysine/g sugar. At this yield, current lysine demand (~1.85 million tons per year) would consume approximately 3% of world sugar production (~200 million tons per year – USDA-ERS). For this reason, it is important to consider alternative feedstocks and production strategies for essential amino acids. Direct photosynthetic production of L-lysine is an attractive process because it circumvents the need for harvesting, processing and fermentation of plant-derived sugars, by directly coupling lysine biosynthesis to photosynthesis. Cyanobacteria are attractive photosynthetic organisms for L-lysine production due to the availability of genetic tools, rapid growth rates, halotolerance, and ability to be grown on non-productive land with simple nutrient requirements (Oliver and Atsumi, 2014; Pate et al., 2011) or wastestreams (Korosh et al., 2017). Here, we report successful metabolic engineering strategies for production of L-lysine from a strain of the fast-growing Synechococcus sp. strain PCC 7002.
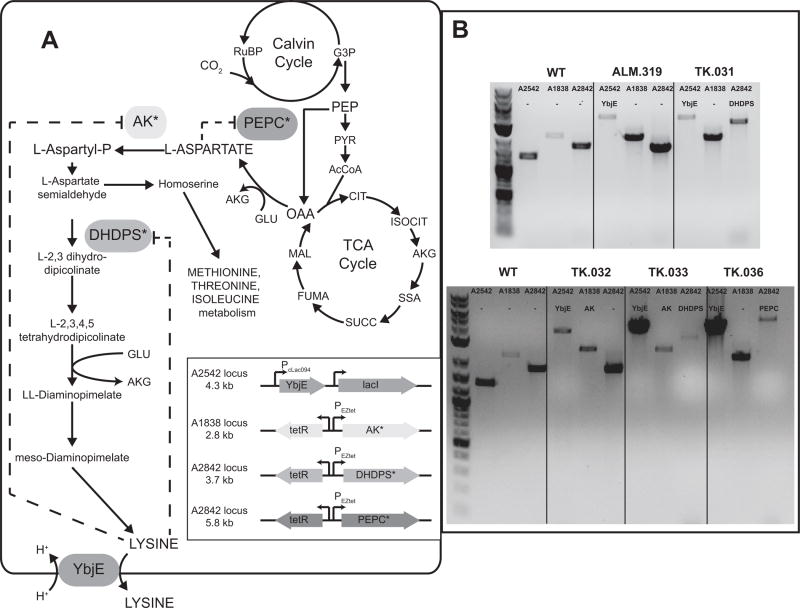
The structure and regulation of amino acid biosynthesis has been well studied and used to design metabolic engineering strategies in various bacteria. For example, a lysine producing C. glutamicum strain was rationally designed by overexpressing feedback-resistant enzyme variants that increased flux in relevant anaplerotic and biosynthetic reactions (Becker et al., 2011). L-lysine is a part of the aspartate-family of amino acids that also includes L-isoleucine, L-methionine, and L-threonine (Kirma et al., 2012). The precursors and metabolites in this amino acid family are interconnected to several parts of central metabolism and are homeostatically controlled by several transcriptional and/or post-translational mechanisms (Wittmann and Becker, 2007). In cyanobacteria, the anaplerotic reaction of phosphoenolpyruvate carboxylase (PEPC) combines PEP with HCO3− to generate oxaloacetate (Fig. 1). Oxaloacetate, a component of the modified cyanobacteria TCA cycle (Zhang and Bryant, 2011), is then converted to L-aspartate by aspartate aminotransferase where it enters the lysine biosynthetic pathway. High levels of L-aspartate negatively affect PEPC activity (O’Regan et al., 1989). L-aspartate is further converted to L-aspartyl-phosphate by aspartate kinase (AK), an enzyme that is subject to feedback inhibition by L-lysine and L-threonine at regulatory subunits. L-aspartyl-phosphate is then converted by aspartate semialdehyde dehydrogenase into L-aspartate semialdehyde. From this branch point, L-aspartate semialdehyde may either be converted into L-homoserine, which is used for biosynthesis of the other members of the aspartate family of amino acids; or into L-2,3 dihydropicolinate by dihydrodipicolinate synthase (DHDPS) in the lysine biosynthetic pathway. Like AK, DHDPS is also subject to feedback regulation by L-lysine and L-threonine. The variant of the lysine biosynthetic pathway in plants and cyanobacteria is distinct in that it uses a L,L-diaminopimelate aminotransferase to convert L-2,3,4,5 tetrahydrodipicolinate to L,L-diaminopimelate as opposed to the dehydrogenase, acetylase, and succinylase pathways found in most other organisms (Hudson et al., 2006). From L,L-diaminopimelate, subsequent epimerization and decarboxylation reactions are used to ultimately generate L-lysine, which then is then excreted by the transporter, lysE, in C. glutamicum (Kelle et al., 1996). A corresponding transporter in Synechococcus sp. strain PCC 7002 has not been identified.
Fig. 1.
(A) Overview of the L-lysine biosynthetic pathway in Synechococcus sp. strain PCC 7002. Insert shows a schematic representation of the integration and induction systems of the heterologous genes introduced into the listed genomic loci. Dashed arrows indicate the presence of allosteric regulation of the native enzymes. (B) Verification of chromosomal segregation of heterologous genes. Gels show bands corresponding to PCR products created from colonies of each strain using primers flanking each loci. The length of each expected band is listed in the inset of panel A.
Here, we report increased L-lysine excretion in the cyanobacterium Synechococcus sp. strain PCC 7002 (hereafter PCC 7002) with heterologous expression of the amino acid exporter ybjE from Escherichia coli. We also examined the effects of feedback-resistant AK, DHDPS, and PEPC variants on L-lysine productivity. The best producing strain was cultivated in laboratory photobioreactors to study L-lysine production dynamics during growth to a light-limited stationary phase. We examined the effects of media composition on L-lysine production and cellular growth rates by using nitrate, ammonia, and a N-/P-rich sidestream from a municipal wastewater treatment facility as a nutrient source. Our work demonstrates the potential of engineered photoautotrophic amino acid production in cyanobacteria.
2. Materials and Methods
2.1. Reagents and Media
Enzymes were purchased from New England Biolabs (Ipswich, MA). Nucleic acid purification materials were purchased from Qiagen (Venlo, Netherlands). Chemicals were purchased from Sigma-Aldrich (St. Louis, MO) or Fisher Scientific (Hampton, NH) unless otherwise specified.
2.2. Strain Construction
Heterologous genes were integrated onto the chromosome of wild-type PCC 7002 using homologous recombination (Davies et al., 2014). Expression cassettes were cloned into E. coli plasmids containing 500–1000 bp of homology targeting sequences to one of three PCC 7002 loci SYNPCC7002_A1838, SYNPCC7002_A2542, and/or SYNPCC7002_A2842 (Table 1). In these cassettes, genes were placed under control of the PcLac094 (Markley et al., 2015) or the PEZtet (Zess et al., 2016) inducible promoter system. Selection was performed by expression of an antibiotic resistance marker or using the acrylic acid counterselection system (Begemann et al., 2013). Plasmids were made using Gibson assembly (Gibson et al., 2009) with regions of homology added in the 5′ end of the primers. The feedback resistant C. glutamicum dapA gene (DHDPS) was codon optimized for PCC 7002 expression and chemically synthesized (Invitrogen) (Cremer et al., 1991). The ppc gene (PEPC) was amplified with the primers using Synechococcus elongatus (strain PCC 7942) genomic DNA. The site specific mutation in PEPC (N1015G) to remove feedback inhibition were based on (Chen et al., 2014). The lysC gene (AK) from Xenorhabdus bovienii (strain SS-2004) was codon optimized for PCC 7002 expression and chemically synthesized. The site specific mutation in AK (T369I) to remove feedback inhibition made to the original protein sequence was based on (Qi et al., 2011). Annotated vector files for the plasmids in Table 1 are available as Supplementary Material.
Table 1.
Plasmids Used in this study
| Name | Expression Cassette | |
|---|---|---|
| pADC181 | ΔSYNPCC7002_A2542::Pclac94-ybjE-aphII | This work |
| pTK043 | ΔSYNPCC7002_A2842::PtetO2-DHDPS-aacC1 | This work |
| pALM285 | ΔSYNPCC7002_A1838::PtetO2-AK | This work |
| pALM287 | ΔSYNPCC7002_A2842::PtetO2-PEPC- aacC1 | This work |
2.3. Culture Conditions
Strains were grown and maintained on Media A+ (Jr et al., 1973) with 1.5% Bacto-Agar. Strains with antibiotic resistance markers were selected on media with antibiotics (kanamycin, 100 μg/mL; gentamicin, 30 μg/mL) and strains with cassettes introduced in the SYNPCC7002_A1838 (acsA) locus were plated on 100 μM acrylic acid. Strains were grown in 250 ml baffled flasks with 50 mL Media A+ with 1% CO2-enriched air at 150 rpm in a Kuhner ISF1-X orbital shaker. Growth on wastewater-derived nutrients was accomplished as described elsewhere (Korosh et al., 2017). Briefly, filtrate from the anaerobic digester gravity belt filter (GBF), and effluent from the post-mainstream secondary treatment clarifier (secondary effluent) served as a diluent which was obtained from Nine Springs Wastewater Treatment Plant (Dane County, Wisconsin). To ensure complete nutrient requirements, the GBF media was supplemented with trace metals and vitamin B12 at the concentrations found in Media A+, as well as KH2PO4 at a molar ration of 1:32 soluble reactive phosphorus to bioavailable nitrogen due to the WASSTRIP process employed. GBF was used at a concentration of 12.5% (v/v) in secondary effluent. Temperature was maintained at 37°C or 27°C and light intensity was approximately 200 μmol photons m−2s−1 via a custom LED panel. Optical density was measured in a Genesys 20 spectrophotometer (Thermo Scientific) in 1-cm cuvette. Unless otherwise noted, 1 mM IPTG was used and/or 10–1000 ng ml−1 anhydrous tetracycline was used for induction studies.
2.4. Photobioreactor Cultivation of Synechococcus sp. strain PCC 7002 TK.032
A homemade photobioreactor system (Clark et al., 2017) was used for these experiments for growth with excess nutrients and CO2. The reactor vessels were 1 L Corning wide mouth bottles (10 cm diameter, surface area to volume ratio of 40 m−1). Radially averaged irradiance was 350 μmol PAR m−2 s−1 from cool white fluorescent tubes (4000K color temperature). Three photobioreactors were inoculated with TK.032 to an OD730 of 0.05 with a working volume of 930 mL of Media A supplemented with 110 mM NaNO3, 1.1 mM FeCl3, 5.2 mM KH2PO4, 100 μg mL−1 kanamycin, 1 mM IPTG, and 100 ng mL−1 anhydrous tetracycline. The temperature controller was set to maintain the reactors at 37°C. A gas phase containing 5% CO2 was introduced at a flow rate of 0.3 L min−1 and the system was given 1 hour to equilibrate, at which point the pH was adjusted to 7 by adding 1.7mL of 5 M NaOH. Time zero for the data reported (beginning of linear growth phase) was taken to be 48 hours after inoculation (OD730~1). Samples were taken approximately every 24 hours after adjusting the reactor volume with sterile MilliQ filtered water to make up for evaporation and the pH and OD730 were measured. An OD730 to g DW L−1 conversion was determined to be 0.26 g DW L−1 OD730−1 by weighing cell pellets washed three times with MilliQ filtered water and then lyophilized. Samples were centrifuged and the supernatant was saved for lysine quantification (stored at −20°C until measurement). Additional KH2PO4 was added in 5.2mM aliquots on days 2 and 6 (pH fluctuated between 6.7 and 7.2 as KH2PO4 was added and subsequently consumed).
2.5. Analytical Measurements
Samples were withdrawn periodically for biomass and lysine measurements, centrifuged, and the supernatant was stored at −20°C until quantification by HPLC (Shimadzu Co., Columbia, MD, USA) equipped with a quaternary pump, autosampler, vacuum degasser, photodiode array and fluorescence detector. HPLC separations were performed using a Xbridge C18 column (2.1 X 150 mM, 3.5 μm, Waters). The method employed a 20-minute linear gradient starting with 100% Buffer A: [925 ml of 100 mM Acetate (pH 6.95); 50 ml of HPLC Grade Methanol: 25 ml of HPLC Grade Tetrahydrofuran] to 100% Buffer B: [975 ml of HPLC Grade Methanol: 25 ml of HPLC Grade Tetrahydrofuran] before returning to the initial conditions for 10 mins. The flow rate was 0.400 mL/min, column temperature 40°C, and injection volume 10 μL. Amino acid samples and standards were quantified by comparison with peaks generated by monitoring the fluorescence (Ex 320 nm/Em 450 nm) of known amounts of standards in Media A+, after precolumn derivatization with 3 mg/ml o-phthalaldehyde with 3-mercaptopropionic acid in 0.4 M borate buffer.
Linear regression (excluding t0) was used to calculate rates of lysine production and growth. Carbon partitioning was calculated assuming 50% carbon by mass (Thomas, 2015). Chlorophyll a measurements were performed via a 100% chilled methanol extraction procedure (Miyashita et al., 1997). Chlorophyll a was calculated via the following equation: Chla = 16.29 * A665 − 8.54 * A652 (Porra et al., 1989).
3. Results
3.1. Lysine export is the first barrier to increased flux
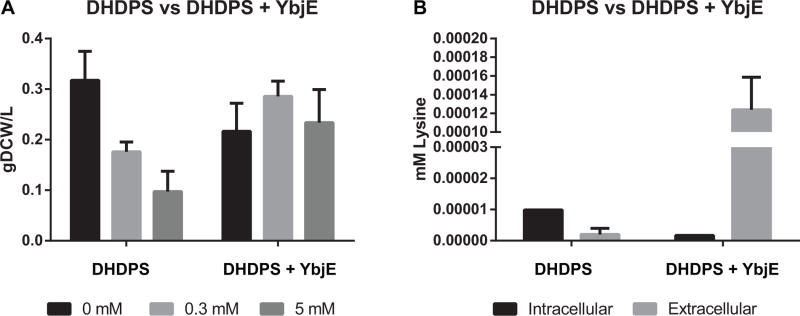
Amino acid biosynthesis is a highly regulated cellular process (Umbarger, 1978) and metabolic engineering strategies to increase production depend on by-passing native regulation. For example, expression of the feedback-insensitive DHDPS from C. glutamicum has been used to increase the free lysine content of canola seed (Falco et al., 1995). Therefore, for our first attempt at increasing lysine production, we integrated a modified DHDPS gene in the ΔSYNPCC7002_A1838 locus under control of the PcLac094 induction system (Markley et al., 2015), yielding strain AM.183. When this strain was cultured photoautotrophically, we observed a significant growth defect with increasing inducer concentration, as well as intracellular lysine accumulation (Fig. 2). Attempts to integrate other deregulated genes (e.g. PEPC, AK) from the lysine biosynthetic pathway and DHDPS under the control of strong PcLac promoters into wild type PCC 7002 failed to generate viable colonies. Therefore, we speculated that the increased intracellular lysine concentration could result from the lack of a lysine exporter and cause cellular toxicity by feedback inhibition of other amino acid pathways. A prior study indicated that L-lysine could be excreted from PCC 7002 into the media by an endogenous transport system (Baran et al., 2011), but homologs to known lysine transporters were not identifiable in the PCC 7002 genome. Our data suggested that if a native lysine efflux system existed it was a potential bottleneck. Therefore, we integrated the ybjE (lysO) transporter from E. coli in the SYNPCC7002_A2842 locus under the PcLac094 induction system, yielding strain AM.273. Cultures of AM.273 grew rapidly (no defect relative to WT) and generated a large pool of lysine in the extracellular media. From these experiments, we concluded that PCC7002 requires increased export flux to produce elevated levels of lysine. All subsequent experiments were based off a strain (AM.319) expressing ybjE in the SYNPCC7002_A2542 locus under Pclac94.
Fig. 2.
(A) Growth and (B) Lysine Production of ALM.183 (DHDPS) and ALM.273 (DHDPS + YbjE) induced with 0, 0.3, or 5 mM IPTG for 48 hrs under continuous illumination (200 μE m−2 s−1) with 1 % CO2 at 37°C. The data shown for intracellular and extracellular lysine are for samples induced with 0.3 mM IPTG. The values represent the mean ± SD of biological triplicates.
3.2. Modifying the flux to the aspartate family of amino acids
Having addressed the export barrier, we next explored the impact of known regulatory points in lysine biosynthesis by expressing feedback-resistant variants of key enzymes, AK, DHDPS, and PEPC (Cremer et al., 1991). Aspartate kinase (AK) plays a central role regulating the biosynthesis of the aspartate family of amino acids (Malumbres and Martín, 1996). Many natural AK are subject to feedback inhibition by lysine. To circumvent this regulation, AK variants have been engineered to remove this mechanism of control (Qi et al., 2011). Here, we integrated a gene encoding a feedback-insensitive variant of AK into the SYNPCC7002_A1838 locus of the base strain (AM.319) under control of the PEZtet induction system (strain TK.032). Attempts to integrate the AK under control of the stronger Pclac94 induction system were unsuccessful. To commit flux towards lysine and away from the other members of the aspartate family of amino acids, we integrated a feedback insensitive DHDPS into the SYNPCC7002_A2842 locus of AM.319 under the control of the PEZtet induction system to catalyze the conversion of aspartate semialdehyde to L-2,3 dihydropicolinate, generating strain TK.031. Phosphoenolpyruvate carboxylase (PEPC) fixes CO2 to generate oxaloacetate used in the modified TCA cycle and as a precursor to amino acids. We integrated PEPC into the SYNPCC7002_A2842 locus under the control of the PEZtet induction system to generate strain TK.036. The PEPC variant was cloned from Synechococcus elongatus (strain PCC 7942) and engineered to be feedback insensitive based off a point mutation that improved lysine production by 37% in C. glutamicum (Chen et al., 2014). Lastly, we assembled a DHDPS and AK overexpression strain by integrating the DHDPS cassette into TK.032 at the SYNPCC7002_A2842 locus to generate strain TK.033. Attempts to make other double and triple mutants failed to fully segregate or generate viable colonies. We cultivated each of these strains photoautotrophically in 250 ml baffled shake flasks under standard laboratory conditions of continuous illumination of 200 μE m−2 s−1 with 1 % CO2 at 37°C to compare growth rates and lysine productivity. Each strain was induced with 1 mM IPTG (to express ybjE) and varying levels of anhydrotetracycline (aTc is used to express enzymes linked to PEZtet). Relevant genotypes and performance metrics for strains used in these experiments are shown in Table 2.
Table 2.
Overview of lysine producing strains of Synechococcus sp. strain PCC 7002
| Strain | Genotype | T (°C) | Media | [aTc] (ng ml−1) | Linear Growth Rate (±SD) (gDCW L−1 h−1) | Productivity (±SE) (mmol lysine h−1) | %Carbon to Lysine (±SE) | Titer (±SD) (mM lysine) | ||
|---|---|---|---|---|---|---|---|---|---|---|
|
| ||||||||||
| A2542 | A1838 | A2842 | ||||||||
|
| ||||||||||
| AM.319 | ybjE | 37 | A+ | - | 0.027 ± 0.001 | 0.004 ± 0.002 | 2 ± 0.8 | 0.78 ± 0.13 | ||
| TK.032 | ybjE | AK | 37 | A+ | 10 | 0.021 ± 0.001 | 0.010 ± 0.001 | 7 ± 0.8 | 1.19 ± 0.14 | |
| TK.032 | ybjE | AK | 37 | A+ | 100 | 0.025 ± 0.001 | 0.010 ± 0.002 | 6 ± 1.2 | 1.25 ± 0.12 | |
| TK.032 | ybjE | AK | 37 | A+ | 1000 | 0.023 ± 0.002 | 0.019 ± 0.002 | 12 ± 1.1 | 1.74 ± 0.12 | |
|
| ||||||||||
| TK.032 | ybjE | AK | 37 | A+ | 1000 | 0.020 ± 0.002 | 0.021 ± 0.002 | 15 ± 0.0 | 1.67 ± 0.15 | |
| TK.031 | ybjE | DHDPS | 37 | A+ | 10 | 0.021 ± 0.001 | 0.007 ± 0.000 | 5 ± 0.3 | 0.67 ± 0.05 | |
| TK.031 | ybjE | DHDPS | 37 | A+ | 100 | 0.022 ± 0.001 | 0.012 ± 0.001 | 8 ± 0.1 | 1.07 ± 0.16 | |
| TK.031 | ybjE | DHDPS | 37 | A+ | 1000 | 0.019 ± 0.001 | 0.011 ± 0.001 | 8 ± 0.7 | 1.15 ± 0.31 | |
| TK.033 | ybjE | AK | DHDPS | 37 | A+ | 10 | 0.019 ± 0.001 | 0.008 ± 0.001 | 6 ± 0.9 | 0.80 ± 0.20 |
| TK.033 | ybjE | AK | DHDPS | 37 | A+ | 100 | 0.023 ± 0.001 | 0.010 ± 0.001 | 6 ± 0.3 | 0.80 ± 0.20 |
| TK.033 | ybjE | AK | DHDPS | 37 | A+ | 1000 | 0.016 ± 0.002 | 0.014 ± 0.002 | 12 ± 0.1 | 1.02 ± 0.11 |
|
| ||||||||||
| TK.032 | ybjE | AK | 37 | A+ | 1000 | 0.018 ± 0.002 | 0.019 ± 0.003 | 15 ± 0.1 | 1.33 ± 0.18 | |
| TK.036 | ybjE | PEPC | 37 | A+ | 10 | 0.022 ± 0.002 | 0.009 ± 0.002 | 6 ± 0.9 | 0.61 ± 0.12 | |
| TK.036 | ybjE | PEPC | 37 | A+ | 100 | 0.020 ± 0.002 | 0.009 ± 0.001 | 6 ± 0.4 | 0.58 ± 0.03 | |
| TK.036 | ybjE | PEPC | 37 | A+ | 1000 | 0.018 ± 0.001 | 0.008 ± 0.001 | 5 ± 0.9 | 0.55 ± 0.03 | |
|
| ||||||||||
| TK.032 | ybjE | AK | 37 | A+ w/24 mM NO3 | 100 | 0.013 ± 0.001 | 0.006 ± 0.001 | 7 ± 0.4 | 1.14 ± 0.46 | |
| TK.032a | ybjE | AK | 37 | A+ w/24 mM NH4 | 100 | 0.017 ± 0.001 | 0.020 ± 0.002 | 18 ± 0.0 | 3.11 ± 0.22 | |
|
| ||||||||||
| TK.032b | ybjE | AK | 27 | GBF | 1000 | 0.014 ± 0.002 | 0.003 ± 0.000 | 3 ± 0.3 | 0.28 ± 0.06 | |
| TK.032 | ybjE | AK | 27 | A+ | 1000 | 0 | nd | nd | nd | |
Note: All experiments done with 1% (v/v) CO2 and 200 μmol photons m−2s−1 and induction with 1 mM IPTG.
Blocked rows report data from experiments run at the same time.
pH was manually adjusted to ≈ 8 using NaOH daily
Gravity Belt Filtrate (GBF) was diluted to 12.5% (v/v) using secondary effluent both obtained from the Nine Springs Wastewater Treatment Plant (Dane County, Wisconsin, USA)
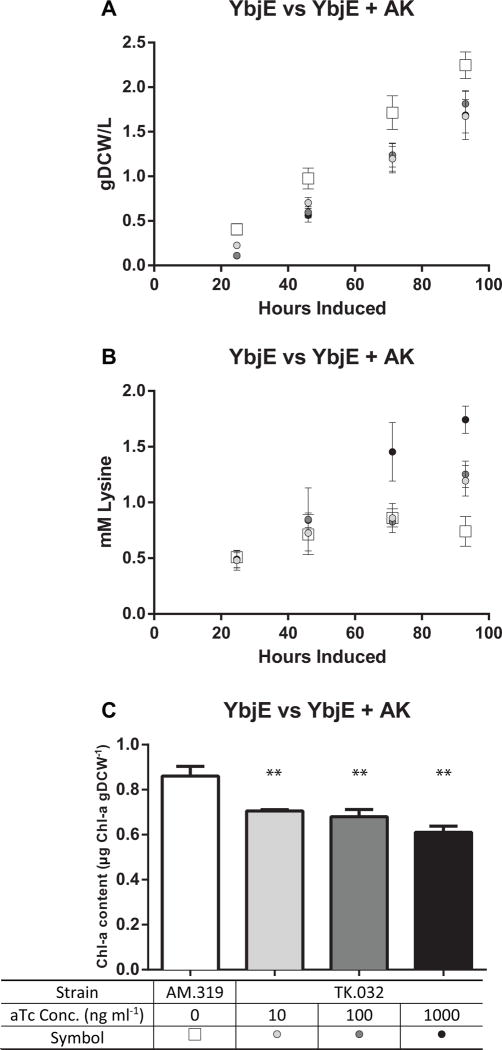
Induction of the AK in strain TK.032 diminished the linear growth rate relative to the base strain, AM.319 (Fig 3a, Table 2), but lysine production rates, titers, and the percentage of fixed carbon directed to lysine increased as the aTc dosage increased from 10 ng ml−1 to 1000 ng ml−1 (Fig. 3b). Volumetric productivities were much higher in the AK containing strain (TK.032 - 0.010–0.19 mM hr−1) than the parent strain (AM.319 - 0.004 mM hr−1) and increased with increasing aTc induction of AK. The increased productivity resulted in a 2-fold increase in lysine titer after 93 hrs (1.74 vs 0.78 mM) and a six-fold increase in the fraction of carbon directed to lysine (up to 12%). Given the decrease in growth rate relative to its parent, ALM.319, we were curious if production of lysine altered photosynthetic properties in TK.032. We extracted and measured the chlorophyll a content of ALM.319 and TK.032 46 hours post induction. Relative to ALM.319, chlorophyll a content was significantly reduced in TK.032 at all induction levels (Fig. 3c). We also tested the effect of Media A+ adjusted to a pH of 8.2 or 6.8 on TK.032’s lysine production, given pH’s effects on lysine transport (Kelle et al., 1996), however, no difference was found using carbon partitioning as a metric (Data Not Shown). These results indicate that AK activity is key node in lysine biosynthesis, full induction with aTc was the optimal level, and lysine productivity impacts cell growth.
Fig. 3.
(A) Growth, (B) Lysine Production, and (C) Chlorophyll a Content of ALM.319 and TK.032. The values represent the mean ± SD of biological triplicates. Experiments were performed with ALM.319 induced with 1 mM IPTG, and TK.032 induced with 10–1000 ng ml−1 aTc and 1 mM IPTG under continuous illumination (200 μE m−2 s−1) with 1 % CO2 at 37°C. Chlorophyll a was extracted 46 hrs post induction. Chl a levels in TK.032 with 10, 100, and 1000 ng ml−1 aTc were greatly reduced relative to ALM.319 (** represent p-value<0.05).
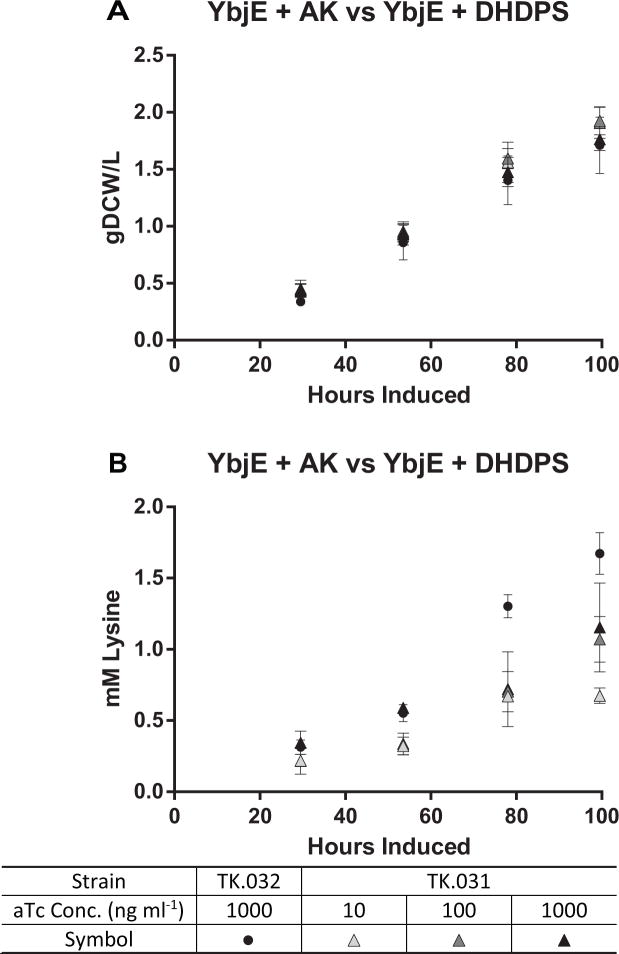
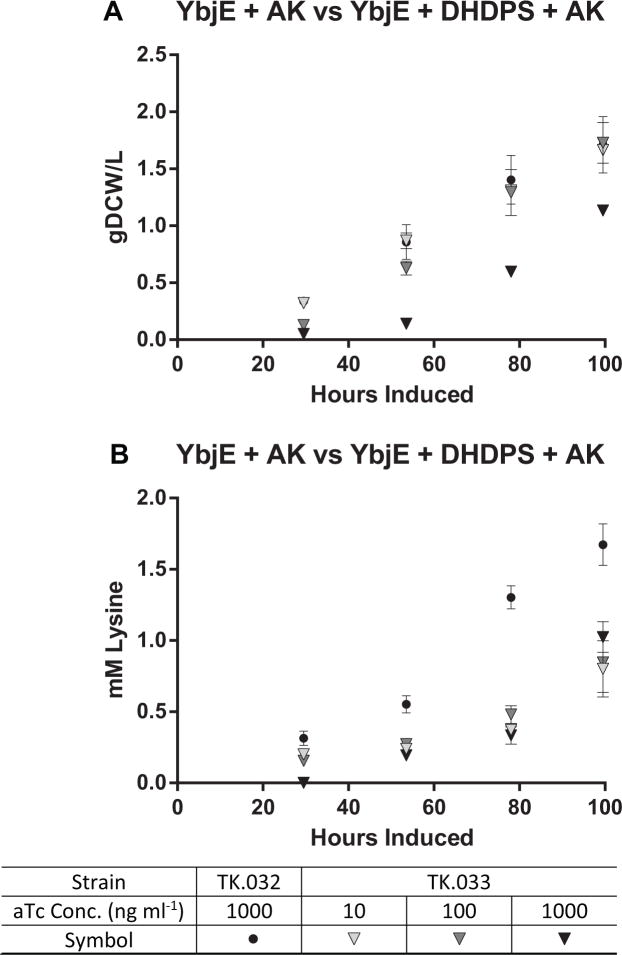
Next, we compared overexpression of AK and ybjE (strain TK.032) to DHDPS and ybjE (strain TK.031) across three inducer concentrations. The linear growth rate of TK.031 was comparable to TK.032 in each culture (Fig. 4a), but lysine production in TK.031 plateaued at 100 ng ml−1 aTc at lower levels (productivity: 0.01 mM h−1, titer: 1.2 mM, 8% carbon flux) (Fig. 4b, Table 2). These data indicated that AK has a stronger influence on lysine flux than DHDPS, but DHDPS also has influence on lysine flux. Therefore, we compared the AK expressing strain (TK.032) to a strain simultaneously expressing AK, and DHDPS (TK.033). In this experiment, there was a notable lag phase with increasing aTc dosage with TK.033 (Fig. 5a), decreasing the linear growth rate from 0.019 g DCW L−1 hr−1 with 10 ng ml−1 aTc to 0.016 g DCW L−1 hr−1 with 1000 ng ml−1. This may be due to the extreme limitation of biosynthetic flux towards the other amino acids in the aspartate superfamily, resulting in a synthetic auxotrophy. In comparison, the linear growth rate for TK.032 with 1000 ng ml−1 aTc was 0.020 g DCW L−1 hr−1 consistent with past trials. Lysine production from strain TK.033 peaked at the maximum aTc concentration (productivity: 0.013 mM hr−1; titer: 1 mM; 12% carbon to lysine) but remained inferior to strain TK.032 (Fig. 5b). From these data, we conclude that AK is more important to deregulating lysine flux than DHDPS in Synechococcus sp. strain PCC7002.
Fig. 4.
(A) Growth and (B) Lysine Production of TK.032 and TK.031. The values represent the mean ± SD of biological triplicates. Experiments were performed with TK.031 induced with 10–1000 ng ml−1 aTc and 1 mM IPTG, and TK.032 induced with 1000 ng ml−1 aTc and 1 mM IPTG under continuous illumination (200 μE m−2 s−1) with 1 % CO2 at 37°C
Fig. 5.
(A) Growth and (B) Lysine Production of TK.032 and TK.033. The values represent the mean ± SD of biological triplicates. Experiments were performed with TK.033 induced with 10–1000 ng ml−1 aTc and 1 mM IPTG, and TK.032 induced with 1000 ng ml−1 aTc and 1 mM IPTG under continuous illumination (200 μE m−2 s−1) with 1 % CO2 at 37°C
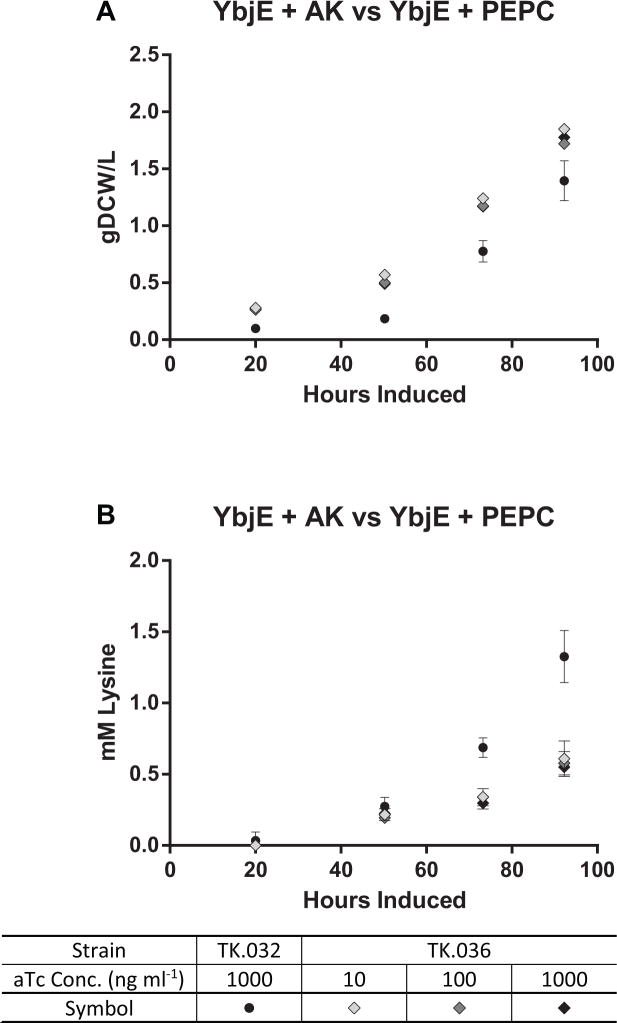
Last, we compared the effects of the feedback-insensitive PEPC (TK.036) to the deregulated AK (TK.032) on lysine productivity. Attempts to introduce this engineered PEPC in our AK overexpressing strain background were unsuccessful. In contrast, we were able to introduce a PEPC expression cassette in the ybjE background (TK.036), but its performance was greatly inferior to TK.032 at all aTc concentrations (Fig. 6). Maximum lysine volumetric productivity for TK.036 was 0.009 mM hr−1 which equates to 6% of carbon going to lysine. Despite the greater percentage of carbon fluxed to lysine, the final titer of this strain was less than the AM.319 base. This is mostly due to the significant reduction in growth rate. Given the superior performance of TK.032 over all other genetic backgrounds, we concluded that AK was the most important point of lysine regulation and TK.032 was used for all subsequent experiments.
Fig. 6.
(A) Growth and (B) Lysine Production of TK.032 and TK.036. The values represent the mean ± SD of biological triplicates. Experiments were performed with TK.036 induced with 10–1000 ng ml−1 aTc and 1 mM IPTG, and TK.032 induced with 1000 ng ml−1 aTc and 1 mM IPTG under continuous illumination (200 μE m−2 s−1) with 1 % CO2 at 37°C
3.2. Changing Nitrogen Sources
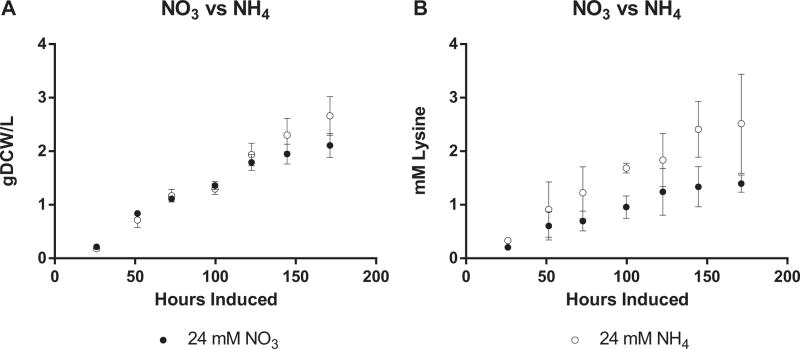
A key difference between producing amino acids and other organic acids is the presence of nitrogen (Wendisch et al., 2006). Balancing carbon and N-assimilation flux is complicated by their interconnected metabolic and regulatory pathways (Huergo and Dixon, 2015). Cyanobacteria growth media is commonly formulated with nitrate that is reduced to ammonia (serving as a sink for excess electrons) prior to assimilation (McNeely et al., 2014). In contrast, when wild-type PCC 7002 is fed ammonia as a N-source, cells grow slower and display significant chlorosis (Korosh et al., 2017). This can be overcome by providing an alternative electron sink such as biomass (providing elevated PCO2) or production of reduced compounds. For this reason, we hypothesized that a surplus of reducing power created by by-passing nitrate reduction could be used to enhance lysine biosynthesis. Therefore, we compared lysine production from TK.032 grown in media formulated with 24 mM NO3 (2x prior studies) to 24 mM NH4 (Fig. 7). Due in part to the NH4 transporter-induced medium acidification (Britto and Kronzucker, 2005), culture pH was maintained around 8.0 by addition of NaOH. In these conditions, cells grew slower in both elevated N-media formulations nitrate media (0.013 g DCW L−1 hr−1) with growth on ammonium (0.013 g DCW L−1 hr−1) slightly reduced from growth on Media A+. The lower growth rate and a reduced fraction of carbon going to lysine (7%) on nitrate media resulted in lower volumetric productivity 0.007 mM hr−1. In contrast, cultures grown on ammonium media produced lysine at higher rates (0.020 mM hr−1) and sent the largest percentage of carbon to lysine (18%). In addition, these cultures excreted other amino acids (Data Not Shown), which suggests that more lysine could be produced if the branch points could be more finely controlled. The difference in growth and productivity with ammonium emphasizes the importance of reducing power in lysine biosynthesis, which had been demonstrated with C. glutamicum (Becker et al., 2011).
Fig. 7.
(A) Growth and (B) Lysine Production of TK.032 with NO3 or NH4. The values represent the mean ± SD of biological triplicates. Experiments were performed with TK.032 cultivated induced with 100 ng ml−1 aTc and 1 mM IPTG under continuous illumination (200 μE m−2 s−1) with 1 % CO2 at 37°C. pH control with 24 mM NH4+ was maintained at ≈ 8 by manually adjusting with NaOH.
3.3. Lysine Production in Dilute Anaerobic Digestate
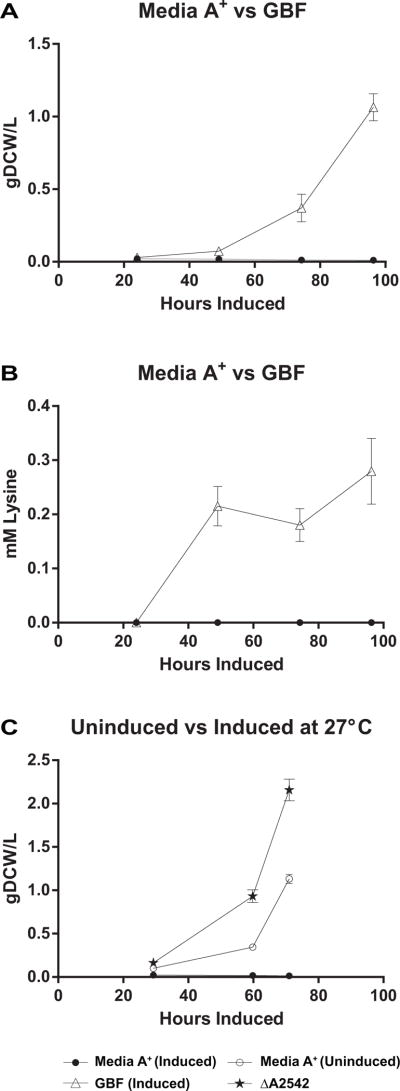
Given the cost of fertilizers, it is attractive to consider alternative sources of low-cost nitrogen and phosphate such as anaerobic digestor and/or municipal waste water streams Anaerobic digestion effluent from municipal wastewater has previously been used as a nutrient source for cyanobacterial cultivation and lactate production (Hollinshead et al., 2014), but there are many potential toxicants that could limit its widespread adoption. We have previously demonstrated that a physiological adaptation at 27°C is necessary to allow growth of PCC 7002 in filtrate recycled from the gravity belt (GBF) of a local municipal water treatment plant (Korosh et al., 2017). The GBF provides a nitrogen- (predominantly NH4+) and phosphate-source. Therefore, we compared growth and lysine production in cultures of TK.032 using diluted GBF or Media A+ at 27°C (Fig. 8). In GBF based media, TK.032 grew more slowly (0.014 g DCW L−1 hr−1) and directed only 3% of carbon to lysine resulting in low titer (0.28 mM) and volumetric productivity 0.003 mM hr−1. Interestingly, after induction in Media A+ at this temperature, cultures were notably chlorotic, growth ceased, and lysine was not detectable. This growth defect was only apparent upon induction (Fig. 8c) and is likely due to the transporter imposed nitrate limitation at low temperatures (Sakamoto and Bryant, 1998). We postulate that this perceived nitrate limitation at low temperatures is circumvented in wastewater based media, due to the high levels of ammonium naturally present.
Fig. 8.
(A) Growth and (B) Lysine Production of TK.032 with Dilute Anaerobic Digestate (GBF) or Media A+ (C) Effect of Temperature on Growth of ΔA2542 and TK.032 +/− Induction in Media A+. The values represent the mean ± SD of biological triplicates. Experiments were performed with TK.032 induced with 1000 ng ml−1 aTc and 1 mM IPTG under continuous illumination (200 μE m−2 s−1) with 1 % CO2 at 27°C.
3.4. Batch Growth and Lysine Production of TK.032 in Photobioreactors
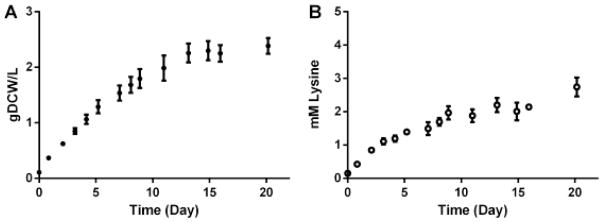
Industrial implementation of cyanobacterial lysine production would likely occur in light- limited batch culture with lower surface to volume ratios than the flasks used in the work described above. To investigate the dynamics of lysine production in such a process, we cultivated TK.032 in homemade laboratory photobioreactors (Clark et al., 2017) in Media A supplemented with excess NaNO3, KH2PO4, FeCl3, and CO2 (Fig. 9). The initial linear growth rate and linear rate of L-lysine production for each reactor was calculated from growth data from the first 76 hours of the linear growth phase. For three biological replicates, the mean linear growth rate of TK.032 was 10(±0.4) mg DW L−1 hr−1 (S.E.) and the mean linear rate of L-lysine production was 13(±0.5) μM L-lysine hr−1. This corresponds to directing 18% of carbon flux to lysine which was comparable to that of TK.032 grown in shake flasks at the same induction level. When the cultures entered stationary phase after 20 days, the biomass concentration was 2.4(±0.1) g DW L−1 and the L-lysine titer was 2.7(±0.3) mM L-lysine.
Fig. 9.
Batch growth and lysine production of TK.032 in a light-limited photobioreactor. Time zero was 48 hours after inoculation and induction (100 ng mL−1 aTc and 1 mM IPTG) where the cultures were at sufficient cell density to be in linear growth phase. Error bars represent the standard error of the mean of three biological replicates.
4. Discussion
In this project, we successfully engineered the cyanobacterium, Synechococcus sp. PCC 7002 to express feedback resistant versions of enzymes in the lysine biosynthetic pathway as a model for photosynthetic production of L-lysine. Simultaneous expression of an engineered aspartate kinase and lysine transporter was sufficient for high productivities, but also led to decreased chlorophyll content. Increasing the reductant supply by using NH4+, a more reduced nitrogen source relative to NO3, gave a twofold increase in productivity. Our highest volumetric productivity for lysine was 0.003 g L−1 h−1, which is comparable carbon partitioning for PCC 7002 engineered to produce ethanol (0.010 g L−1 h−1) (Dühring et al., 2014). However, this pales in comparison to the heterotrophic lysine productivity of 4.0 g L−1 h−1 achieved with C. glutamicum (Becker et al., 2011).
Some of the limitations for producing amino acids in photoautotrophic hosts may be due to the relatively small flux of the TCA cycle, which has been demonstrated under numerous growth conditions in 13C-MFA studies (Wan et al., 2017). The aspartate family of amino acids is intertwined in both catabolic and anabolic processes in the TCA cycle (Galili, 2011). During photoautotrophic growth, the TCA cycle has been shown to primarily operate as a bifurcated pathway to generate necessary precursor metabolites, oxaloacetate and α-ketoglutarate (Steinhauser et al., 2012). Although, several species of cyanobacteria have since been shown to have the enzymatic capacity to operate a closed TCA cycle through bypass reactions (Xiong et al., 2014; Zhang and Bryant, 2011). The exact reason for this discrepancy has been highly debated, but it has been proposed to be a result of niche specialization (Zhang et al., 2016). Researchers have recently modified photoautotrophic flux in the TCA cycle by the introduction of a heterologous GABA shunt, which may be used to extend the plasticity of this metabolic node in future studies (Zhang et al., 2016).
Tools such as flux balance analysis may also reveal novel metabolic engineering approaches suitable for the constraints of photoautotrophic metabolism (Rügen et al., 2015). For example, introduction of a pyruvate carboxylase may also increase the metabolic flexibility of the PEP-pyruvate-oxaloacetate node, thereby leading to lead to an increase in precursor supply. While most organisms contain a subset of enzymes to ensure optimal carbon and energy flux at this anaplerotic node, C. glutamicum is a noted exception (Sauer and Eikmanns, 2005). In lysine producing strains of C. glutamicum, flux through the energy consuming C3 rather than the C4 carboxlylation reaction is the predominant anaplerotic route, suggesting a need for increased futile cycling in these conditions (Marx et al., 1999, 1996). The high pyruvate/PEP ratio in PCC 7002 (Dempo et al., 2014) may make this an attractive option for future work.
Lysine production in TK.032 was met with decreased chlorophyll content per cell (Fig. 3c). Decreased chlorophyll content has previously been seen in tobacco plants engineered to have elevated levels of free lysine (Azevedo et al., 1997). This implies a change in physiology during lysine production. This is contrary to cyanobacteria engineered to export sucrose (Ducat, 2016). This finding may represent the current ceiling in carbon-flux redistribution during photoautotrophic lysine production, due to the limited metabolic flux of the autotrophic TCA cycle, which has been put forth by experimental and computational approaches (Broddrick et al., 2016; Nogales et al., 2012; Song et al., 2015; Young et al., 2011).
Given our laboratory strain performance in wastewater medium, we can extrapolate to a conservative aerial lysine productivity of ~100 (Winter) - 250 (Summer) g of Lysine/m2/year using estimates of aerial biomass productivities from 9.4 (Winter) - 23.5 (Summer) gDCW/m2/day in an open pond system with a marine cyanobacterium (Moreno et al., 2003), and the 3% of carbon flux to lysine in our wastewater production conditions. In comparison, current United States areal productivities are ~775 g of Lysine/m2/Year. This figure is based on the mean annual yield of sugar crops in the United States (Michael McConnell, n.d.), assuming a glucose production rate of 6.5 mol/m2/Year and the maximum theoretical yield (0.82 mol L-lysine mol−1 glucose) for C. glutamicum (Wittmann and Becker, 2007). These figures highlight the areal productivity of cyanobacteria utilizing non-traditional nutrient sources, with the added benefit of wastewater polishing for discharge. That said, to take advantage of this trait, titers must be increased to keep the cost of purification low (Hermann, 2003) and productivities must be increased to reduce the capital costs needed to produce a target amount of amino acid. It is also important to note that these extrapolated productivities do not take into account operating costs associated with purification and extraction (Quiroz-Arita et al., 2017) or any spatial variation in the availability of wastewater (Roostaei and Zhang, 2017). The integration of the multitude of ‘-omics’ data into genome scale metabolic models, in particular with isotopically nonstationary metabolic flux analysis in over producer strains (Adebiyi et al., 2015), will enable more accurate representations of the flux control of the branch points in non-model organisms, and further development of a photosynthetic chemical platform.
Supplementary Material
Highlights.
Engineered lysine pathway of Synechococcus sp. strain PCC 7002 for secretion
Lysine exporter and deregulated aspartate kinase were the key steps
Upwards of 18% of fixed carbon was sent to lysine
Gravity belt filtrate from a municipal wastewater plant can be used as a N-source
Acknowledgments
This work was funded by the US National Science Foundation (EFRI-1240268, GEO-1215871). TCK is the recipient of a National Institutes of Health (NIH) Biotechnology Training Fellowship (NIGMS-5 T32 GM08349) and a fellowship from the UW-Madison College of Engineering’s Graduate Engineering Research Scholars (GERS) program. The authors are grateful to Austin Comer for construction of pADC181, as well as Richard Mikel, Matthew Dysthe, and Derek Jacobs for help with routine sampling.
Abbreviations
- WT
wild-type
- PEPC
phosphoenolpyruvate carboxylase
- AK
aspartate kinase
- DHDPS
dihydrodipicolinate synthase
- Chl a
chlorophyll a
- DCW
dry cell weight
- TCA cycle
tricarboxylic acid cycle
- OD730
optical density at 730 nm
- GBF
Gravity belt filtrate
Footnotes
Publisher's Disclaimer: This is a PDF file of an unedited manuscript that has been accepted for publication. As a service to our customers we are providing this early version of the manuscript. The manuscript will undergo copyediting, typesetting, and review of the resulting proof before it is published in its final citable form. Please note that during the production process errors may be discovered which could affect the content, and all legal disclaimers that apply to the journal pertain.
References
- Adebiyi AO, Jazmin LJ, Young JD. 13C flux analysis of cyanobacterial metabolism. Photosynth Res. 2015;126:19–32. doi: 10.1007/s11120-014-0045-1. [DOI] [PubMed] [Google Scholar]
- Azevedo RA, Arruda P, Turner WL, Lea PJ. The biosynthesis and metabolism of the aspartate derived amino acids in higher plants. Phytochemistry. 1997;46:395–419. doi: 10.1016/S0031-9422(97)00319-1. [DOI] [PubMed] [Google Scholar]
- Baran R, Bowen BP, Northen TR. Untargeted metabolic footprinting reveals a surprising breadth of metabolite uptake and release by Synechococcus sp PCC 7002. Mol Biosyst. 2011;7:3200–6. doi: 10.1039/c1mb05196b. [DOI] [PubMed] [Google Scholar]
- Becker J, Zelder O, Hüfner S, Schröder H, Wittmann C. From zero to hero-Design-based systems metabolic engineering of Corynebacterium glutamicum for l-lysine production. Metab Eng. 2011;13:159–168. doi: 10.1016/j.ymben.2011.01.003. [DOI] [PubMed] [Google Scholar]
- Begemann MB, Zess EK, Walters EM, Schmitt EF, Markley AL, Pfleger BF. An organic acid based counter selection system for cyanobacteria. PLoS One. 2013;8:e76594. doi: 10.1371/journal.pone.0076594. [DOI] [PMC free article] [PubMed] [Google Scholar]
- Brautaset T, Ellingsen TE. Lysine: Industrial Uses and Production. Comprehensive Biotechnology. 2011:541–554. doi: 10.1016/B978-0-08-088504-9.00220-8. [DOI] [Google Scholar]
- Britto DT, Kronzucker HJ. Nitrogen acquisition, PEP carboxylase, and cellular pH homeostasis: new views on old paradigms. Plant, Cell Environ. 2005;28:1396–1409. doi: 10.1111/j.1365-3040.2005.01372.x. [DOI] [Google Scholar]
- Broddrick JT, Rubin BE, Welkie DG, Du N, Mih N, Diamond S, Lee JJ, Golden SS, Palsson BO. Unique attributes of cyanobacterial metabolism revealed by improved genome-scale metabolic modeling and essential gene analysis. Proc Natl Acad Sci. 2016;113:E8344–E8353. doi: 10.1073/pnas.1613446113. [DOI] [PMC free article] [PubMed] [Google Scholar]
- Chen Z, Bommareddy RR, Frank D, Rappert S, Zeng AP. Deregulation of feedback inhibition of phosphoenolpyruvate carboxylase for improved lysine production in Corynebacterium glutamicum. Appl Environ Microbiol. 2014;80:1388–1393. doi: 10.1128/AEM.03535-13. [DOI] [PMC free article] [PubMed] [Google Scholar]
- Clark RL, McGinley LL, Quevedo DF, Root TW, Pfleger BF. Construction and Operation of an Affordable Laboratory Photobioreactor System for Simultaneous Cultivation of up to 12 Independent 1 L Cyanobacterial Cultures. 2017 bioRxiv. [Google Scholar]
- Cremer J, Eggeling L, Sahm H. Control of the lysine biosynthesis sequence in Corynebacterium glutamicum as analyzed by overexpression of the individual corresponding genes. Appl Environ Microbiol. 1991;57:1746–1752. doi: 10.1128/aem.57.6.1746-1752.1991. [DOI] [PMC free article] [PubMed] [Google Scholar]
- Davies FK, Work VH, Beliaev AS, Posewitz MC. Engineering Limonene and Bisabolene Production in Wild Type and a Glycogen-Deficient Mutant of Synechococcus sp PCC 7002. Front Bioeng Biotechnol. 2014;2:1–11. doi: 10.3389/fbioe.2014.00021. [DOI] [PMC free article] [PubMed] [Google Scholar]
- Dempo Y, Ohta E, Nakayama Y, Bamba T, Fukusaki E. Molar-Based Targeted Metabolic Profiling of Cyanobacterial Strains with Potential for Biological Production. Metabolites. 2014;4:499–516. doi: 10.3390/metabo4020499. [DOI] [PMC free article] [PubMed] [Google Scholar]
- Ducat D. Increased Photochemical Efficiency in Cyanobacteria via an Engineered Sucrose Sink. Plant Cell Physiol. 2016;0:1–10. doi: 10.1093/pcp/pcw169. [DOI] [PubMed] [Google Scholar]
- Dühring U, Baier K, Germer F, Shi T. Genetically enhanced cyanobacteria for the production of a first chemical compound harbouring zn2+, co2+ or ni2+-inducible promoters 2014 [Google Scholar]
- Eggeling L, Bott M. A giant market and a powerful metabolism: l-lysine provided by Corynebacterium glutamicum. Appl Microbiol Biotechnol. 2015;99:3387–3394. doi: 10.1007/s00253-015-6508-2. [DOI] [PubMed] [Google Scholar]
- Falco SC, Guida T, Locke M, Mauvais J, Sanders C, Ward RT, Webber P. Transgenic canola and soybean seeds with increased lysine. Biotechnology. 1995;13:577–82. doi: 10.1038/nbt0695-577. [DOI] [PubMed] [Google Scholar]
- Galili G. The aspartate-family pathway of plants. Plant Signal Behav. 2011;6:192–195. doi: 10.4161/psb.6.2.14425. [DOI] [PMC free article] [PubMed] [Google Scholar]
- Gibson DG, Young L, Chuang RY, Venter JC, Hutchison CA, Smith HO. Enzymatic assembly of DNA molecules up to several hundred kilobases. Nat Methods. 2009;6:343–5. doi: 10.1038/nmeth.1318. [DOI] [PubMed] [Google Scholar]
- Hermann T. Industrial production of amino acids by coryneform bacteria. J Biotechnol. 2003;104:155–172. doi: 10.1016/S0168-1656(03)00149-4. [DOI] [PubMed] [Google Scholar]
- Hollinshead WD, Varman AM, You L, Hembree Z, Tang YJ. Boosting D-lactate production in engineered cyanobacteria using sterilized anaerobic digestion effluents. Bioresour Technol. 2014;169:462–467. doi: 10.1016/j.biortech.2014.07.003. [DOI] [PubMed] [Google Scholar]
- Hudson O, Singh BK, Leustek T, Gilvarg C. An LL -Diaminopimelate Aminotransferase Defines a Novel Variant of the Lysine Biosynthesis Pathway in Plants. Plant Physiol. 2006;140:292–301. doi: 10.1104/pp.105.072629.have. [DOI] [PMC free article] [PubMed] [Google Scholar]
- Huergo LF, Dixon R. The Emergence of 2-Oxoglutarate as a Master Regulator Metabolite. Microbiol Mol Biol Rev. 2015;79:419–35. doi: 10.1128/MMBR.00038-15. [DOI] [PMC free article] [PubMed] [Google Scholar]
- SS, Patterson C, Myers J. The Production of Hydrogen Peroxide by Blue-Green Algae: A Survey. J Phycol 1973 [Google Scholar]
- Kelle R, Laufer B, Brunzema C, Weuster-Botz D, Krämer R, Wandrey C. Reaction engineering analysis of L-lysine transport by Corynebacterium glutamicum. Biotechnol Bioeng. 1996;51:40–50. doi: 10.1002/(SICI)1097-0290(19960705)51:1<40::AID-BIT5>3.0.CO;2-0. [DOI] [PubMed] [Google Scholar]
- Kirma M, Araújo WL, Fernie AR, Galili G. The multifaceted role of aspartate-family amino acids in plant metabolism. J Exp Bot. 2012;63:4995–5001. doi: 10.1093/jxb/ers119. [DOI] [PubMed] [Google Scholar]
- Korosh TC, Dutcher A, Pfleger BF, McMahon K. Cyanobacterial Growth on Municipal Wastewater Requires Low Temperatures. bioRxiv. 2017 doi: 10.1128/mSphere.00538-17. [DOI] [PMC free article] [PubMed] [Google Scholar]
- Malumbres M, Martín JF. Molecular control mechanisms of lysine and threonine biosynthesis in amino acid-producing corynebacteria: Redirecting carbon flow. FEMS Microbiol Lett. 1996;143:103 LP–114. doi: 10.1111/j.1574-6968.1996.tb08468.x. [DOI] [PubMed] [Google Scholar]
- Markley AL, Begemann MB, Clarke RE, Gordon GC, Pfleger BF. A synthetic biology toolbox for controlling gene expression in the cyanobacterium Synechococcus sp PCC 7002. ACS Synth Biol. 2015;4:595–603. doi: 10.1021/sb500260k. [DOI] [PMC free article] [PubMed] [Google Scholar]
- Marx A, de Graaf AA, Wiechert W, Eggeling L, Sahm H. Determination of the fluxes in the central metabolism of Corynebacterium glutamicum by nuclear magnetic resonance spectroscopy combined with metabolite balancing. Biotechnol Bioeng. 1996;49:111–129. doi: 10.1002/(SICI)1097-0290(19960120)49:2<111::AID-BIT1>3.0.CO;2-T. [DOI] [PubMed] [Google Scholar]
- Marx A, Eikmanns BJ, Sahm H, de Graaf AA, Eggeling L. Response of the central metabolism in Corynebacterium glutamicum to the use of an NADH-dependent glutamate dehydrogenase. Metab Eng. 1999;1:35–48. doi: 10.1006/mben.1998.0106. [DOI] [PubMed] [Google Scholar]
- McNeely K, Kumaraswamy GK, Guerra T, Bennette N, Ananyev G, Dismukes GC. Metabolic switching of central carbon metabolism in response to nitrate: Application to autofermentative hydrogen production in cyanobacteria. J Biotechnol. 2014;182–183:83–91. doi: 10.1016/j.jbiotec.2014.04.004. [DOI] [PubMed] [Google Scholar]
- McConnell Michael. USDA ERS - Sugar and Sweeteners Yearbook Tables [WWW Document] United States Dep. Agric. Res. Serv; n.d. [accessed 8.25.17]. URL http://www.ers.usda.gov/data-products/sugar-and-sweeteners-yearbook-tables.aspx#.U43Z6PldWJt. [Google Scholar]
- Miyashita H, Adachi K, Kurano N, Ikemot H, Chihara M, Miyach S. Pigment composition of a novel oxygenic photosynthetic prokaryote containing chlorophyll d as the major chlorophyll. Plant cell Physiol. 1997;38:274–281. [Google Scholar]
- Moreno J, Vargas MÁ, Rodríguez H, Rivas J, Guerrero MG. Outdoor cultivation of a nitrogen-fixing marine cyanobacterium, Anabaena sp ATCC 33047. Biomol Eng. 2003;20:191–197. doi: 10.1016/S1389-0344(03)00051-0. [DOI] [PubMed] [Google Scholar]
- Nogales J, Gudmundsson S, Knight EM, Palsson BO, Thiele I. Detailing the optimality of photosynthesis in cyanobacteria through systems biology analysis. Proc Natl Acad Sci U S A. 2012;109:2678–83. doi: 10.1073/pnas.1117907109. [DOI] [PMC free article] [PubMed] [Google Scholar]
- O’Regan M, Thierbach G, Bachmann B, Villeval D, Lepage P, Viret JF, Lemoine Y. Cloning and nucleotide sequence of the phosphoenolpyruvate carboxylase-coding gene of Corynebacterium glutamicum ATCC13032. Gene. 1989;77:237–251. doi: 10.1016/0378-1119(89)90072-3. doi: https://doi.org/10.1016/0378-1119(89)90072-3. [DOI] [PubMed] [Google Scholar]
- Oliver JWK, Atsumi S. Metabolic design for cyanobacterial chemical synthesis. Photosynth Res. 2014;120:249–61. doi: 10.1007/s11120-014-9997-4. [DOI] [PubMed] [Google Scholar]
- Pate R, Klise G, Wu B. Resource demand implications for US algae biofuels production scale-up. Appl Energy. 2011;88:3377–3388. doi: http://dx.doi.org/10.1016/j.apenergy.2011.04.023. [Google Scholar]
- Porra RJ, Thompson WA, Kriedemann PE. Determination of accurate extinction coefficients and simultaneous equations for assaying chlorophylls a and b extracted with four different solvents: verification of the concentration of chlorophyll standards by atomic absorption spectroscopy. Biochim Biophys Acta (BBA)-Bioenergetics. 1989;975:384–394. [Google Scholar]
- Qi Q, Huang J, Crowley J, Ruschke L, Goldman BS, Wen L, Rapp WD. Metabolically engineered soybean seed with enhanced threonine levels: biochemical characterization and seed-specific expression of lysine-insensitive variants of aspartate kinases from the enteric bacterium Xenorhabdus bovienii. Plant Biotechnol J. 2011;9:193–204. doi: 10.1111/j.1467-7652.2010.00545.x. [DOI] [PubMed] [Google Scholar]
- Quiroz-Arita C, Sheehan JJ, Bradley TH. Life cycle net energy and greenhouse gas emissions of photosynthetic cyanobacterial biorefineries: Challenges for industrial production of biofuels. Algal Res. 2017:1–8. doi: 10.1016/j.algal.2017.06.021. [DOI] [Google Scholar]
- Roostaei J, Zhang Y. Spatially Explicit Life Cycle Assessment: Opportunities and challenges of wastewater-based algal biofuels in the United States. Algal Res. 2017;24:395–402. doi: 10.1016/j.algal.2016.08.008. [DOI] [Google Scholar]
- Rügen M, Bockmayr A, Steuer R. Elucidating temporal resource allocation and diurnal dynamics in phototrophic metabolism using conditional FBA. Sci Rep. 2015;5:15247. doi: 10.1038/srep15247. [DOI] [PMC free article] [PubMed] [Google Scholar]
- Sakamoto T, Bryant Da. Growth at low temperature causes nitrogen limitation in the cyanobacterium Synechococcus sp PCC 7002. Arch Microbiol. 1998;169:10–9. doi: 10.1007/s002030050535. [DOI] [PubMed] [Google Scholar]
- Sauer U, Eikmanns BJ. The PEP-pyruvate-oxaloacetate node as the switch point for carbon flux distribution in bacteria. FEMS Microbiol Rev. 2005;29:765–794. doi: 10.1016/j.femsre.2004.11.002. [DOI] [PubMed] [Google Scholar]
- Song HS, McClure R, Bernstein H, Overall C, Hill E, Beliaev A. Integrated in silico Analyses of Regulatory and Metabolic Networks of Synechococcus sp PCC 7002 Reveal Relationships between Gene Centrality and Essentiality. Life. 2015;5:1127–1140. doi: 10.3390/life5021127. [DOI] [PMC free article] [PubMed] [Google Scholar]
- Steinhauser D, Fernie AR, Araújo WL. Unusual cyanobacterial TCA cycles: not broken just different. Trends Plant Sci. 2012;17:503–9. doi: 10.1016/j.tplants.2012.05.005. [DOI] [PubMed] [Google Scholar]
- Thomas E. Microbial growth and physiology: A call for better craftsmanship. Front Microbiol. 2015;6:1–12. doi: 10.3389/fmicb.2015.00287. [DOI] [PMC free article] [PubMed] [Google Scholar]
- Umbarger HE. Amino Acid Biosynthesis and its Regulation. Annu Rev Biochem. 1978;47:533–606. doi: 10.1146/annurev.bi.47.070178.002533. [DOI] [PubMed] [Google Scholar]
- Wan N, DeLorenzo DM, He L, You L, Immethun CM, Wang G, Baidoo EEK, Hollinshead W, Keasling JD, Moon TS, Tang YJ. Cyanobacterial carbon metabolism: Fluxome plasticity and oxygen dependence. Biotechnol Bioeng. 2017:1–32. doi: 10.1002/bit.26287. [DOI] [PubMed] [Google Scholar]
- Wendisch VF, Bott M, Eikmanns BJ. Metabolic engineering of Escherichia coli and Corynebacterium glutamicum for biotechnological production of organic acids and amino acids. Curr Opin Microbiol. 2006;9:268–74. doi: 10.1016/j.mib.2006.03.001. [DOI] [PubMed] [Google Scholar]
- Wittmann C, Becker J. Amino Acid Biosynthesis~ Pathways, Regulation and Metabolic Engineering. Springer; 2007. The L-lysine story: from metabolic pathways to industrial production; pp. 39–70. [Google Scholar]
- Xiong W, Brune D, Vermaas WFJ. The -aminobutyric acid shunt contributes to closing the tricarboxylic acid cycle in Synechocystis sp PCC 6803. Mol Microbiol. 2014;93:786–796. doi: 10.1111/mmi.12699. [DOI] [PubMed] [Google Scholar]
- Young JD, Shastri Aa, Stephanopoulos G, Morgan Ja. Mapping photoautotrophic metabolism with isotopically nonstationary (13)C flux analysis. Metab Eng. 2011;13:656–65. doi: 10.1016/j.ymben.2011.08.002. [DOI] [PMC free article] [PubMed] [Google Scholar]
- Zess EK, Begemann MB, Pfleger BF. Construction of new synthetic biology tools for the control of gene expression in the cyanobacterium Synechococcus sp strain PCC 7002. Biotechnol Bioeng. 2016;113:424–432. doi: 10.1002/bit.25713. [DOI] [PubMed] [Google Scholar]
- Zhang S, Bryant DA. The tricarboxylic acid cycle in cyanobacteria. Science. 2011;334:1551–3. doi: 10.1126/science.1210858. [DOI] [PubMed] [Google Scholar]
- Zhang S, Qian X, Chang S, Dismukes GC, Bryant DA. Natural and Synthetic Variants of the Tricarboxylic Acid Cycle in Cyanobacteria: Introduction of the GABA Shunt into Synechococcus sp PCC 7002. Front Microbiol. 2016;7:1–13. doi: 10.3389/fmicb.2016.01972. [DOI] [PMC free article] [PubMed] [Google Scholar]
Associated Data
This section collects any data citations, data availability statements, or supplementary materials included in this article.


