

Abstract
This unit gives an introduction to the basic techniques of optical biosensing for measuring equilibrium and kinetics of reversible protein interactions. Emphasis is given to the description of robust approaches that will provide reliable results with few assumptions. How to avoid the most commonly encountered problems and artifacts is also discussed.
INTRODUCTION
During the last two decades, optical evanescent wave biosensors, such as surface plasmon resonance, interference, or waveguide biosensors, have become a popular technique for the characterization of protein-protein interactions in many fields (Schuck, 1997b; Margulies et al., 1993; van der Merwe and Barclay, 1996; Malmborg and Borrebaeck, 1995; Garland, 1996; Chavanieu and Pugnière, 2016; de Mol, 2012; Safina, 2012; Rusnati et al., 2015). This includes both the determination of equilibrium binding constants, which reveal the magnitude of the binding energy, as well as the determination of the bimolecular rate constants describing the kinetics of the interaction, in addition to screening applications.
Studying protein interactions at a surface, as opposed to solution methods, has at least two fundamental advantages. First, the magnitude of the signal involved is independent of the affinity of the interaction over a wide range. Because one binding partner is confined to the surface (in the following referred to as ligand), the number of free binding sites that are under observation in an experiment is determined predominantly by the surface immobilization procedure (requiring usually only very small amounts of material). Therefore, the sensitivity of the method is limited essentially by the availability of the soluble binding partner (the analyte) in a well-defined state, at concentrations in the order of the inverse affinity constant. This allows studies of interactions with affinities spanning a range of at least 105 to 1010 M−1, and makes this method very attractive, in particular, for high-affinity interactions. Thus, optical biosensing is an excellent complementary tool to other techniques such as analytical ultracentrifugation (Schuck et al., 2015) and isothermal titration microcalorimetry (Brautigam et al., 2016). Second, the separation of the surface-immobilized sites from the mobile binding partners in solution, if combined with an appropriate fluidic handling system, is virtually ideally suited for the real-time observation of the kinetics of the binding processes. Chemical on-rate constants of up to 105/Msec to 106/Msec and off-rate constants of between 10−5/sec and 10−1/sec are generally accessible. Information on the chemical on-rate constants, and on the lifetime of the complexes formed, can be of great value, for example, in the study of interactions involved in cellular signaling processes.
However, these fundamental advantages are gained at the expense of additional experimental difficulties intrinsic to surface binding studies. These include the need for immobilization of one reactant at a relatively high local surface density (and the execution of binding studies under these conditions), the problems of nonspecific surface binding, possible multiple attachments to the surface through multivalent interactions, the problem of mass transport in kinetic experiments, and finally the possibility of surface potentials influencing the thermodynamics of the interaction (Leckband, 1997; Leckband et al., 1995).
Although the different commercial instruments for optical biosensing are based on slightly different physical principles, they all exploit surface-confined electromagnetic fields for the precise and real-time measurement of the refractive index of the medium in the immediate vicinity of the sensor surface (Garland, 1996; Knoll, 1998; Lukosz, 1991). When ligands are immobilized to the sensor surface, reversibly interacting analytes will accumulate at the sensor surface when brought into the solution above. By virtue of the difference of the refractive index increments of proteins and most aqueous buffer solutions, an increase of the total refractive index at the surface will then be reported (Fig. 20.2.1). Removal of the analyte from the solution causes dissociation of the reversibly bound molecules from the surface sites, which is accompanied by a decrease in the refractive index at the sensor surface, generating a decrease in the signal. Since the changes in signal are, to a good approximation, proportional to the changes in the total mass of surface-bound analyte, the steady-state signals can be analyzed in terms of the law of mass action and Langmuir isotherms. The time course of the signal can be interpreted in the context of chemical binding kinetics. This basic principle, and consequently the derived strategies for studying protein-protein interactions, as well as most of the experimental procedures and potential complications, are the same in the different commercial instruments. The purpose of this unit is to provide a brief introduction to these techniques for the quantitative characterization of biomolecular interactions. There is a great variety of instruments available, with different numbers of surfaces, in different configurations. With regard to their performance, one of the most important criteria for quantitative analyses of binding kinetics is the efficiency of the sample delivery flow, besides the sensitivity. A more detailed comparison is outside the scope of the current work. For the purpose of this review we will provide examples from the Biacore instruments (GE Healthcare Bio-Sciences, Pittsburgh, PA), which is the one used in our laboratories. However, this should not be taken as a preference over other instruments by other manufacturers.
Figure 20.2.1.
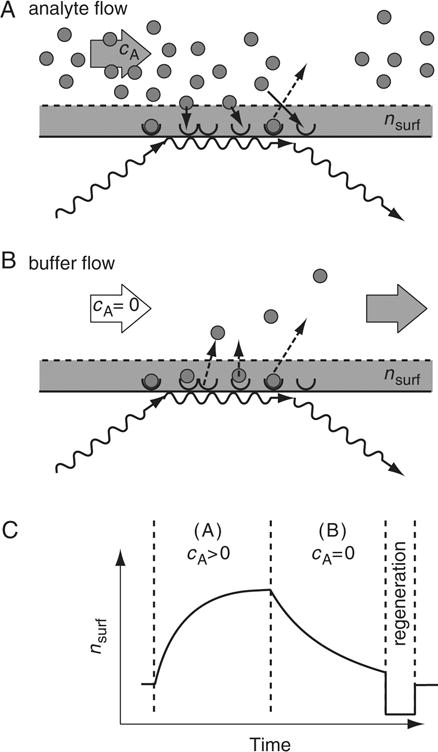
Schematic presentation of a typical optical biosensor experiment. Light is coupled into a structure that allows generation of surface-confined electromagnetic waves (e.g., surface plasmons in a gold film, or modes of a planar waveguide), which are sensitive to the refractive index of the solution in the range of the evanescent field, nsurf. Typical penetration depths of the sensitive volume into the solution are in the order of 100 nm. Ligands are attached to the sensor surface, as indicated by half-circles. (A) When analytes (full circles) are introduced into the solution above the surface, reversible interactions with the ligand lead to association events at a rate governed by koncAcL,free (solid arrows), and dissociation events at a rate ccomplexkoff (dashed arrows). In the association phase, association events outnumber dissociation events until a steady state is reached. (B) When the surface is washed with running buffer in the absence of analyte, only dissociation events take place. (C) Signal obtained from probing the refractive index nsurf during the sequential application of the configurations depicted in A and B, given in arbitrary units. Following the association phase (A) and the dissociation phase (B), usually a regeneration procedure is applied for removing all remaining analyte from the surface before a new experimental cycle takes place.
At the time of the introduction of optical biosensors in biomedical research, these instruments were thought to offer a particularly simple technique for the rapid quantitative measurement of equilibrium binding constants as well as binding kinetics. The reader is cautioned that the apparent simplicity and rapidity of the method is deceptive, and that the ease of using some of the commercial data analysis software packages can be highly misleading. The reliability of many of the initially used approaches in this field could not be verified in subsequent critical assessments of the methods. However, the technique has evolved significantly during the last decades. This is mainly due to the refinement and increasing variety of immobilization strategies, the identification of sources of artifacts, the use of control experiments, and the maturation of the data analysis techniques. Emphasis is given in this unit to introducing the reader to robust approaches that will result in reliable results. Although the technique is frequently presented as being label-free, one of the interacting proteins has to be attached in an active form to the sensor surface. Most frequently, this is accomplished through covalent coupling, which can introduce all the problems well-known in chromophoric labeling and related covalent protein modifications, including artificial reduction or strengthening of binding affinities (Melikishvili et al., 2011; Zhao et al., 2012). For all these reasons, the use of this technique requires careful planning and the execution of a number of different experiments, with time and effort more or less comparable to any of the other techniques available for the study of protein-protein interactions.
Optical biosensors are very versatile for the study of protein interactions. However, as described below (see Strategic Planning), the choice of the experimental strategy is usually dictated by the proteins under investigation. Only general guidelines can be given for this stage of the experiment. Detailed procedures for some of the most commonly employed immobilization procedures are described, followed by an introduction to the different strategies for the binding studies, and a brief description of some of the most commonly encountered problems. Next, the need for control experiments is emphasized, and the execution of a variety of such control experiments is described. Finally, some ideas are given for simple troubleshooting. Obviously, this introductory unit cannot be even remotely complete, or cover many of the more advanced techniques such as assembly of protein complexes (Andersen et al., 1999; Schuster et al., 1993). For many of these, the reader will be referred to the specialized literature cited throughout this unit.
STRATEGIC PLANNING
The first step in planning a biosensor experiment for the measurement of the interaction of two proteins requires the choice of the binding partner to be immobilized and the type of binding experiment that will be employed (steady-state, kinetic, or competition experiment, see Binding Experiments and Data Analysis). This involves the consideration of several factors related to size, purity, and chemical properties of the protein, as well as the stoichiometry of the interaction. In general, this will require the protein samples to be well characterized with respect to these properties.
Size, Concentration, and Volume
Optical biosensors detect changes in the refractive index at the sensor surface due to analyte binding. This signal is superimposed by an offset from the bulk refractive index differences of the buffers used. Because the refractive index increment of most proteins is very similar in units of weight concentration (Zhao et al., 2011), the signal obtained from saturation of a given number of surface sites will increase with increasing molar mass of the soluble protein (or other analyte). In some of the commercial instruments, the binding of an analyte with a molar mass of only 1000 Da or below can be detected without difficulty, given the commonly achievable surface densities of sites. There is virtually no upper limit for the size of the analyte. Size consideration is important before setting up the experiment if the two binding partners to be studied are of significantly different size. The choice of a larger species as the analyte may be preferable because this provides a larger signal. However, the immobilization of a very small peptide is usually difficult to control, and in practice frequently leads to unsuitably high density of surface sites, which can introduce problems of steric hindrance and mass transport limitation (see discussion of Mass Transport Limitation). In the absence of any other considerations, it seems often advantageous to immobilize the larger binding partner, in order to diminish the probability of steric hindrance problems brought about by binding to surface sites in close vicinity. This will also help to minimize the probability of the immobilization affecting the conformation of the binding epitope. On the other hand, peptide ligands often are far more resistant to the denaturing effects of repeated cycles of binding and regeneration, and can be expected to provide a more stable binding surface than most proteins. In some cases, evaluation of the binding of a protein to a set of carefully chosen immobilized peptides can provide detailed information concerning the requirements for peptide binding (Khilko et al., 1995).
If one of the proteins under study is available only in small quantities, it is advantageous to immobilize this species, because during the course of a study usually only a few functionalized surfaces are needed, each requiring usually only a few micrograms of material. The analytes are used in larger amounts; in one complete set of kinetic experiments volumes of the order of 100 μl at concentrations of ten times the KD are typically required. In competition experiments, similar quantities of the immobilized species are additionally required. Depending on the sample delivery system, these quantities may be reduced (Abrantes et al., 2001). The active concentration of the analyte should be well known, because errors in this value will directly translate into proportional errors of both the binding constant KD and the chemical on-rate constant kon, resulting from analysis of the experiment (see Binding Experiments and Data Analysis).
Purity
In principle, the criterion for sufficient purity is the absence of cross-reaction between the two samples, aside from the interaction of the proteins under study—i.e., that no binding occurs between any contaminating species in the ligand sample and in the analyte sample. In practice, this means that at least either one of the samples should be highly purified, while the purity of the other sample can be relatively low. However, very strict requirements have to be met to ensure the absence of contaminating multimeric aggregates of the mobile binding partner (see discussion of Analyte Aggregates, below, and Davis et al., 1998).
Oligomeric Structure, Stoichiometry, and Multivalent Binding
In general, for quantitative analyses of molecular binding parameters it is important to avoid multiple attachment of a single analyte molecule to two or more surface sites. If this occurs, the lifetime of the surface-bound complex is greatly enhanced. This avidity effect depends strongly on the local density of surface sites (Müller et al., 1998), and the binding data obtained under these conditions are governed to a large extent by the specific properties of the functionalized surface, much more than the surface binding properties of the analyte. (It cannot be assumed that the avidity effect of multivalent binding to the sensor surface is similar to possible avidity effects in binding to cell surface receptors.) Therefore, if the proteins under study are subject to multimeric binding, the multivalent species should be chosen for immobilization, if possible. For example, in antibody-antigen interactions, the antibody with multiple epitopes should be immobilized and the antigen should be the mobile analyte (Fig. 20.2.2). For unknown stoichiometries, appropriate control experiments should be performed that can identify the presence of multivalent species. For the same reason, the presence of even very small amounts of reversibly formed oligomers (self-association) or irreversibly formed oligomers can significantly interfere with the analysis of surface binding equilibria or kinetics. Because of the difficulties in detecting relatively weak or rapidly reversible oligomerization, solution techniques like analytical ultracentrifugation can be preferable to chromatographic or electrophoretic techniques. Related, if one of the binding partners is a non-covalent heteromer, this may pose additional difficulties in the immobilization and/or regeneration due to possible dissociation of the complex (see below).
Figure 20.2.2.
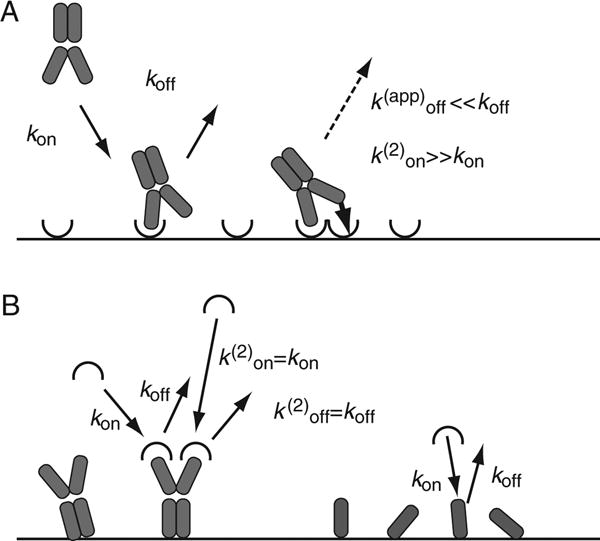
(A) The binding of a bivalent analyte can take place through the interaction with a single ligand molecule (left), or with two ligand molecules (right), depending on the local ligand density. If an unoccupied immobilized ligand molecule is within an accessible distance to an already singly bound analyte molecule, then the on-rate constant of the second interaction is strongly enhanced because of the entropic colocalization constraints. The overall dissociation rate constant of the double attached analyte is substantially reduceed (usually by orders of magnitude), because it requires the virtually simultaneous dissociation of both interactions, which is much more improbable than a single dissociation event. The overall binding kinetics obtained from multivalent analytes is highly complex. (B) If the configuration is reversed, with the bivalent binding partner immobilized to the sensor surface, then both valencies act independently (left), and (in the absence of cooperativity of the sites) lead to binding kinetics that are identical to that of the monovalent interactions (right).
Reactive Properties: Susceptibility to Immobilization, Nonspecific Binding, and Regeneration
The key to successful biosensor experiments is the immobilization of one protein species in an active, and, if possible, uniformly oriented state to the sensor surface. However, in spite of the efforts to optimize surfaces, the immobilization process necessarily involves chemical or physical modification of the macromolecule, which can lead to altered binding properties as well as polydispersity. Unfortunately this is poorly predictable prior to the experimental controls. Even if chemically uniform attachment is achieved, physical factors of heterogeneity arising from the heterogeneous microenvironment of the surface cannot be easily avoided, including local pH, charges, steric constraints, hydration levels, and hydrophobicity. Therefore, ideal chemically uniform attachment may not be essential, as heterogeneity may still be unavoidable and should be accounted for in the data analysis (see below).
The ease of immobilization can be the major consideration for the choice of the immobilized species. Examples are the presence of biotin, histidine, or other tags on the molecule that allow specific capture, or the presence of a single accessible cysteine suitable for employing specific cross-linking chemistry. If a protein is produced by recombinant methods, appropriate tags can frequently be introduced.
Analogously, the protein that exhibits less nonspecific surface binding is the preferable choice for an analyte. Many sensor surfaces are slightly hydrophobic, and it is highly recommended to measure the extent of binding of both proteins to the nonfunctionalized surface at the maximal concentrations to be used in the binding experiments (e.g., at concentrations equal to 10-fold the expected dissociation equilibrium constant, KD). Significant degrees of nonspecific binding can make the analysis of the surface binding kinetics very difficult.
Most analytical strategies require a series of multiple association/dissociation cycles to be executed with the same surface. Therefore, conditions need to be established that allow removal of all surface-bound analyte, without permanently altering the conformation and activity of the immobilized ligand (but tolerating possible destruction of the analyte). Naturally, the choice of the regeneration procedure depends very much on the proteins. Frequently, helpful hints can be obtained from the procedure used to purify the ligand—e.g., conditions employed during ion-exchange or affinity chromatography. Examples of common regeneration procedures include exposure to low-pH glycine or HCl buffer for 1 or 2 min. For some sensitive ligands that interact weakly with their respective analytes, an extended washout with the binding buffer is the gentlest and most reliable regeneration procedure. After selection of a regeneration procedure, control experiments for the integrity of the surface and for the reproducibility of the observed signal should be performed. These should consist of several identical association/dissociation/regeneration cycles. Insufficient regeneration can be identified by residual signal increase after each cycle and/or a negative drift of the baseline. The loss of binding sites through too-harsh regeneration conditions is indicated by a maximal signal during the association phase, which decreases with each cycle. Regeneration is not required for the equilibrium-titration techniques (Schuck et al., 1998; Myszka et al., 1998; Rich et al., 2010), although these are associated with less-well defined experimental conditions.
IMMOBILIZATION PROTOCOLS
The goal of immobilization is the stable coupling of the ligand to the sensor surface in an active form. In addition to the obvious functional test of analyte binding during the course of the interaction study, probing the conformation with monoclonal antibodies against ligand epitopes can be highly useful. If possible, it is desirable to reverse the role of ligand and analyte to rule out artifacts of immobilization on the interaction. It is important to note that the immobilization methods differ in their requirement for the exposure of the ligand to relatively harsh conditions, such as pH values below the pI in the commonly employed amine coupling. A related consideration in the choice of the immobilization strategy is the orientation of the surface-immobilized ligand. Random coupling techniques, such as amine coupling, may create different subpopulations of differently reactive ligand molecules at the surface, while specific orientation techniques (e.g., through specific cysteines or through specifically attached biotin moieties) create more chemically uniform surfaces. An elegant method for allowing uniform surface attachment is the introduction of specific tags (such as cysteine or histidine) into recombinantly produced or synthetic ligands.
Below are basic descriptions of three of the most commonly used immobilization techniques, which can be applied to the most commonly employed carboxymethylated dextran sensor surfaces. In any of these methods it is very important to control the number of surface sites, since several surface-related artifacts are invoked if the surface density of the proteins under study is too high. The density of immobilized protein can be measured as the difference of the signal before and after immobilization, which can be transformed into the maximal analyte binding capacity by multiplication with the molar mass ratio of the analyte and ligand. For kinetic experiments, generally a relatively low density of immobilized protein should be obtained—i.e., a binding capacity of 50- to 200-fold of the instrumental noise. For competition and for certain control experiments (see Competition Analysis), a larger binding capacity can be desirable. In practice, for initial orientation on the behavior of a particular system of interacting proteins, it is best to prepare several different surfaces of different ligand densities and to compare the analysis of each. This will be helpful for diagnosing the regimes where mass transport limitations may be present (see Mass Transport Limitations), or where high surface coverage may lead to steric hindrance of analyte binding to neighboring surface sites (leading to biphasic surface binding kinetics).
Instruments that allow the on-line observation of a reference surface can be optimally utilized if the reference surface is treated as similarly as possible to the functionalized surface. This is important predominantly because of possible nonspecific interactions of the analyte with the sensor surface, and the possible changes in surface properties due to immobilization. For amine coupling, this can include the application of the activation/deactivation cycle to the reference surface, but without cross-linking of any protein, or with cross-linking of a nonfunctional control protein (for example an unrelated antibody of the same isotype). For the same reason, if using biotin-streptavidin coupling, it is advantageous to immobilize streptavidin to both surfaces.
A variety of additional immobilization techniques are available in addition those described below, such as hydrazide coupling (O’Shannessy et al., 1992), Ni2+ chelate coupling (Gershon and Khilko, 1995; O’Shannessy et al., 1995; Sigal et al., 1996), coupling of hydrophobic groups (Stein and Gerisch, 1996), coupling of azide-containing ligands with strain-promoted azide-alkyne cycloaddition (Wammes et al., 2013), the use of self-assembled monolayers of alkanethiolates with different coupling groups such as NTA (Sigal et al., 1996), biotin (Jung et al., 2000), maleimide (Houseman et al., 2003), aldehyde (Hahn et al., 2007), acetylene (Lee et al., 2004), hydroquinone (Yousaf and Mrksich, 1999), or supported lipid or hybrid bilayers (Plant et al., 1995; Ramsden et al., 1996), and immobilization to aminosilane-derivatized surfaces (Edwards et al., 1995; Buckle et al., 1993). For details on chemical modifications of the proteins, see (Hermanson, 2013). Additionally, capturing strategies can be used for reversible attachment of the ligand. More specific information on commercially available sensor surfaces, and step-by-step protocols for the corresponding immobilization techniques, can be found in the commercial instrument handbooks and other literature, such as the Biacore applications handbook and the Handbook of Surface Plasmon Resonance (Schasfoort and Tudos, 2008).
Amine Coupling
Amine coupling is most frequently carried out using a sensor surface that is modified with carboxymethylated dextran. It relies on the electrostatic pre-concentration of the ligand to the sensor surface, and therefore requires that the proteins be positively charged. The coupling buffer should be 1 to 2 pH units below the pI of the protein (which may be determined, e.g., from http://web.expasy.org/protparam/), of low ionic strength (to avoid charge screening), and not contain any primary amines. Effective pre-concentration can be tested before the activation of the surface. It is frequently necessary to test immobilization with several different buffers of slightly different pH; an adjustment by only one half pH unit can be crucial for a successful immobilization.
In a typical protocol, the carboxyl groups of the sensor surface are activated by exposure for 5 to 7 min with 50 mM N-hydroxysuccinimide (NHS) and 200 mM N-ethyl-N′-(dimethylaminopropyl)carbodiimide (EDC). Next, the ligand is injected in 10 mM sodium acetate pH 4.5 buffer. To control the amount of cross-linked ligand, it is usually better to adjust the reaction time as compared to adjustment of the ligand concentration. Repeated injection/wash cycles can be used to differentiate the covalently attached ligand from electrostatically surface-bound ligand. Finally, the surface is deactivated with 1 M ethanolamine∙HCl, pH 8.5, for 7 min. Some manufacturers provide kits and prepared buffers for this procedure. The NHS and EDC should be kept frozen separately, in aliquots, at −20°C until use.
Avidin- or Streptavidin-Biotin Coupling
Covalent immobilization of avidin or streptavidin allows the capture of biotinylated proteins. This method avoids the need to expose the protein to a pH lower than the pI, and therefore can better preserve activity. Procedures for biotinylating the analyte are found in Hermanson (2013). The affinity of biotin-avidin interaction is very high and leads to a very stable surface. It should be noted that streptavidin-coated surfaces tend to be more sticky and lead to an increased level of nonspecific binding of the analyte to the surface. Therefore, good blank control surfaces are important.
The amine coupling protocol described above and a carboxymethylated dextran surface can be used for this procedure. The surface is activated with NHS/EDC (see discussion of Amine Coupling), the streptavidin (~100 μg/ml in buffer of pH 4.5 to 5.0) or avidin (~50 μg/ml in pH 4.5 buffer) is immobilized, and the surface is deactivated with ethanolamine. Note that, if commercially prepared streptavidin surfaces are used, this activation step can be omitted. The biotinylated protein is then injected; usually concentrations of 10 to 100 μg/ml and low flow rates are sufficient for efficient capture. Typical times for exposure of the surface are 10 to 30 min.
Thiol-Disulfide Exchange Coupling
This immobilization technique is frequently used for acidic proteins, for small peptides, and for cases when immobilization in a specific orientation is important. It also serves as a highly efficient coupling procedure that can be used if amine coupling or avidin-biotin coupling is unsuccessful. In this method, the immobilization is accomplished either by the introduction of an active disulfide group onto the sensor surface, which can react with thiols on the protein to be immobilized, or, vice versa, by the modification of the sensor surface with a thiol group, which then can react with active disulfides on the protein. The choice between these alternative procedures is dependent on the protein, i.e., the presence of accessible thiol groups, or the potential for introducing activated disulfide groups. The latter procedure may be accomplished, e.g., using 2-(2-pyridinyldithio)ethaneamine (PDEA) to derivatize carboxyl groups or succinimidyloxycarbonyl-α-methyl-α-(2-pyridyldithio)toluene (SMPT) for derivatizing amino groups. It should be noted that, in general, thiol-disulfide exchange coupling cannot be used for studies in the presence of reducing agents. However, the use of covalent thioester coupling—e.g., with succinimidyl 4-(N-maleimidomethyl) cyclohexane-1-carboxylate (SMCC), sulfo-SMCC, or N-(γ-maleimidobutyryloxy)succinimide ester (GMBS)—produces a surface that is stable against reducing agents, and allows one to specifically chose the site of coupling. In addition, the latter technique provides a small spacer between the protein and the surface, which may allow better accessibility (Khilko et al., 1995).
BINDING EXPERIMENTS AND DATA ANALYSIS
Optical biosensors provide data on the time course of analyte binding, and allow for a number of different experimental and analytical strategies for interaction analysis. Most rely on a repeated cycle of association, dissociation, and surface regeneration (Fig. 20.2.1). Among the most important analysis strategies are (1) the kinetic analysis, which takes advantage of the real-time observation to obtain the kinetic rate constants of the reaction; (2) the steady state analysis for measuring the affinity of the reaction; and (3) the competition analysis for measuring the affinity of the interaction in solution. The choice may be constrained by the affinity and kinetics of the proteins under study. If possible, multiple approaches should be taken and the results should be compared for their consistency. Their optimal application requires approximate knowledge of the order of magnitude of the affinity of the interaction. This may make it necessary to perform these studies in several steps.
Kinetic Analysis
Experimental
The experiment consists of repeated injections of the analyte at different concentrations (Fig. 20.2.3). It should be conducted at relatively low surface density of sites, to avoid kinetic artifacts arising from mass transport limitation. An analyte concentration range as wide as possible should be covered (at least from 1/10 of the KD to 10 times the KD), using two-fold or three-fold dilutions. The time allowed for the surface binding phase (injection time) should be long enough for the observation of significant curvature in the binding progress, since it is only the curvature that contains the information about the reaction rate constants. It is highly desirable that steady-state binding be attained, as indicated by a constant signal, at least for the highest concentrations used. The observation time for the dissociation phase should at least be similar to the injection time.
Figure 20.2.3.
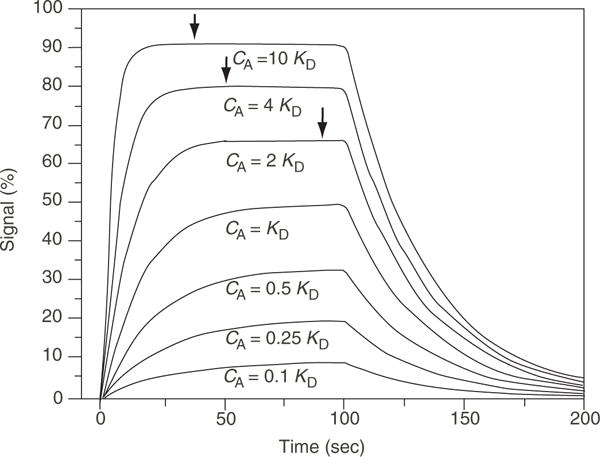
Schematic presentation of an ideal 1:1 pseudo first-order reaction. Shown is a superposition of the binding progress curves that should be obtained in a series of experiments at different analyte concentrations. The data are given in percent of the signal at maximal binding, but the units of the signal do not affect the results of the data analysis. The arrows on the curves at the higher concentrations indicate that steady-state binding is attained, whereas, for the lower curves, longer association times would be required as part of a steady-state analysis.
Data Analysis with a Single Class of Sites Model
As the simplest scheme, if the analyte-ligand interaction follows a pseudo first-order reaction, L + A ⇔ LA then the measured binding progress (proportional to [LA]) is described by:
| Equation 20.2.1 |
where c denotes the analyte concentration, s denotes the signal (in arbitrary units), and smax denotes the signal at maximum saturation of the surface sites. The goal is the calculation of the chemical on-rate and off-rate constants, kon and koff, which relate to the equilibrium constant as:
| Equation 20.2.2 |
When binding reaches equilibrium, the binding signal at equilibrium (seq) at certain concentration (c) can be described with a Langmuir isotherm, where KA is equal to 1/KD.
| Equation 20.2.3 |
For association, we can directly fit the data with a single exponential approach of steady-state derived from the integration of Equation 20.2.1,
| Equation 20.2.4 |
where sa is the predicted signal as a function of time and t0 is the starting point of association.
For dissociation starting after an association with a contact time tc, the observed signal can be described as the single exponential decay below.
| Equation 20.2.5 |
Fitting should be done without truncation of the data beyond possible regions of artifacts from buffer changes or injections. Global analysis should be employed, which allows one to analyze all experimentally observed curves at all analyte concentrations simultaneously. This results in unambiguous best-parameter estimates for the binding constants, and provides residuals that should be inspected for comparison of the model and the data. Software needed for global analysis can be obtained from the manufacturer or as shareware. It should be noted that exclusion of specific data regions that may be poorly described by the model will introduce a bias into the analysis (Schuck et al., 1998).
Data Analysis with Surface Site Distribution Model
In the vast majority of cases the single class of sites model will not describe the data adequately. Heterogeneity in surface sites is one of the major causes of the deviation. In order to account for this, we can extend the simple 1-site model to that of an entire distribution of binding sites (Svitel et al., 2003). It is a two-dimensional distribution, in one dimension describing different affinity of complexes, and a second dimension describing different lifetimes. It is expressed as a differential distribution P(KD, koff), such that the integral P(KD, koff)dKDdkoff represents the population of the classes of binding sites on the surface with an equilibrium dissociation constant between KD* and KD*+dKD, and a dissociation rate constant between koff* and koff*+dkoff. The distribution corresponds to a model of binding traces
| Equation 20.2.6 |
that is simultaneously fit to all experimental sensorgrams at different analyte concentrations. It is a combination of 1-site signals s(c,t,koff,KD) each composed of association and dissociation traces as described in Equation 20.2.4 and 20.2.5, respectively. For computation, the distribution of sites P(koff, KD) is discretized across a preset range of KD-values and koff-values with assigned grid points. The global fit is carried out with Tikhonov regularization (usually at a confidence level of P = 0.95) to determine the most parsimonious distribution that can describe the data well. After an initial analysis, the ranges of koff and KD values may need to be readjusted to be adequate for the given data. The average koff and KD of the peaks in the distribution map can be calculated by integration. This model has been implemented in a public domain program, EVILFIT, which can be downloaded from https://sedfitsedphat.nibib.nih.gov/software/default.aspx with instructions at https://sedfitsedphat.nibib.nih.gov/tools/EVILFIT%20demo/Forms/AllItems.aspx, and a demo video at http://youtu.be/QXkXTN0gwck.
Shown in Fig. 20.2.4 is an example of SPR binding data and analysis with the surface site distribution model in EVILFIT, which is the data set demonstrated in the video tutorial on youtube. It is very important to critically inspect the quality of fit for all concentrations, both in the overlay of the raw data and fit, as well as the display of the residuals, which should be random. In the example in Fig. 20.2.4, the distribution in the bottom panel clearly resolves multiple groups of sites with different binding affinity and kinetics. The signal contribution of each peak can be determined by integration, along with the corresponding binding parameters.
Figure 20.2.4.
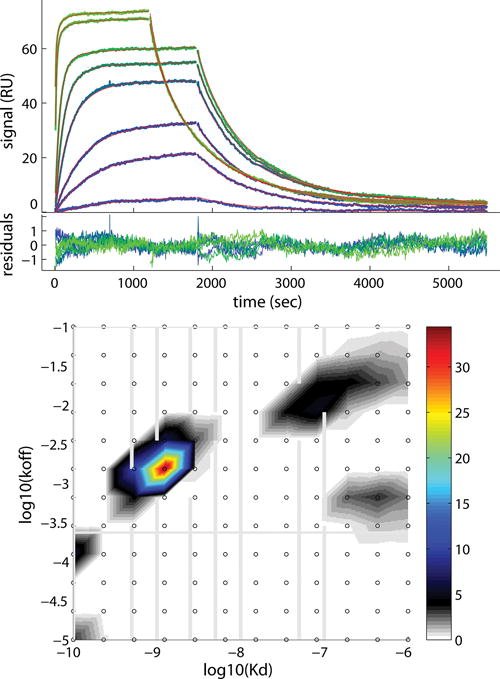
The experimental data and fits for binding of soluble β2-Microglobulin (B2MG) to a monoclonal IgG antibody directly immobilized (3200 RU) on a CM3 sensor surface. (top panel) Binding traces (blue to green lines) and best-fit (red lines, superimposed by the blue/green lines) from surface site distribution model. (bottom panel) The distributions are presented as a contour plot with the color temperature interpolated from the population at the (KD,koff) grid points (shown as small black circles). The density of the distribution values can be read from the color bar on the right of the panel. The grid spacing is chosen logarithmically in both KD and koff directions, such that lines of constant kon are diagonal. The experimental analyte concentrations are plotted as vertical gray lines in the contour plot. The horizontal gray line represents the inverse of the longest time constant for which the experimental data would permit observing a (1/e)-fold decay. Excellent fit is achieved with an rmsd of 0.36 RU. The binding traces and bestfits is shown on the top panel, and the distribution of the fit is shown on the bottom. The concentrations of B2MG of all the traces are between 0.1 and 100 nM. Detailed information on the experimental conditions and analysis is described in (Zhao et al., 2013).
A closer inspection of the data and fit in Fig. 20.2.4 offers an opportunity to discuss in more detail several points regarding the data acquisition and analysis. First, the level of details in the distribution is highly dependent on the information content of the raw data, which is mainly defined by signal/noise, curvature, and concentration range of the signal traces. For the data with sufficiently high information content, it is even possible to resolve microheterogeneity within a broad peak in the distribution analysis (Gorshkova et al., 2008). As described in Strategic Planning, a sufficiently long association and dissociation is necessary to ensure good information content of data. In Fig. 20.2.4, we can discern full saturation is reached for higher concentrations and dissociation is nearly complete for all concentrations. Second, an important consideration is the appropriate range of koff and KD considered in the distribution. Generally, half peaks at the extreme values of the grid should be avoided, and the grid suitably expanded. However, the range should not exceed limits of experimentally observable values. For example, we limit the exploration of koff to ≥ 10−5 sec−1 because this dynamic range is comparable to the time-dependence of baseline drift for the instrument. With regard to the higher end of the KD range, the location of the peaks relative to the experimental concentrations needs to be considered. Idealy all sites should be probed by concentrations within the range of 0.1KD – 10KD. However, this might not be practical sometimes if a significant fraction of the binding sites are very weak. High concentrations needed to saturate those sites may cause aggregation of the analyte. On the other hand, peaks far above the highest experimental concentration suggests sites that are virtually unpopulated, and therefore cannot be reliably characterized. As a consequence, the upper limit of the KD range should not exceed 10fold of the highest experimental concentration. Adjustements in the distribution range that cause significant increase of the rmsd of the fit should be avoided.
The distinguishing power of the surface site distribution model allows us to obtain detailed thermodynamic and kinetic information of the heterogeneous sites, which can be exploited for comparing the performance of different sensor surfaces (Zhao et al., 2013). For example, a variable degree of heterogeneity dependent on the immobilization chemistry and using different sensor surfaces is demonstrated for a model system in Fig. 20.2.5. Additionally, the application of the distribution analsyis may reveal for some interacting systems that the distribution of the surface sites is dependent on immobilization density (Gorshkova et al., 2008). For this reason, sensorgrams from surfaces with different immobilization density should not be used in global analysis, since the ensemble of surface sites may not be the same.
Figure 20.2.5.
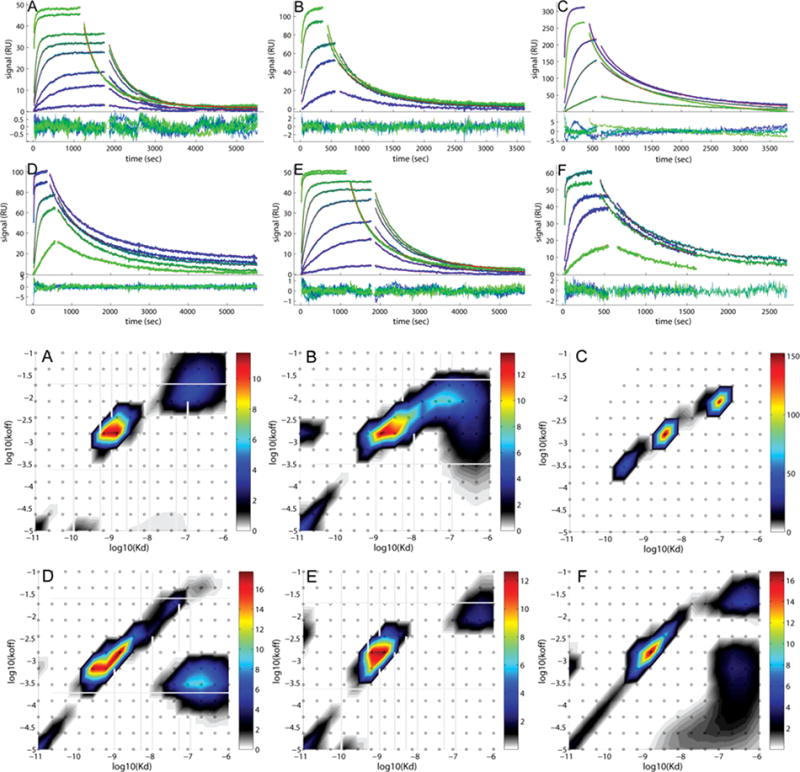
Comparison of the experimental data and fits for binding of soluble B2MG to a monoclonal IgG antibody immobilized on different sensor surfaces. Binding data (blue to green) and best-fit (red lines, virtually superimposed by the blue/green lines) from the affinity and kinetic rate constant distribution model without (A, B, D, E, F) and with two-compartment transport approximation (C). Excellent fits are achieved for all the data sets. For each panel, the binding traces and best-fits are shown on the top, and the residuals of the fit are shown on the bottom. (A) B2MG binding to a CM3 sensor chip with 1350 RU of anti-B2MG-biotin immobilized. (B) B2MG binding to a CM5 sensor chip with 3000 RU of anti-B2MG-biotin immobilized. (C) B2MG binding to a CM5 sensor chip with 6000 RU of anti-B2MG-biotin immobilized. (D) B2MG binding to a C1 sensor chip with 1500 RU of anti-B2MG-biotin captured on the surface with 1500 RU of SA immobilized. (E) B2MG binding to a CM3 sensor chip with 800 RU of anti-B2MG-biotin captured on the surface with 880 RU of SA immobilized. (F) B2MG binding to a CM5 sensor chip with 1000 RU of anti-B2MG-biotin captured on the surface with 1000 RU of SA immobilized. In our study, by using this model system, we have investigated the surface heterogeneity by exploiting a few of the most commonly used immobilization strategies (direct amine-coupling and straptavidin-biotin coupling), types of sensor chips with different dextran matrix (C1, CM3 and CM5), as well as by varying the immobilization density. As shown in this figure, for all the surfaces under study, heterogeneity of the surface sites is obvious. In general, a major peak with dominant signal along with a few small peaks is observed in the distribution map. On average, consensus in the average koff (~1.5 – 2.0 E-3 sec−1) and KD (~1 nM) is achieved for the major peak, indicating consistency in the energetics of the major binding event independent of the immobilization conditions and sensor chips. However, the minor peaks show significant variation in their position and density for different surfaces. From the comparison of the distributions, surfaces on CM3 sensor chip seem more uniform than those on CM5 and C1 chips, and binding is less transport limited even at comparatively higher immobilization level. Although SA capture has been hypothesized to generate more homogeneous surface sites, the distribution plots resulted from this study did not show superiority of this immobilization strategy. Experiment and analysis details can be found in (Zhao et al., 2013).
Additional modeling approaches for the surface site distribution analysis have been developed for resolving finer structure of the binding sites, accounting for limited mass transport (MTL) and multivalent binding. As described above, Tikhonov regularization is used in the simplest distribution model, which ensures the most parsimonious distribution. Alternatively, we can use a Bayesian approach to probe for the possibility of alternative fits of the same quality, in particular those that are more conform to certain expected features (Gorshkova et al., 2008). However, data with a sufficient high signal-to-noise ratio, data acquisition times, and appropriate concentration ranges, will discriminate very well and only allow a narrow range of possible distributions to fit the data adequately.
As mentioned in the earlier, effective delivery of the analyte molecule to the binding sites is crucial for quantitative data interpretation in SPR biosensing. For moderately limited mass transport (MTL), it is possible to computationally model the transport as different steps and account for this effect with a transport rate constant, ktr. For example, this can be embedded into the surface site distribution model (Svitel et al., 2007). Although this is feasible, it is still the best practice to identify and minimize MTL experimentally (see Common Experimental Obstacles).
As emphasized in Strategic Planning, in most of the cases it is critical to avoid multivalent binding by ensuring to use molecules with a single binding site as analyte. Otherwise the signal and kinetics will be significantly impacted by the avidity effect. However, in some cases qualitative and semi-quantitative data interpretations using the distribution model are possible to characterize the binding properties of multi-valent interactions (Zhang et al., 2016), if the structure of the surface sites can be well controlled. Additional extensions of the distribution model to account for step-wise addition of analyte have been described (Kapinos et al., 2014)
Possible Problems
Many data sets are poorly described by the single-site models Equation 20.2.4 and Equation 20.2.5 and instead show multiphasic behavior. Frequently, the deviations of the data from the single exponential binding progress predicted in Equation 20.2.4 and Equation 20.2.5 are signatures of experimental artifacts, such as heterogeneity of the ligand (subpopulations of ligand with different binding properties through nonspecific immobilization), steric hindrance of binding to neighboring sites, or the presence of mass transport limitations or multivalent aggregates of the analyte (see discussion of Common Experimental Obstacles). The surface site distribution model can account for the surface heterogeneity in most cases since it is a multi-site model with information content control. For SPR binding data which can not be well described by the surface site distribution model, it is not recommended to invoke complex reaction schemes without physical basis or supporting information from other techniques. This is because modeling with multiple-site binding scheme is usually not very robust, and many different models may fit the same data equally well (Glaser and Hausdorf, 1996). Otherwise, data modeling with large number of parameters can lead to meaninless results, in spite of a better fit quality. As mentioned above, one should always be cautious about global modeling of different surfaces such as those with different surface densities or immobilization chemistry, because the heterogeneous nature of the surfaces can vary significantly. The reader is also advised to critically question some of the more complex models implemented in commercial or shared software with regard to their physical plausibility.
Steady-State Experiments and Binding Isotherm Analysis
This approach can yield both equilibrium constants and, if appended by a dissociation analysis, kinetic constants. Its main advantage with respect to the previously described technique (see discussion of Kinetic Analysis) is that it is much more robust and reliable because it is not affected by some kinetic artifacts.
Experimental
If in the course of the association experiments a steady-state signal is observed, which is generally possible for interactions with relatively high koff, then a binding isotherm can be constructed (Figs. 20.2.3 and 20.2.6). In an experimental procedure similar to the kinetic analysis, a concentration range as wide as possible should be covered, with two-fold concentration steps starting from both far below (≤1/10) KD up to almost complete saturation of the surface sites, far above the KD (≥ 10 times the KD). The injection times required to attain steady state at the lower concentrations are longer (see Equation 20.2.4 and Equation 20.2.5), and exponential extrapolation may be used provided sufficient curvature has developed. Exponential extrapolation is not advised, however, for concentrations above KD.
Figure 20.2.6.
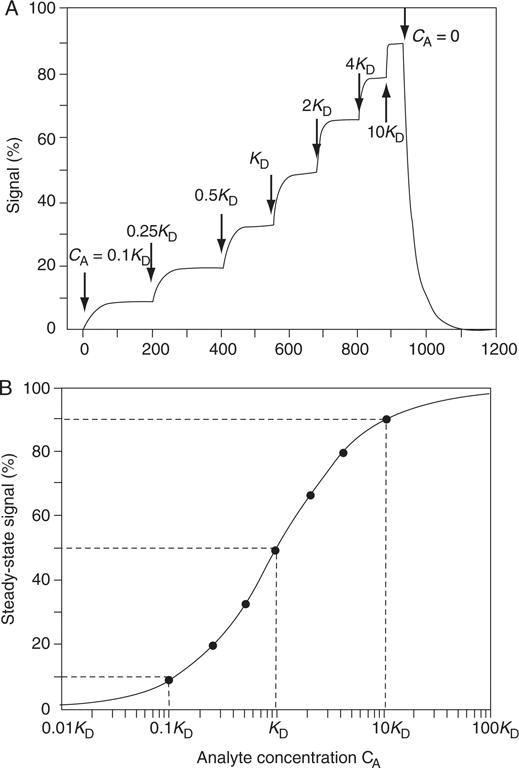
(A) Time course of an equilibrium titration experiment. Arrows indicate the time-points of the step-wise increase in the analyte concentration. (B) Steady-state binding analysis according to Equation 20.2.5. In a plot of the steady-state signal versus the base-10 logarithm of the analyte concentration, the binding isotherm exhibits a typical sigmoid shape. The inflection point at 50% saturation determines KD, and the width of the curve is characterized by ~10% saturation at 1/10 KD and ~90% saturation at 10 KD (dotted lines). Visible inspection of the data in this representation already allows a robust parameter estimation.
For interactions that do not yield steady-state binding within a tolerable time interval for the association phase, or where the ligand does not withstand a regeneration procedure, equilibrium titration represents an experimental variant (Fig. 20.2.6). In this approach, the analyte concentration is increased in two-fold steps, allowing for attainment of steady state in each step, avoiding regeneration between the steps. This can be achieved by addition of a small aliquot of the analyte into the running buffer reservoir of a standard Biacore (Myszka et al., 1998).
After the highest analyte concentration has been applied, the dissociation phase can be observed and analyzed in terms of Equation 20.2.5. This can give an estimate of koff, which can be used in conjunction with Equation 20.2.2 to calculate kon as koff/KD.
Data Analysis
The steady-state signal asymptotically approached in each binding trace can be used to construct to a binding isotherm and modeled according to Equation 20.2.3. Many software packages are available for this fit, including those from instrument manufacturers. Further, such isotherms can be combined with thermodynamic data acquired from different biophysical methods for global analysis (GMMA) (Zhao and Schuck, 2012). This can be accomplished with the software SEDPHAT, which was designed to facilitate the analysis of multi-component protein interactions. It is worth noting that the surface heterogeneity in the SPR biosensing experiment can contribute to the inconsistency of the binding properties determined from SPR isotherm and those from other solution methods. Therefore, it is indeed better to exploit a competition assay (described below) for generating an isotherm which is comparable to those obtained in free solution studies. Details of isotherm analysis in SEDPHAT are available at http://analyticalultracentrifugation.com/sedphat/sedphathelp.htm.
Competition Analysis
Competition experiments can be performed in different variations, but conceptually all use a calibration of the sensor signal as a function of free analyte concentration, followed by experiments with mixtures of analyte and soluble ligand in different molar ratios. The basic presumption is that the soluble ligand competes with the immobilized ligand for the free analyte, which leads to a reduction of the surface binding. This gives information on the solution affinity of ligand and analyte, while the freedom from the need to explicitly model the surface binding drastically diminishes the influence of potential surface artifacts on the results (Nieba et al., 1996; Schuck et al., 1998). This analysis can be extended to any other competitor that completely inhibits ligand binding of the analyte when bound to the analyte.
Experimental
For low-affinity systems with high chemical off-rate constants, in general, steady-state conditions can be achieved. Accordingly, the binding isotherm can be taken as a “calibration” of the sensor signal as a function of the free analyte concentration. Experiments to derive the surface binding constant can be conducted as described above (see Steady-State Experiments and Binding Isotherm Analysis). In a second variation, for high-affinity systems, mass-transport limited conditions are established by using a large immobilization density. Under these conditions, the initial binding rate constant will be directly proportional to the free analyte concentration (ds/dt = ktcA). The initial binding rate constant should be measured in equidistant concentration intervals for analyte concentrations up to a few times (two-fold) the KD. After either one of these sets of calibration experiments, a set of experiments is performed using a constant concentration of analyte, cA,tot (which should be taken in the range of KD), premixed and equilibrated with different concentrations of the soluble form of the ligand. The ligand concentrations, cL, should be taken in two-fold steps, spanning the range from far below to far above the KD. Choice of the fixed analyte concentration is important, since too high a value for cA,tot would show competition only in the range of stoichiometric binding. For systems that do not withstand regeneration, a recycling competitive titration procedure has been developed (Schuck et al., 1998).
Data Analysis
For the high-affinity variant of the experiment with a linear initial rate of binding, ds/dt = ktcA, a plot of ds/dt versus cA can be used to graphically calculate the amount of free analyte, cA,free, during the competition experiment, or, cA,free is calculated according to the analytical inversion cA,free (cL) = ds/dt(cL)/kt. Similarly, in place of the linear function, an empirical calibration function for ds/dt(cA) could be used. The obtained concentration of free analyte cA,free in experiments at different soluble ligand concentrations cL can be plotted as cA,free versus log(cL), which gives a competition isotherm with the characteristic sigmoid shape. It can be fitted with Equation 20.2.7, the solution of the quadratic equation of the mass action law combined with mass balance:
| Equation 20.2.7 |
which gives the solution binding constant of analyte and ligand, KDsol. If the low-affinity variant of the experiment was used, the steady-state analysis of the sensor response in the absence of soluble ligand can be performed according to Equation 20.2.8, giving smax and KDsurf. This can be used in a direct analysis of the competition steady-state response using:
| Equation 20.2.8 |
Alternatively, both titrations can be analyzed simultaneously in a global fit to both isotherms, assuming the binding constants to the surface sites and in solution to be identical.
COMMON EXPERIMENTAL OBSTACLES
Two of the most important experimental problems are mass transport limitations and the effect of aggregates on the binding kinetics. The first difficulty is found most frequently (but not exclusively) in systems of medium to high affinity with high kon, whereas the second is observed predominantly in systems with lower affinity, where higher analyte concentrations are required. Other obstacles can be steric hindrance effects of binding to adjacent surface sites (O’Shannessy and Winzor, 1996), or the contribution of second-order kinetics to the binding process in fixed-volume systems (Edwards et al., 1998). Most of these processes scale with the immobilization level of the ligand. For this reason, a low ligand density is generally advantageous in minimizing potential problems. Special considerations for working at very low ligand densities are described in (Ober and Ward, 1999b, 1999a). The use of control experiments (e.g., comparison of the KD from solution competition experiments with the KD obtained from surface binding kinetic measurements) is very useful in verifying the absence of artifacts. The role of mass transport and analyte aggregates will be explained in detail below.
Mass Transport Limitation
If the supply of analyte to the sensor surface is the limiting factor in the surface binding rate, the observed binding kinetics is said to be mass transport limited. This will depend directly on both the density of the immobilized sites, on the chemical on-rate constant of the interaction, and on the rate of replenishing analyte in the vicinity of the surface sites. In the association phase, mass transport limitation will produce a zone of depleted analyte concentration in the vicinity of the surface, while in the dissociation phase, this will lead to a zone of nonvanishing free analyte concentration, which is subject to rebinding-retention effect (Silhavy et al., 1975) (Fig. 20.2.7). The quantitative influence of these on the observed surface binding kinetics is governed by a highly complex reaction/diffusion/convection process (Yarmush et al., 1996; Schuck, 1996). Although the impact on the kinetics in the association and dissociation phase is conceptually closely related, it cannot be assumed that the ratio of the “apparent” binding and dissociation rate constants still reflects a good estimate of the equilibrium constant. A simplified approximate description for binding in the kinetic regime in the onset of transport limitation is possible in a two-compartment model, which was combined with the surface site distribution model (Svitel et al., 2007). The quantitative interpretation of the value of the transport rate constant is non-trivial, since mass transport steps arise in the flow and within in the sensor matrix (Schuck, 1996), and due to the hydrodynamic shape dependence of analyte diffusion coefficients.
Figure 20.2.7.
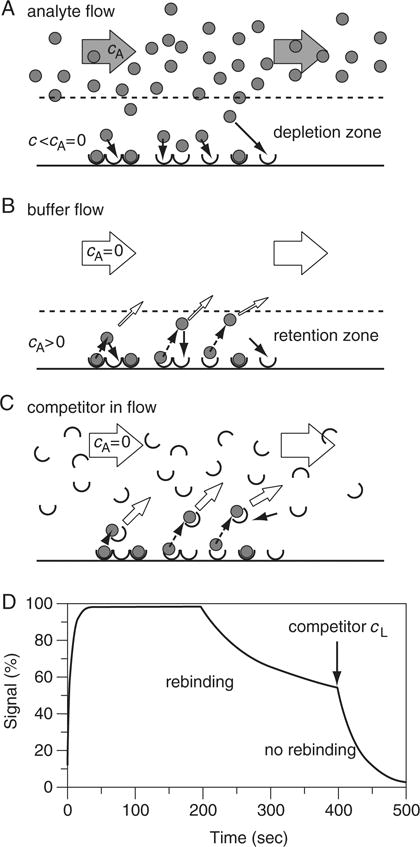
Mass transport effects on the surface binding process. (A) In the association phase, insufficient transport does not fully replenish the free analyte in a zone near the sensor surface (depletion zone). The inability to maintain the concentration cA in the depletion zone leads to a limited surface binding rate. (B) The corresponding effect of mass transport limitation in the dissociation phase is that the surface is insufficiently washed and dissociated analyte is insufficiently removed. This generates a zone near the surface in which free analyte (after dissociation from the ligand) can rebind to empty ligand sites before diffusing into the bulk flow. This zone is indicated as retention zone. (C) Introduction of an excess of the soluble form of the ligand as a competitor into the buffer of the dissociation phase helps prevent rebinding to the surface. Soluble ligand can bind to dissociated analyte before rebinding takes place, and the soluble complex can diffuse into the buffer flow. This can allow the measurement of koff free of mass transport effects. (D) Time course of dissociation during a mass transport induced rebinding situation (as depicted in panel B), and after introduction of a soluble competitor into the washing buffer (arrow). In the presence of the competitor, the signal reflects the chemical off-rate constant koff, while in the rebinding situation, the apparent rate governing the signal is reduced.
Therefore, the primary goal is to identify mass transport limitations, and to establish experimental conditions avoiding transport effects. The following is a list of diagnostic indicators, in the order of reliability, for mass transport limited binding.
Increased dissociation rate when a soluble form of the ligand is injected (Fig. 20.2.7D). This always strongly indicates rebinding (mass transport limitation) if detected. Since the ligand by itself should not interact with the surface, its effect is the binding to analyte near the sensor surface, preventing it from rebinding and allowing diffusion and washout from the surface (Fig. 20.2.7C). Unfortunately, this effect may not be present for large ligands or ligands/analytes with high nonspecific binding if they exhibit limited diffusivity.
Dependence on surface capacity. This is a very good indicator of mass transport limitation, since the transport limit always directly scales with the density of active surface sites. For this reason, variations of the immobilization density of the ligand are recommended as routine tests demonstrating the absence of transport limitation and other surface-related artifacts. This test can fail in the presence of significant non-specific analyte binding to the surface. Also, this test can fail if surface sites exhibit different affinities at the different surface densities (i.e., additional sites at higher density surface are not identical to those immobilized earlier)(Gorshkova et al., 2008).
Double exponential dissociation phase. This will be seen only after dissociation from more than 50% occupation of all available surface sites. An alternative cause of double exponential dissociation can be surface site heterogeneity.
Transitent signal increase during the dissociation phase if dissociation is started from an association phase truncated approximately at the point of half saturation. This can arise from certain constellations of saturation gradients and detector sensitivity gradients under mass transport limited conditions (Svitel et al., 2007; Schuck, 1996). It is often accompanied by the observation of concave association phases at high analyte concentrations. This effect can only be explained by mass transport limitation, but requires very high on-rate constants and low transport rate constants.
Weak dependence on the flow rate. Since the transport parameters only change with the cube root of the flow rate, i.e., generating only a factor of 2 when changing the flow rate by a factor of 8, this flow rate dependency can be difficult to detect. This is particularly true if the flow rate is only varied by a factor of 2, and the reaction is only partially transport influenced. Then, only a ~10% change in the apparent koff would be expected in cases where the true koff is 100% larger than the apparent koff.
Linear or concave association phase. This effect may not always be present, in particular at substantial transport limitation, or for heterogeneous surfaces (Schuck, 1996, 1997a; Schuck and Minton, 1996).
Generally, tests 1 and 2 are the most reliable. They also lead to experimental techniques that can be utilized to reduce or eliminate mass transport artifacts. The most effective way for reducing mass transport influence is lowering the surface density of the immobilized ligand. Higher flow rates give only comparatively very small improvements, but are connected with strongly increased sample volume requirements. If the surface density of the ligand cannot be reduced further without leading to an insufficient signal-to-noise ratio, then switching from kinetic experiments to steady-state or competition steady-state experiments is the best solution. This will give information on the equilibrium constant. The kinetic rate constants can then be estimated best from a saturation experiment (approaching complete saturation of all surface sites), followed by a dissociation phase during which soluble ligand is coinjected. The soluble ligand will minimize rebinding and allow the estimation of the chemical off-rate constant, from which the chemical on-rate constant can be determined via Equation 20.2.2.
Analyte Aggregates
Oligomeric aggregates of analyte can be troublesome in biosensor experiments in two different ways. First, if trace amounts of higher oligomers are present in the analyte sample, this will lead, in the association phase, to a slow accumulation at the sensor surface, which can be visible as a slower second phase of binding. As depicted in Figure 20.2.2, these multimeric analyte aggregates can have multiple interactions with immobilized ligand molecules, and therefore they will dissociate much more slowly than the monomeric analyte. Consequently, they will appear in the dissociation phase as a submoiety with a very low off-rate constant (Davis et al., 1998). The troublesome trace amounts of oligomers can be eliminated by careful chromatographic purification, or their influence can be minimized by exchanging the role of analyte and ligand (Davis et al., 1998; Andersen et al., 1999). Related, it is prudent to ensure the absence of reversible oligomerization of the analyte, which may be flagged by concentration-dependence of the elution time on size exclusion chromatography, or by analytical ultracentrifugation (Schuck, 2003). Reversibly formed oligomers, such as dimers, may impact the surface binding kinetics in similar ways as irreversible aggregates.
The second potentially problematic form of aggregation is a surface-induced multimerization of the analyte. Because the local macromolecular concentrations at the sensor surface are very high (e.g., in the order of 10mg/ml at a signal of 1000 RU in Biacore instruments), local crowding effects combined with non-specific interactions of the analyte can promote oligomer formation at the sensor surface (Fig. 20.2.7A) (Minton, 1995, 1998). As with the influence of preformed aggregates, this process will lead to biphasic association and dissociation profiles, with the slower phase resulting from oligomer accumulation and dissociation, respectively. This process will be favored by higher surface concentrations—i.e., higher density of immobilized ligand, and by higher ligand affinity. As with mass transport limitations, they can be detected by variation of the surface density of the ligand. They also can be reduced by lowering the surface density of the immobilized ligand, by size-exclusion chromatography immediately prior to the experiment, or by exchanging the role of ligand and analyte.
Troubleshooting
As with other complex biophysical techniques and all investigations involving biological samples, it is impossible to give guidelines which are even nearly complete or generally helpful for troubleshooting. Nevertheless, Table 20.2.1 presents a small list of possible solutions to potential problems, given in the hope that some readers may find them helpful.
Table 20.2.1.
Troubleshooting Guide for Measuring Protein Interactions by Optical Biosensors
| Problem | Solution |
|---|---|
| No electrostatic preconcentration achieved; poor immobilization | Desalt protein (e.g., using spin column or microdialysis); decrease pH of buffer used for immobilization (should be below pI of protein) |
| Nonspecific binding is high | Analyte may be too hydrophobic, or there may be electrostatic interaction with surface. Increase salt or detergent concentration in running buffer.a |
| High signal from buffer; refractive index changes | If this does not result from high analyte concentrations, dialyze the analyte against running buffer, or use a spin column for buffer exchange |
| Analyte does not come off after regeneration | Use increasingly harsher conditions for regeneration; test procedures used in affinity chromatography; check for strong nonspecific binding of the analyte; check for possible incomplete blocking of activated surface sites after immobilization |
| No binding of biotinylated sample to streptavidin surface | Check for presence of free biotin in sample. Biotin on the analyte may not be accessible by surface-immobilized streptavidin; in this case try biotinylated linker |
| Kinetics does not follow 1:1 binding | Check for mass-transport artifacts; check for possible traces of aggregates and for formation of aggregates at the surface; change immobilization method (avoid random coupling, avoid large surface densities). If this is not successful, go to steady-state analysis methods. |
| No steady-state binding is reached in a flow system | Use longer injections by increasing injection volume and/or decreasing flow rate. If sample volume is limiting, try an equilibrium titration |
| Mass transport limitation | Decrease immobilization density.b If immobilization density cannot be lowered further, go to steady-state analysis, combined with establishment of lower limit of kdis from dissociation after saturation. |
| Increasing slope in the association phase | Potential signature of mass transport; lower the immobilization density |
| Increasing signal in the dissociation phase | Signature of mass transport limitation; lower the immobilization density |
Be aware of effects of nonspecific binding on the binding kinetics, which substantially decreases the diffusivity of the analyte across the sensor surface, potentially leading to mass transport artifacts that cannot be detected through change of the ligand density.,
Increasing the flow rate affects transport much less, but consumes much more sample.
SUMMARY
Binding studies with optical biosensors can be very powerful and versatile. Among the most important virtues are their high sensitivity and utility for a broad range of affinities, real-time detection allowing studies of binding kinetics, and relatively low requirements of sample volume. We have outlined some general strategies and described some of the most commonly used techniques. The work with protein interactions at a surface can introduce additional experimental difficulties as compared to solution methods. As a general rule in experiments with optical biosensors, it is highly recommended that analyses be performed in different ways so that the consistency of the results can be tested. Biosensors can be an excellent tool in the study of protein interactions, and become particularly powerful if combined with other methods.
Acknowledgments
This work was supported by the Intramural Research Programs of the National Institute of Biomedical Imaging and Bioengineering, and the National Institute of Allergy and Infectious Diseases, at the National Institutes of Health, United States.
Literature Cited
- Abrantes M, Magone MT, Boyd LF, Schuck P. Adaptation of a surface plasmon resonance biosensor with microfluidics for use with small sample volumes and long contact times. Anal Chem. 2001;73:1606–1619. doi: 10.1021/ac0100042. [DOI] [PubMed] [Google Scholar]
- Andersen PS, Lavoie PM, Sékaly RP, Churchill H, Kranz DM, Schlievert PM, Karjalainen K, Mariuzza Ra. Role of the T Cell Receptor α Chain in Stabilizing TCR-Superantigen-MHC Class II Complexes. Immunity. 1999;10:473–483. doi: 10.1016/s1074-7613(00)80047-3. [DOI] [PubMed] [Google Scholar]
- Brautigam CA, Zhao H, Vargas C, Keller S, Schuck P. Integration and global analysis of isothermal titration calorimetry data for studying macromolecular interactions. Nature Protocols. 2016;11:882–894. doi: 10.1038/nprot.2016.044. [DOI] [PMC free article] [PubMed] [Google Scholar]
- Buckle PE, Davies RJ, Kinning T, Yeung D, Edwards PR, Pollard-Knight D, Lowe CR. The resonant mirror: a novel optical sensor for direct sensing of biomolecular interactions part II: applications. Biosensors and Bioelectronics. 1993;8:355–363. [Google Scholar]
- Chavanieu A, Pugnière M. Developments in SPR Fragment Screening. Expert Opinion on Drug Discovery. 2016;11:489–499. doi: 10.1517/17460441.2016.1160888. [DOI] [PubMed] [Google Scholar]
- Davis SJ, Ikemizu S, Wild MK, van der Merwe PA. CD2 and the nature of protein interactions mediating cell-cell recognition. Immunol Rev. 1998;163:217–236. doi: 10.1111/j.1600-065x.1998.tb01199.x. Contains a detailed description of analyte aggregation effects on the measured surface binding. [DOI] [PubMed] [Google Scholar]
- Edwards PR, Gill A, Pollard-Knight DV, Hoare M, Buckle PE, Lowe PA, Leatherbarrow RJ. Kinetics of protein-protein interactions at the surface of an optical biosensor. Analytical biochemistry. 1995;231:210–7. doi: 10.1006/abio.1995.1522. [DOI] [PubMed] [Google Scholar]
- Edwards PR, Maule CH, Leatherbarrow RJ, Winzor DJ. Second-order kinetic analysis of IAsys biosensor data: its use and applicability. Analytical Biochemistry. 1998;263:1–12. doi: 10.1006/abio.1998.2814. [DOI] [PubMed] [Google Scholar]
- Garland PB. Optical evanescent wave methods for the study of biomolecular interactions. Quarterly Reviews of Biophysics. 1996;29:91–117. doi: 10.1017/s0033583500005758. [DOI] [PubMed] [Google Scholar]
- Gershon PD, Khilko S. Stable Chelating Linkage for Reversible Immobilization of Oligohistidine Tagged Proteins in the Biacore Surface-Plasmon Resonance Detector. Journal of Immunological Methods. 1995;183:65–76. doi: 10.1016/0022-1759(95)00032-6. [DOI] [PubMed] [Google Scholar]
- Glaser RW, Hausdorf G. Binding kinetics of an antibody against HIV p24 core protein measured with real-time biomolecular interaction analysis suggest a slow conformational change in antigen p24. J Immunol Methods. 1996;189:1–14. doi: 10.1016/0022-1759(95)00221-9. [DOI] [PubMed] [Google Scholar]
- Gorshkova I, Svitel J, Razjouyan F, Schuck P. Bayesian analysis of heterogeneity in the distribution of binding properties of immobilized surface sites. Langmuir. 2008;24:11577–86. doi: 10.1021/la801186w. [DOI] [PMC free article] [PubMed] [Google Scholar]
- Hahn CD, Leitner C, Weinbrenner T, Schlapak R, Tinazli A, Tampé R, Lackner B, Steindl C, Hinterdorfer P, Gruber HJ, et al. Self-assembled monolayers with latent aldehydes for protein immobilization. Bioconjugate Chemistry. 2007;18:247–253. doi: 10.1021/bc060292e. [DOI] [PubMed] [Google Scholar]
- Hermanson GT. Bioconjugate Techniques. Academic Press; London: 2013. Available at: http://www.sciencedirect.com/science/book/9780123822390. [Google Scholar]
- Houseman BT, Gawalt ES, Mrksich M. Maleimide-functionalized self-assembled monolayers for the preparation of peptide and carbohydrate biochips. Langmuir. 2003;19:1522–1531. [Google Scholar]
- Jung LS, Nelson KE, Stayton PS, Campbell CT. Binding and dissociation kinetics of wild-type and mutant streptavidins on mixed biotin-containing alkylthiolate monolayers. Langmuir. 2000;16:9421–9432. [Google Scholar]
- Kapinos LE, Schoch RL, Wagner RS, Schleicher KD, Lim RYH. Karyopherin-centric control of nuclear pores based on molecular occupancy and kinetic analysis of multivalent binding with FG nucleoporins. Biophysical Journal. 2014;106:1751–62. doi: 10.1016/j.bpj.2014.02.021. [DOI] [PMC free article] [PubMed] [Google Scholar]
- Khilko SN, Jelonek MT, Corr M, Boyd LF, Bothwell AL, Margulies DH. Measuring interactions of MHC class I molecules using surface plasmon resonance. Journal of Immunological Methods. 1995;183:77–94. doi: 10.1016/0022-1759(95)00033-7. [DOI] [PubMed] [Google Scholar]
- Knoll W. Interfaces and thin films as seen by bound electromagnetic waves. Ann Rev Phys Chem. 1998;49:569–638. doi: 10.1146/annurev.physchem.49.1.569. Available at: http://www.annualreviews.org/doi/pdf/10.1146/annurev.physchem.49.1.569 [Accessed August 10, 2012] [DOI] [PubMed] [Google Scholar]
- Leckband DE. The influence of protein and interfacial structure on the self-assembly of oriented protein arrays. Advances in Biophysics. 1997;34:173–190. doi: 10.1016/s0065-227x(97)89639-6. [DOI] [PubMed] [Google Scholar]
- Leckband DE, Kuhl T, Wang HK, Herron J, Muller W, Ringsdorf H. 4-4-20 anti-fluorescyl IgG Fab’ recognition of membrane bound hapten: direct evidence for the role of protein and interfacial structure. Biochemistry. 1995;34:11467–11478. doi: 10.1021/bi00036a020. [DOI] [PubMed] [Google Scholar]
- Lee JK, Chi YS, Choi IS. Reactivity of acetylenyl-terminated self-assembled monolayers on gold: Triazole formation. Langmuir. 2004;20:3844–3847. doi: 10.1021/la049748b. [DOI] [PubMed] [Google Scholar]
- Lukosz W. Principles and sensitivities of integrated optical and surface plasmon sensors for direct affinity sensing and immunosensing. Biosensors and Bioelectronics. 1991;6:215–225. [Google Scholar]
- Malmborg AC, Borrebaeck CAK. BIAcore as a tool in antibody engineering. Journal of Immunological Methods. 1995;183:7–13. doi: 10.1016/0022-1759(95)00018-6. [DOI] [PubMed] [Google Scholar]
- Margulies DH, Corr M, Boyd LF, Khilko SN. MHC class I/peptide interactions: binding specificity and kinetics. Journal of Molecular Recognition. 1993;6:59–69. doi: 10.1002/jmr.300060204. [DOI] [PubMed] [Google Scholar]
- Melikishvili M, Rodgers DW, Fried MG. 6-Carboxyfluorescein and structurally similar molecules inhibit DNA binding and repair by O(6)-alkylguanine DNA alkyltransferase. DNA Repair. 2011;10:1193–1202. doi: 10.1016/j.dnarep.2011.09.007. [DOI] [PMC free article] [PubMed] [Google Scholar]
- van der Merwe PA, Barclay AN. Analysis of cell-adhesion molecule interactions using surface plasmon resonance. Current Opinion in Immunology. 1996;8:257–261. doi: 10.1016/s0952-7915(96)80065-3. [DOI] [PubMed] [Google Scholar]
- Minton AP. Confinement as a determinant of macromolecular structure and reactivity. II. Effects of weakly attractive interactions between confined macrosolutes and confining structures. Biophysical Journal. 1995;68:1311–1322. doi: 10.1016/S0006-3495(95)80304-8. [DOI] [PMC free article] [PubMed] [Google Scholar]
- Minton AP. Molecular crowding: Analysis of effects of high concentrations of inert cosolutes on biochemical equilibria and rates in terms of volume exclusion. Methods Enzymol. 1998;295:127–149. doi: 10.1016/s0076-6879(98)95038-8. [DOI] [PubMed] [Google Scholar]
- de Mol NJ. Surface Plasmon Resonance for Proteomics. In: Zanders ED, editor. Chemical Genomics and Proteomics: Reviews and Protocols. 2012. pp. 33–53. [Google Scholar]
- Müller KM, Arndt KM, Plückthun A. Model and simulation of multivalent binding to fixed ligands. Anal Biochem. 1998;261:149–158. doi: 10.1006/abio.1998.2725. [DOI] [PubMed] [Google Scholar]
- Myszka DG, Jonsen MD, Graves BJ. Equilibrium analysis of high affinity interactions using BIACORE. Analytical Biochemistry. 1998;265:326–330. doi: 10.1006/abio.1998.2937. [DOI] [PubMed] [Google Scholar]
- Nieba L, Krebber A, Plückthun A. Competition BIAcore for measuring true affinities: large differences from values determined from binding kinetics. Anal Biochem. 1996;234:155–65. doi: 10.1006/abio.1996.0067. Demonstration how competition approaches can be used to circumvent kinetic artifacts. [DOI] [PubMed] [Google Scholar]
- O’Shannessy DJ, Brigham-Burke M, Peck K. Immobilization chemistries suitable for use in the BIAcore surface plasmon resonance detector. Anal Biochem. 1992;205:132–6. doi: 10.1016/0003-2697(92)90589-y. Collection of immobilization techniques. [DOI] [PubMed] [Google Scholar]
- O’Shannessy DJ, O’Donnell KC, Martin J, Brigham-Burke M. Detection and quantitation of hexa-histidine-tagged recombinant proteins on western blots and by a surface plasmon resonance biosensor technique. Analytical Biochemistry. 1995;229:119–124. doi: 10.1006/abio.1995.1387. [DOI] [PubMed] [Google Scholar]
- O’Shannessy DJ, Winzor DJ. Interpretation of deviations from pseudo-first-order kinetic behavior in the characterization of ligand binding by biosensor technology. Anal Biochem. 1996;236:275–83. doi: 10.1006/abio.1996.0167. [DOI] [PubMed] [Google Scholar]
- Ober RJ, Ward ES. The choice of reference cell in the analysis of kinetic data using BIAcore. Analytical Biochemistry. 1999a;271:70–80. doi: 10.1006/abio.1999.4129. [DOI] [PubMed] [Google Scholar]
- Ober RJ, Ward ES. The influence of signal noise on the accuracy of kinetic constants measured by surface plasmon resonance experiments. Analytical Biochemistry. 1999b;273:49–59. doi: 10.1006/abio.1999.4185. [DOI] [PubMed] [Google Scholar]
- Plant AL, Brigham-Burke M, Petrella EC, O’Shannessy DJ. Phospholipid/Alkanethiol bilayers for cell-surface receptor studies by surface plasmon resonance. Anal Biochem. 1995;226:342–348. doi: 10.1006/abio.1995.1234. [DOI] [PubMed] [Google Scholar]
- Ramsden JJ, Bachmanova GI, Archakov AI. Immobilization of proteins to lipid bilayers. Biosensors and Bioelectronics. 1996;11:523–528. doi: 10.1016/0956-5663(96)86789-3. [DOI] [PubMed] [Google Scholar]
- Rich RL, Quinn JG, Morton T, Stepp JD, Myszka DG. Biosensor-based fragment screening using FastStep injections. Analytical Biochemistry. 2010;407:270–277. doi: 10.1016/j.ab.2010.08.024. [DOI] [PMC free article] [PubMed] [Google Scholar]
- Rusnati M, Chiodelli P, Bugatti A, Urbinati C. Bridging the past and the future of virology: Surface plasmon resonance as a powerful tool to investigate virus/host interactions. Critical Reviews in Microbiology. 2015;41:238–260. doi: 10.3109/1040841X.2013.826177. [DOI] [PubMed] [Google Scholar]
- Safina G. Application of surface plasmon resonance for the detection of carbohydrates, glycoconjugates, and measurement of the carbohydrate-specific interactions: A comparison with conventional analytical techniques. A critical review. Analytica Chimica Acta. 2012;712:9–29. doi: 10.1016/j.aca.2011.11.016. [DOI] [PubMed] [Google Scholar]
- Schasfoort RBM, Tudos AJ. Handbook of Surface Plasmon Resonance. Royal Society of Chemistry; Cambridge, UK: 2008. [Google Scholar]
- Schuck P. Kinetics of ligand binding to receptor immobilized in a polymer matrix, as detected with an evanescent wave biosensor. I. A computer simulation of the influence of mass transport. Biophys J. 1996;70:1230–49. doi: 10.1016/S0006-3495(96)79681-9. [DOI] [PMC free article] [PubMed] [Google Scholar]
- Schuck P. On the analysis of protein self-association by sedimentation velocity analytical ultracentrifugation. Anal Biochem. 2003;320:104–124. doi: 10.1016/s0003-2697(03)00289-6. [DOI] [PubMed] [Google Scholar]
- Schuck P. Reliable determination of binding affinity and kinetics using surface plasmon resonance biosensors. Curr Opin Biotech. 1997a;8:498–502. doi: 10.1016/s0958-1669(97)80074-2. [DOI] [PubMed] [Google Scholar]
- Schuck P. Use of surface plasmon resonance to probe the equilibrium and dynamic aspects of interactions between biological macromolecules. Ann Rev Biophys Biomol Struct. 1997b;26:541–566. doi: 10.1146/annurev.biophys.26.1.541. General review of the method and its application. [DOI] [PubMed] [Google Scholar]
- Schuck P, Millar DB, Kortt AA. Determination of binding constants by equilibrium titration with circulating sample in a surface plasmon resonance biosensor. Anal Biochem. 1998;265:79–91. doi: 10.1006/abio.1998.2872. [DOI] [PubMed] [Google Scholar]
- Schuck P, Minton AP. Analysis of mass transport-limited binding kinetics in evanescent wave biosensors. Anal Biochem. 1996;240:262–72. doi: 10.1006/abio.1996.0356. [DOI] [PubMed] [Google Scholar]
- Schuck P, Zhao H, Brautigam CA, Ghirlando R. Basic Principles of Analytical Ultracentrifugation. CRC Press; Boca Raton, FL: 2015. [Google Scholar]
- Schuster SC, Swanson RV, Alex LA, Bourret RB, Simon MI. Assembly and function of a quaternary signal transduction complex monitored by surface plasmon resonance. Nature. 1993;365:343–347. doi: 10.1038/365343a0. [DOI] [PubMed] [Google Scholar]
- Sigal GB, Bamdad C, Barberis A, Strominger J, Whitesides GM. A self-assembled monolayer for the binding and study of histidine-tagged proteins by surface plasmon resonance. Analytical Chemistry. 1996;68:490–497. doi: 10.1021/ac9504023. [DOI] [PubMed] [Google Scholar]
- Silhavy TJ, Szmelcman S, Boos W, Schwartz M. On the significance of the retention of ligand by protein. Proc Natl Acad Sci USA. 1975;72:2120–2124. doi: 10.1073/pnas.72.6.2120. [DOI] [PMC free article] [PubMed] [Google Scholar]
- Stein T, Gerisch G. Oriented binding of a lipid-anchored cell adhesion protein onto a biosensor surface using hydrophobic immobilization and photoactive crosslinking. Analytical Biochemistry. 1996;237:252–9. doi: 10.1006/abio.1996.0237. [DOI] [PubMed] [Google Scholar]
- Svitel J, Balbo A, Mariuzza RA, Gonzales NR, Schuck P. Combined affinity and rate constant distributions of ligand populations from experimental surface-binding kinetics and equilibria. Biophys J. 2003;84:4062–4077. doi: 10.1016/S0006-3495(03)75132-7. Description of the EVILFIT analysis method. [DOI] [PMC free article] [PubMed] [Google Scholar]
- Svitel J, Boukari H, Van Ryk D, Willson RC, Schuck P. Probing the functional heterogeneity of surface binding sites by analysis of experimental binding traces and the effect of mass transport limitation. Biophys J. 2007;92:1742–58. doi: 10.1529/biophysj.106.094615. Description of the EVILFIT analysis method. [DOI] [PMC free article] [PubMed] [Google Scholar]
- Wammes AEM, Fischer MJE, de Mol NJ, van Eldijk MB, Rutjes FPJT, van Hest JCM, van Delft FL. Site-specific peptide and protein immobilization on surface plasmon resonance chips via strain-promoted cycloaddition. Lab on a Chip. 2013;13:1863–7. doi: 10.1039/c3lc41338a. [DOI] [PubMed] [Google Scholar]
- Yarmush ML, Patankar DB, Yarmush DM. An analysis of transport resistances in the operation of BIAcore; implications for kinetic studies of biospecific interactions. Molecular Immunology. 1996;33:1203–1214. doi: 10.1016/s0161-5890(96)00075-2. [DOI] [PubMed] [Google Scholar]
- Yousaf MN, Mrksich M. Diels-Alder reaction for the selective immobilization of protein to electroactive self-assembled monolayers. Journal of the American Chemical Society. 1999;121:4286–4287. [Google Scholar]
- Zhang X, Bajic G, Andersen GR, Christiansen SH, Vorup-Jensen T. The cationic peptide LL-37 binds Mac-1 (CD11b/CD18) with a low dissociation rate and promotes phagocytosis. Biochimica et Biophysica Acta (BBA) - Proteins and Proteomics. 2016;1864:471–478. doi: 10.1016/j.bbapap.2016.02.013. [DOI] [PubMed] [Google Scholar]
- Zhao H, Berger AJ, Brown PH, Kumar J, Balbo A, May CA, Casillas E, Laue TM, Patterson GH, Mayer ML, et al. Analysis of high-affinity assembly for AMPA receptor amino-terminal domains. J Gen Physiol. 2012;139:371–388. doi: 10.1085/jgp.201210770. [DOI] [PMC free article] [PubMed] [Google Scholar]
- Zhao H, Brown PH, Schuck P. On the distribution of protein refractive index increments. Biophys J. 2011;100:2309–2317. doi: 10.1016/j.bpj.2011.03.004. [DOI] [PMC free article] [PubMed] [Google Scholar]
- Zhao H, Gorshkova I, Fu GL, Schuck P. A comparison of binding surfaces for SPR biosensing using an antibody-antigen system and affinity distribution analysis. Methods. 2013;59:328–335. doi: 10.1016/j.ymeth.2012.12.007. [DOI] [PMC free article] [PubMed] [Google Scholar]
- Zhao H, Schuck P. Global multi-method analysis of affinities and cooperativity in complex systems of macromolecular interactions. Anal Chem. 2012;84:9513–9519. doi: 10.1021/ac302357w. [DOI] [PMC free article] [PubMed] [Google Scholar]