

Abstract
Objective
To test the hypotheses that 1) antemortem cerebrospinal fluid tau levels correlate with postmortem tau pathology in frontotemporal lobar degeneration and 2) tauopathy patients have higher phosphorylated-tau levels compared to TDP-43 proteinopathy patients while accounting for Alzheimer’s disease co-pathology.
Methods
Patients had autopsy-confirmed frontotemporal lobar degeneration with tauopathy (n=31), TDP-43 proteinopathy (n=49), or Alzheimer’s disease (n=26) with antemortem cerebrospinal fluid. Cerebrospinal fluid tau levels were compared between groups and correlated with digital histology measurement of postmortem tau pathology averaged from three cerebral regions (angular gyrus, mid-frontal cortex, anterior cingulate gyrus). Multivariate linear regression tested the association of ante mortem cerebrospinal fluid tau levels with post mortem tau pathology adjusting for demographics.
Results
Multivariate regression found an independent association of ante mortem cerebrospinal fluid phosphorylated tau levels with post mortem cerebral tau pathology in frontotemporal lobar degeneration (Beta=1.3, 95%CI=0.2–2.4, p<0.02). After excluding patients with coincident Alzheimer-associated tau pathology accompanying sporadic frontotemporal lobar degeneration, we found lower cerebrospinal fluid phosphorylated tau levels in the TDP-43 group (median=7.4 pg/ml, IQR=6.0,12.3, n=26) compared to the tauopathy group (median=12.5 pg/ml, IQR=10.7,15.0, n=23; Z=2.6, p<0.01).
Interpretation
Cerebrospinal fluid phosphorylated-tau levels are positively associated with cerebral tau burden in frontotemporal lobar degeneration. In vivo detection of Alzheimer’s disease co-pathology in sporadic frontotemporal lobar degeneration patients may help stratify clinical cohorts with pure neuropathology in which low cerebrospinal fluid phosphorylated-tau levels may have diagnostic utility to distinguish TDP-43 proteinopathy from tauopathy. Autopsy-confirmed samples are critical for frontotemporal lobar degeneration biomarker development and validation.
INTRODUCTION
Cerebrospinal fluid (CSF) biomarkers of total-tau (t-tau) and phosphorylated-tau (p-tau) have been extensively studied in the context of aging and Alzheimer’s disease (AD)1, where the density of postmortem cortical tau pathology is most closely associated with antemortem CSF p-tau levels2, 3 and increased t-tau levels are thought to reflect non-specific axonal damage and neuronal loss 4–6.
Nearly half of all patients presenting with a frontotemporal dementia (FTD) clinical syndrome have neuropathological findings of primary tauopathy consistent with Frontotemporal lobar degeneration (i.e. FTLD-Tau)7. However, the relationship between antemortem CSF t-tau and p-tau with postmortem FTLD tau pathology has not been systematically studied. Indeed, the majority of CSF biomarker studies in FTLD to date have been performed in clinically-diagnosed FTD cohorts where >50% of patients may have TDP-43 proteinopathy (FTLD-TDP) or an atypical clinical variant of AD neuropathology7. Further, AD co-pathology is not uncommon in FTLD and other neurodegenerative disorders, and this secondary AD pathology may influence CSF biomarker levels of tau8, 9. Finally, hereditary forms of FTLD may have divergent patterns of pathology10, 11, more aggressive disease12–14 and additional proteinopathy15 that could potentially influence CSF biomarkers7. A recent comprehensive review thus indicates considerable variability in reported values of CSF t-tau and p-tau levels in clinical FTD16. Several recent studies have examined patients with clinical syndromes highly predictive of molecular etiology or autopsy/genetic confirmed samples, and find that there may be diagnostic utility to differentiate FTLD-Tau from FTLD-TDP using a diagnostic cut-off of CSF p-tau or p-tau-to-t-tau ratio but it is unclear if this diagnostic accuracy is driven by lower p-tau or higher t-tau in FTLD-TDP17–19.
Here we examine a large cohort of autopsy-confirmed patients to examine the relationship between the severity of postmortem cerebral tau pathology and CSF tau biomarkers in FTLD and AD using a validated semi-quantitative digital image analysis of histology sections20. We provide the first direct correlation of CSF p-tau levels with cerebral tau pathology in FTLD. Further, we find that CSF p-tau is lower in FTLD-TDP than FTLD-Tau on group-wise comparisons of FTLD patients with pure sporadic FTLD pathology and show individual patient level diagnostic specificity for low CSF p-tau, emphasizing that coincident AD neuropathology and mutation status should be taken into account when interpreting CSF biomarkers in FTLD.
METHODS
Patients
Patients were followed clinically at the Penn Frontotemporal Degeneration Center or Alzheimer’s Disease Center and autopsied at the Penn Center for Neurodegenerative Disease Research. We identified patients with a primary neuropathological diagnosis of FTLD-Tau (n=31) or TDP-43 proteinopathy (i.e. FTLD-TDP and/or amyotrophic lateral sclerosis, ALS) (n=49), and a reference group of patients with primary AD pathology (n=26) with available antemortem CSF for analysis (Table 1). Neuropathological examination was performed using established methods21 and criteria22 as described. To examine the isolated contribution of AD neurofibrillary tau pathology on CSF biomarkers, we excluded primary AD patients with secondary limbic (i.e. amygdala, hippocampal) α-synuclein23 or TDP-43 pathology24 (n=5). Braak tau stages were obtained at autopsy using evaluation of the hippocampus and cortical regions22 using p-tau IHC in FTLD-TDP and AD. In FTLD-Tau patients, sections of the hippocampus were stained with the amyloid binding dye, Thioflavin-S, as described25 to distinguish co-morbid age-related AD neurofibrillary tangle (NFT) pathology from primary FTLD-tauopathy26 for tau Braak staging by two experienced reviewers (DJI, EBL) blinded to CSF data. Both staining methods are considered equivalent for AD neuropathological diagnostic criteria22.
Table 1. Patient data.
Normally distributed variables are reported as Mean (Standard Deviation) and non-normally distributed variables are reported as median (1st quartile, 3rd quartile). PMI=post mortem interval, M=male, F=female, UC= unclassifiable TDP subtype, ALS= amyotrophic lateral sclerosis (2 patients have ALS with mild cognitive impairment), ALS-FTD= ALS with FTD, PID= Pick’s disease, CBD=corticobasal syndrome, PSP=progressive supranuclear palsy, FTDP-17= frontotemporal dementia with MAPT mutation and tauopathy, TUC= tauopathy unclassifiable.
| FTLD-TDP N=49 |
FTLD-Tau N=31 |
AD N=26 |
|
|---|---|---|---|
| Sex | M=24 F=25 |
M=20 F=11 |
M=14 F=12 |
| Neuropathological Subtype | ALS=10 ALS-FTD=4 A=6 B=15 C=9 UC=3 |
PID=5 PSP=10 CBD=12 FTDP17=3 TUC=1 |
- |
| Hereditary Mutations |
GRN=8 C9orf72=12 |
MAPT=3 | - |
| PMI | 12 (7, 18) | 12.5 (6.4,18.3) | 12.0 (7.8, 20.0) |
| Brain Weight (g) | 1174.9 (220.0) | 1126.6 (135.3) | 1109.4 (142.2) |
| Braak Tau Stage | B0=18 B1=21 B2=07 B3=03 |
B0=13 B1=14 B2=02 B3=02 |
B2=02 B3=24 |
| CERAD Plaque Stage | C0=37 C1=04 C2=03 C3=05 |
C0=21 C1=05 C2=03 C3=02 |
C2=02 C3=24 |
| Age at Onset (y) | 60.4 (8.8) | 59.9 (9.2) | 64.5 (11.1) |
| Age at Death (y) | 66.6 (9.8) | 67.6 (10.0) | 73.0 (11.8)* |
| Disease Duration (y) | 6.1 (3.5) | 7.8 (4.2) | 8.5 (3.5)* |
| Age at CSF (y) | 63.3 (9.1) N=49 |
63.5 (10.0) N=31 |
67.9 (10.7) N=26 |
| Onset-CSF Interval (y) | 2 (1,4) N=49 |
3 (2,4) N=31 |
2.5 (2,5.3) N=26 |
| CSF-Death Interval (y) | 3 (1,5) N=49 |
4 (1,6) N=31 |
5.5 (2,7)
** N=26 |
| CSF Aβ1-42 (pg/ml) | 226.3 (69.0) N=40 |
220.6 (46.4) N=24 |
117.6 (37.3)
*‡ N=23 |
| CSF t-tau (pg/ml) | 45.5 (29.0, 84.3) N=49 |
44.2 (30.0, 67.0) N=31 |
98.4 (57.4, 175.8)**,‡ N=26 |
| CSF p-tau (pg/ml) | 8.5 (6.5, 17.0) N=47 |
12.0 (10.8, 15.5) N=29 |
36.8 (23.7, 72.9)**,‡ N=26 |
p<0.05 compared to FTLD-TDP
p<0.01 compared to FTLD-TDP
p<0.01 compared to FTLD-Tau
CSF analysis
Antemortem CSF was collected through standardized operating procedures as described8. One of two analytical platforms (i.e. Innotest ELISA; Fujirebio-Europe or INNO-BIA AlzBio 3 xMAP Luminex; Fujirebio-Europe) were used to measure CSF t-tau, p-tau (threonine181) and Aβ1–42 as described8. We previously found that absolute values for these analytes are highly correlated between platforms and can be transformed into equivalent units for analysis.8, 27, 28 Thus, we used a validated algorithm8 to transform ELISA t-tau and p-tau into equivalent xMAP units for analysis.
Digital Image Analysis of Histology
We used a validated sampling and intensity thresholding method20 to quantify the percent area occupied (%AO) of total p-tau immunoreactivity (AT829, Thermo Scientific) in an anterior (mid-frontal cortex, MFC), posterior (angular gyrus, ANG) and limbic (anterior cingulate gyrus, CING) region. Since p-tau IHC detects both AD and FTLD-Tau associated tauopathy, we performed a sub-analysis of FTLD patients after excluding those with AD tau Braak stages B2 or B3, consistent with age-associated tangles extending beyond medial limbic structures30, to examine the relationship between pure FTLD-Tau pathology and CSF p-tau levels.
All slides in each region were stained in the same batch to reduce “run-to-run” variation. Briefly, digital images were obtained using a Lamina (Perkin Elmer, Waltham MA) slide scanning system at 20x. Digital image analysis was performed Halo digital image software v1.90 (Indica Labs, Albuquerque NM). We used a vertical-transect method31 to sample the longest intact parallel-oriented grey matter (GM) ribbon to reduce bias from over- or under-representation of cortical laminae that preferentially contain FTLD and AD neuropathology32. We also sampled the largest available deep white matter (WM) area per slide using the rectangular selection tool. A random sampling of 30% of the GM and WM regions selected was performed using 175 μm tiles and a validated intensity threshold was applied to quantify all pathological tau (Figure 1) in each random tile. We used the average %AO value from randomly placed tiles for each GM and WM selection per slide. Since FTLD-Tau has a significant burden of WM tau pathology25, 33, we added the GM and WM tau %AO in each region and used the average GM+WM sum from the three cerebral regions in each group for comparative analysis (i.e. cerebral tau %AO). Cerebral tau %AO measurements were validated through comparison to traditional ordinal rating scores, as we have done previously. There was missing tissue for MCG=6, ANG=7, CING=6. Cases with missing data (n=18) in one or more of these regions were excluded from total cerebral tau %AO analyses.
Figure 1. Digital image analysis of cerebral tau pathology.

Representative photomicrographs depict raw images (top) and digital image analysis thresholding quantification (%AO; bottom- red/orange/yellow overlay) of tau pathology in the mid-frontal cortex for A–B) AD, C–D) FTLD-Tau and E–F) FTLD-TDP with coincident AD pathology. There is higher overall and GM burden of cerebral tau pathology in AD compared to FTLD-Tau and FTLD-TDP, while FTLD-Tau has higher white-matter tau pathology compared to both groups.
Genetic Analysis
DNA was isolated from frozen brain or blood and screened for mutations in MAPT, GRN, and C9orf72 based on pedigree analysis for risk of hereditary disease34 using previously described methods25, 35.
Statistical Analysis
Variables were examined for normality and one-way ANOVA or Kruskal-Wallis test were performed across the three neuropathological groups as appropriate, with planned post-hoc t-tests or Mann-Whitney U analyses, respectively, performed between each group. Categorical variables were compared between groups using a chi-square analysis. For correlation and regression models we used natural log (ln) transformation to obtain normally-distributed variables for analysis. We used Pearson correlation and a multivariate regression model in the FTLD cohort with ln cerebral tau %AO as the dependent variable and ln CSF p-tau as the independent variable adjusting for analytic platform, age, disease duration and time to death at CSF collection. Model construction was performed using Bayesian information criteria (BIC)36 to derive the final model (variables that did not improve BIC value were excluded from final model). Demographic variables surviving this model building procedure were used as co-variates in the following subsequent analyses. To test the independent association of potential subgroups of FTLD patients which could influence diagnostic accuracy of CSF p-tau levels in FTLD based on previous literature9, 16 we first used linear regression analysis with CSF p-tau levels as the dependent variable in the base model including neuropathological group (FTLD-Tau vs FTLD-TDP), age and time to death at CSF collection. Our first model examined the independent association of the categorical presence of co-AD tau Braak stages B2–B3 (i.e. neocortical AD tau) to those patients with those with pure FTLD pathology (i.e. AD Braak tau stage B0–B1). Based on these results, a similar model was performed in the pure FTLD subgroup to test the independent association of the presence of a pathogenic mutation in hereditary FTLD with CSF p-tau levels while co-varying for these demographic variables. Receiver operating characteristic curve (ROC) analysis was performed to test the diagnostic accuracy of CSF p-tau levels.
Missing data was excluded and reported in Table 1. All analyses were performed using two-tailed statistics with p<0.05 using SPSS v21.0 (IBM Corp., Armonk NY) or STATA v12.1 (StataCorp., College Station TX).
Results
Patient groups
Table 1 depicts demographics, pathological and biomarker data for the cohort. Patient groups did not differ in postmortem interval, brain weight or age at onset. There was a significant difference across groups in age at death (Mean difference AD-FTLD-TDP=6.5, AD-FTLD-Tau=5.4, FTLD-Tau-FTLD-TDP=−1.1 years, p=0.04) and overall disease duration (Mean difference AD-FTLD-TDP=2.4, AD-FTLD-Tau=0.8, FTLD-Tau-FTLD-TDP=−1.7 years, p=0.02). Planned post-hoc comparisons find AD had a later age at death (Mean difference=6.5 years, p=0.02) and longer disease duration (Mean difference=2.4 years, p<0.01) compared to the FTLD-TDP group.
There was no significant difference between groups with a primary pathologic diagnosis of FTLD-Tau and FTLD-TDP (i.e. including cases with coincident secondary AD pathology) for CSF biomarkers and demographics at time of collection (please see below for factors influencing this analysis). The median (range) in duration from CSF collection to death was 3 (<1–12) years for FTLD-TDP, 4 (<1–12) years for FTLD-Tau and 5.5 (1–10) years for AD. As expected, the AD group had lower Aβ1-42 and higher t-tau and p-tau levels compared to both FTLD-Tau (Mean difference Aβ1-42=−102.9 pg/ml, p<0.001; t-tau median difference= 54.2 pg/ml, p<0.001; p-tau median difference=24.8 pg/ml, p=<0.001) and FTLD-TDP groups (Aβ1-42 mean difference=−108.7 pg/ml, p<0.001; t-tau median difference=52.9 pg/ml, p<0.001; p-tau median difference=,28.3 pg/ml, p<0.001).
Cerebral tau burden in FTLD and AD
Reflecting group-wise differences in CSF p-tau levels, comparison of digital image analysis measurement of cortical p-tau pathology revealed a higher average total cerebral tau %AO in pathologic AD compared to cases with primary FTLD-Tau (Median difference=29.9%, p=0.03) and FTLD-TDP pathology (i.e. including cases with coincident secondary AD pathology) (Median difference=65.9%, p<0.001) and FTLD-Tau also had higher average total tau% AO than FTLD-TDP (Median difference=36.0%, p<0.001) (Figures 1,2). Since FTLD-Tau has considerable WM tau pathology, we also examined GM and WM separately in each region and found AD had higher average GM tau %AO compared to FTLD-Tau (Median difference=43.8%, p<0.01) and FTLD-TDP (Median difference=64.2%, p<0.001), while FTLD-Tau had higher average total cerebral WM tau %AO compared to AD (Median difference=4.1%, p<0.01) and FTLD-TDP (Median difference=5.2%, p<0.001) (Figures 1,2).
Figure 2. Grey and white matter cerebral tau pathology in FTLD-Tau, FTLD-TDP and AD.

Boxplots depict values of %AO of tau immunohistochemistry from grey and white matter in each region sampled for each neuropathological group. *=p<0.05, #=p<0.01, ‡≤0.001.
CSF- pathology associations
In the total cohort, there was a moderate correlation between ln CSF t-tau and ln CSF p-tau (r=0.5, p<0.001). Across patient groups there was a moderate correlation between the ln average cortical tau %AO with ln CSF p-tau (r=0.5, p<0.001) (Figure 3A) and less so with ln CSF t-tau (r=0.2, p=0.04) levels. A subset analysis of the FTLD group alone finds a similar association for the ln average cerebral tau %AO with ln CSF p-tau (r=0.3, p=0.03) (Figure 3B) but not for ln CSF t-tau (r=−0.06, p>0.1). To account for demographic variables, we used multivariate linear regression in the total FTLD group using ln average cerebral tau %AO as the dependent variable and found a significant association of ln CSF p-tau (Beta=1.3, 95%CI=0.2–2.4, p<0.02) when adjusting for demographic co-variates (Table 2). A similar model examining ln CSF t-tau finds no significant association with postmortem tau %AO (data not shown), conferring specificity of antemortem CSF p-tau for all forms of tau pathology (i.e. FTLD-tau and co-incident AD tau in both groups).
Figure 3. Correlation of ante mortem CSF phosphorylated tau measurements with postmortem cerebral tau severity.

Scatterplot depicts individual patient data points coded for by primary pathology (Blue= FTLD-TDP, Orange= FTLD-Tau, Red= AD), the presence of hereditary mutations (open circles) and AD tau co-pathology (large circles= AD tau Braak B2/B3) for natural log transformed CSF p-tau levels (y-axis) compared to natural-log transformed total cerebral tau %AO pathology measurement (x-axis) in A) the total FTLD and AD cohort (r=0.5, p<0.01) and B) the total FTLD cohort (r=0.3, p=0.02). and C) pure sporadic FTLD cohort (r=0.4, p=0.02) excluding patients with AD co-pathology or a hereditary mutation.
Table 2. Multivariate regression models to predict post-mortem cortical tau pathology.
Table displays optimal multivariate model using natural-log %AO cortical tau post-mortem pathology measurement as the dependent variable and natural-log ante mortem cerebrospinal fluid p-tau levels as an independent variable adjusting for demographic features for A) the total FTLD cohort (Model R2=0.21, F(3,63)=5.6, p<0.01) and B) the subset analysis of sporadic patients with “pure” (AD Braak tau co-pathology stage=B0/B1) FTLD (Model R2=0.28, F(3,39)=5.1, p<0.01).
| A) TOTAL FTLD COHORT | |||
|---|---|---|---|
| VARIABLE | Beta (95% CI) | T-VALUE | P-VALUE |
| ln CSF p-tau | 1.3 (0.2 – 2.4) | 2.6 | 0.01 |
| Age at CSF Collection (years) | −0.1 (−0.1 – −0.01) | −2.4 | 0.02 |
| CSF Collection- Death Interval (years) | 0.2 (0.02 – 0.4) | 2.3 | 0.03 |
| Intercept | 0.7 (−2.7 – 4.1) | 0.4 | 0.7 |
| B) “PURE” SPORADIC FTLD COHORT | |||
| VARIABLE | Beta (95% CI) | T-VALUE | P-VALUE |
| ln CSF p-tau | 2.0 (0.6 – 3.4) | 3.0 | <0.01 |
| Age at CSF Collection (years) | −0.1 (−0.1 – −0.01) | −2.2 | 0.04 |
| CSF Collection- Death Interval (years) | 0.2 (−0.04 – 0.4) | 1.6 | 0.1 |
| Intercept | −0.2 (−4.8 – 4.4) | −0.1 | 0.9 |
A comparison of our entire FTLD cohort (i.e. including cases with coincident secondary AD pathology) revealed a non-significant trend for lower CSF p-tau in FTLD-TDP compared to FTLD-Tau (Figure 4A). Since the presence of AD co-pathology or a pathogenic mutation in the FTLD group appeared associated with higher CSF p-tau levels in individual patient data (Figures 3A, 4A) and previous literature9, 16 we first analyzed the association of co-morbid AD tau pathology (i.e. AD Braak tau stage B2 or B3) with CSF p-tau while co-varying for neuropathological diagnosis and demographics. This analysis revealed an independent association of AD co-pathology with CSF p-tau levels (Beta=0.4 95%CI=0.04–0.7; p<0.03) (Table 3A), suggesting that AD co-pathology can influence CSF p-tau measurements independent of FTLD proteinopathy. As such, the remainder of analyses focused on patients with pure FTLD TDP-43 or tau pathology (i.e. minimal AD tau co-pathology restricted to the medial temporal lobe; AD tau Braak stages B0–B1) and excluded patients with AD Braak tau stages B2 or B3 (n=14; i.e. AD tau co-pathology extending into the neocortex). Group-wise analysis of pure FTLD patients finds a lower CSF p-tau level in the FTLD-TDP group (n=35) compared with the FTLD-Tau group (n=25) (median difference=−4 pg/ml, p<0.03; Figure 4B). We found a higher CSF p-tau/Aβ1-42 ratio in FTLD with AD co-pathology (n=10) compared to pure FTLD (n=53) (median difference=0.03, p<0.04). To test the ability of CSF to identify AD co-pathology in FTLD, we excluded patients with CSF p-tau/Aβ1-42 ratio value indicative of AD pathology (i.e. >0.1)1 and found a similar lower CSF p-tau level in FTLD-TDP (n=23) compared to FTLD-Tau (n=31) (median difference=−4 pg/ml, p=0.03).
Figure 4. CSF p-tau levels in FTLD neuropathological groups with and without coincident AD neuropathology or hereditary disease.

Scatter plots depict individual data points in each group coded for the primary pathology (Blue= FTLD-TDP, Orange= FTLD-Tau, Red= AD), presence AD tau co-pathology (large circles= AD tau Braak B2/B3) and hereditary mutations (open circles) for CSF p-tau values (pg/ml) in A) the total FTLD and AD cohort B) pure FTLD patients (excluding those cases with coincident AD-associated tau pathology (n=14) and C) pure sporadic FTLD additionally excluding those pure FTLD patients with a hereditary mutation (n=15) and data points coded for age younger than 65 years (triangles). Bars represent median and interquartile range values from box-plot. *=p<0.02, **p<0.01.
Table 3. Influence of AD co-pathology and mutation status on cerebrospinal fluid phosphorylated tau levels in FTLD.
Table displays optimal multivariate model using natural-log transformed cerebrospinal fluid phosphorylated-tau measurement as the dependent variable to test A) the independent association of the categorical presence of Alzheimer’s disease co-pathology (i.e. AD Braak tau co-pathology stage=B2/B3 vs B0/B1) in the total FTLD cohort (Model R2=0.14, F(4,71)=2.8, p<0.05) and B) the independent association of the presence of a pathogenic mutation with CSF p-tau measurement in the subset of patients with “pure” (AD Braak tau co-pathology stage=B0/B1) FTLD (Model R2=0.20, F(4,58)=3.5, p<0.02).
| A) TOTAL FTLD COHORT | |||
|---|---|---|---|
| VARIABLE | Beta (95% CI) | T-VALUE | P-VALUE |
| AD co-pathology (Braak B2/B3 vs B0/B1) | 0.4 (0.04 – 0.7) | 2.3 | 0.027 |
| FTLD Pathology Group (FTLD-Tau vs FTLD-TDP) | 0.2 (−0.06 – 0.5) | 01.54 | 0.127 |
| Age at CSF Collection (years) | 0.01 (−0.002 – 0.02) | 1.7 | 0.086 |
| CSF Collection- Death Interval (years) | 0.01 (−0.03 – 0.06) | 0.6 | 0.545 |
| Intercept | 1.5 (0.6 – 2.3) | 3.6 | 0.001 |
| B) “PURE” FTLD COHORT | |||
| VARIABLE | Beta (95% CI) | T-VALUE | P-VALUE |
| Mutation Status | 0.3 (0.004 – 0.5) | 2.0 | 0.047 |
| FTLD Pathology Group (FTLD-Tau vs FTLD-TDP) | 0.3 (0.1 – 0.6) | 2.9 | 0.005 |
| Age at CSF Collection (years) | 0.01 (0 – 0.02) | 1.9 | 0.052 |
| CSF Collection- Death Interval (years) | 0.003 (−0.03 – 0.04) | 0.2 | 0.865 |
| Intercept | 1.4 (0.6 – 2.1) | 3.5 | 0.001 |
Next, based on our independent patient data (Figure 3A) and significant literature of pathophysiological differences between hereditary and sporadic FTLD10–15, we examined the association of an FTLD-associated pathogenic mutation with ln CSF p-tau using a similar linear regression model in the pure FTLD cohort without AD co-pathology and found independent association of mutation status (Beta=0.3 95%CI=0.004–0.5; p<0.05) and FTLD-Tau group membership (Beta=0.3 95%CI=0.1 –0.5; p<0.01) (Table 3B).
Since both AD co-pathology and pathogenic mutation status may obscure meaningful comparisons between group in the majority of FTLD patients with pure pathology and sporadic disease (Figure 4A), the following evaluation of diagnostic accuracy and group-wise comparisons focused on sporadic patients with pure FTLD pathology (n=49). First, re-examination of the relationship between ante mortem ln CSF p-tau and ln postmortem tau pathology in the subset of pure FTLD patients with sporadic disease finds a stronger correlation (r=0.4, p=0.02; Figure 3C). Moreover, using linear regression to adjust for demographics there was also a significant association of ln CSF p-tau with ln postmortem measurement of tau pathology (Beta=1.7 95%CI=0.2–3.1, p=0.02; Table 2B) confirming CSF p-tau directly relates to postmortem tau pathology in pure sporadic FTLD alone. Next, a focused subset group-wise analysis of pure sporadic FTLD patients finds a lower CSF p-tau level in the FTLD-TDP group (n=26) compared with the FTLD-Tau group (n=23) (median difference=−3.3 pg/ml, p<0.01; Figure 4C).
In an exploratory analysis of diagnostic accuracy of CSF p-tau in our pure sporadic FTLD cohort we found the values below the optimal cut-point of 10.3 pg/ml had 89.8% specificity and 69.2% sensitivity for pure sporadic FTLD-TDP compared to the combined AD and pure sporadic FTLD-Tau group (AUC=0.85 95% CI=0.76–0.94 p<0.001) and 78.3% specificity and 66.4% sensitivity for pure sporadic FTLD-TDP compared to pure sporadic FTLD-Tau group alone (AUC=0.72 95% CI=0.57–0.87 p<0.01) (Figure 5). Examination of the pure sporadic FTLD-TDP false negative patients (i.e. CSF p-tau >10.3) found they were older at the age of CSF collection (mean=70.8±6.6) compared to true positive FTLD-TDP patients (i.e. CSF p-tau <10.3; mean=60.9±10.9, p=0.01); whereas the frequency of clinical ALS was higher in the true-positive FTLD-TDP patients (8/18, 44%) than false-negative FTLD-TDP patients (2/8, 25%) this did not reach significance (λ2=0.9, p=0.4). Restriction of CSF p-tau diagnostic accuracy assessment to pure sporadic FTLD patients younger than 65 (n=28) found 93.3% specificity and 77.9% sensitivity using a CSF p-tau level cut-off of 9.76 pg/ml (AUC=0.86 95%CI=0.71–1.0, p=0.01; Figure 5).
Figure 5. Diagnostic accuracy to distinguish FTLD-TDP in sporadic patients without Alzheimer’s disease co-pathology.
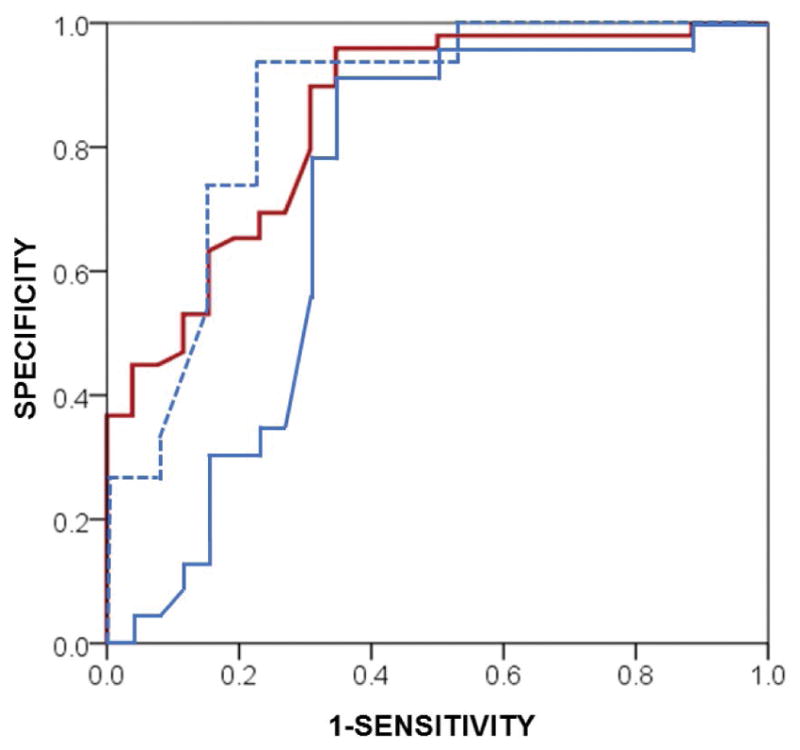
Receiver operating characteristic curve depicts the diagnostic accuracy of CSF p-tau levels for sporadic FTLD-TDP patients with pure pathology (i.e. AD tau Braak B0/B1) (n=26) compared to the combined AD and pure sporadic FTLD-Tau group (n=49; red solid line) (AUC=0.85 95% CI=0.76–0.94 p<0.001) and pure sporadic FTLD-Tau group alone (n=23; blue solid line) (AUC=0.72 95% CI=0.57–0.87 p<0.01). Sub-analysis of pure sporadic FTLD cases younger than 65 years old finds increased diagnostic accuracy using CSF p-tau to differentiate FTLD-TDP from FTLD-Tau (AUC=0.86, 95%CI=0.71–1.0. p=0.01) (blue dashed line).
DISCUSSION
Here we provide, to our knowledge, the first direct assessment of the relationship between antemortem CSF p-tau levels and postmortem tau pathology in FTLD. Using a novel sensitive digital histology method, we found that antemortem CSF p-tau directly correlates with postmortem cerebral tau pathology in FTLD (both including and excluding co-morbid AD neurofibrillary tauopathy) while adjusting for demographics at the time of CSF collection. Moreover, after exclusion of patients with coincident AD neuropathology (i.e. Braak B2–B3) and those with mutations, patients with pure sporadic FTLD-TDP had significantly lower CSF p-tau levels than pure sporadic FTLD-Tau pathology (Figure 4B–C) with individual-patient level diagnostic accuracy of high specificity (>78–89%) and moderate sensitivity (66–78%). These data highlight the importance of autopsy-confirmed samples in the study of biomarkers of FTLD, and suggest a strategy by which traditional CSF analytes may contribute to diagnosis and stratification in disease-modifying clinical trials.
CSF p-tau, but not CSF t-tau, was closely associated with postmortem tau deposition (Figure 3), supporting the notion that p-tau better reflects tau pathology, while t-tau elevations reflect non-specific neuronal injury4–6. The correlation between CSF p-tau and t-tau levels (r=0.5, p<0.01) in our total cohort was similar to previous report of a mixed cohort of FTLD, AD and controls (r=0.67, p<0.001)37 but lower than a large clinical AD series (r=0.77–0.88, p≤0.001)38. This discrepancy could be attributed to sample size, analytical factors or differences between AD and FTLD tau pathology. Indeed, our digital pathology analysis found increased total cerebral tau pathology in the AD group compared to FTLD-Tau, and minimal co-morbid AD tau pathology in the majority of FTLD-TDP (Figure 2), reflecting the group-wise comparisons of CSF p-tau between these groups when accounting for co-AD pathology in FTLD (Figure 4A). As expected, FTLD-Tau had higher WM pathology than AD (Figure 2). AD tauopathy is largely contained within neuropil threads39 with minimal WM tau pathology33. FTLD-Tau also has varying degrees of neuronal and glial GM tau pathology, but this was not as severe as AD GM pathology in our quantitative assessment. Several important distinctions exist between FTLD-associated tauopathy and AD-associated NFTs. These include ultrastructural features 40 and the presence of conformational tau epitopes41 and amyloid-binding dye reactivity (e.g. Thioflavin-S) in mature AD NFT tangles33 that are largely absent in FTLD-Tau pathology26, 42. Finally, AD ghost NFTs remain after neuron loss43, while ghost pathology is largely absent in FTLD-Tau40. Thus, further study is needed on specific forms of pathological tau in the CSF of AD and FTLD patients.
These biochemical and histochemical differences between FTLD- and AD-associated tauopathy notwithstanding, we found a correlation in the amount of all cerebral tau %AO with antemortem p-tau levels in CSF across all patient groups and within FTLD. Longitudinal data characterizing change in CSF tau levels in FTLD are lacking, and the few studies of serial CSF collections in AD find variation between individuals in longitudinal change44; Thus, the timing of CSF collection in the course of disease for our AD group may have influenced results To account for variance in the timing of CSF collection, we performed a multivariate regression model to adjust for this and other demographics (Table 2). Further study is needed to fully establish the longitudinal dynamic profile of CSF biomarkers in AD and FTLD; however, based on our data ante mortem CSF p-tau levels appear to be predictive of the severity of overall FTLD-associated tauopathy.
Although we cannot be certain of the underlying neuropathology in previous clinical FTD patient series, up to 20% of all clinical FTD patients may have primary AD neuropathology7, and this may be even higher in patients with primary progressive aphasia45. Further, coincident AD neuropathology is not uncommon in FTLD9, necessitating autopsy-confirmed samples in biomarker studies. Indeed, in our current cohort, we found 14 FTLD patients with AD-associated tau tangles extending into the neocortex (i.e. Braak stage B2–B3). Consequently, we discovered that patients with secondary AD co-pathology influenced the interpretation of group-wise comparisons of CSF p-tau levels in FTLD (Figure 4A, Table 3). When we excluded cases with Braak tau stage B2–B3, consistent with moderate to severe AD pathology22, we found a significant difference in CSF p-tau levels between autopsied FTLD-Tau and FTLD-TDP groups (Figure 4B). Indeed, FTLD patients with AD co-pathology often have similar CSF p-tau and Aβ1-42 levels to AD patients9. In an exploratory analysis, we found a similar group-wise difference in CSF p-tau levels between FTLD-Tau and FTLD-TDP after excluding patients with pathological levels of CSF p-tau/Aβ1-42 ratio1, suggesting an iterative evaluation of CSF biomarkers to first detect and exclude AD co-pathology prior to interpretation CSF p-tau levels may be useful to distinguish FTLD-Tau from FTLD-TDP in living patients. We did not detect a significant association of CSF p-tau with tau pathology within the FTLD-Tau group alone (data not shown); however, we were limited by ceiling effects for the very high tau pathologic burden and lack of very rare pre-symptomatic autopsy patients with low levels of tau pathology in the FTLD-Tau group, precluding reasonable statistical assessment with our relatively small sample size. These data suggest that in vivo screening for AD neuropathology using methods such as emerging amyloid-beta46 and tau47 imaging ligands, as well as CSF Aβ1-42, before assessing CSF p-tau could potentially be useful to characterize clinical FTD cohorts and aid in the interpretation of CSF biomarkers for clinical trials.
We also found an independent association of mutation status with increased CSF p-tau levels in FTLD after exclusion of AD co-pathology (Table 3). Focused study of CSF biomarkers in hereditary FTLD are rare and often lack autopsy-confirmation.16 Thus, the exact nature of our association of hereditary FTLD with CSF p-tau is unclear; however, a large body of pre-existing literature10–15 suggests altered underlying pathophysiology compared to sporadic disease which could contribute to altered CSF biomarker levels7. Most hereditary patients in our cohort had an FTLD-TDP associated mutation, and we cannot evaluate the association of specific molecular etiologies within the hereditary FTLD sub-cohort in the current study. Further, these mutations are predictive of molecular pathology7 and can be detected clinically through pedigree analysis.34 Therefore, we excluded hereditary patients from our diagnostic accuracy assessment (Figure 5), which was performed to provide proof-of-concept for the clinical use of CSF p-tau levels in sporadic FTLD. Using our pure sporadic FTLD cohort we did find high specificity and moderate sensitivity to distinguish FTLD-TDP (Figure 5). We found some pure FTLD-TDP cases had levels of CSF p-tau similar to that of FTLD-Tau or AD (Figure 4C) reflecting the moderate sensitivity of our optimal cut-point. These patients were older on average compared to true-positive FTLD-TDP patients with CSF p-tau below our diagnostic cut-point, and focused analysis in pure sporadic FTLD patients younger than 65 at the time of CSF collection found increased diagnostic accuracy (Figure 5). Thus, we provide novel data using rare autopsy samples to demonstrate feasibility for diagnostic use of CSF p-tau measurement in the majority of FTLD patients whom are young at onset with pure pathology and sporadic disease. Indeed, ~70% of all clinical FTD has an age of onset younger than 6548. Since our focus was on the relationship between ante mortem CSF p-tau to post mortem FTLD tau pathology we did not include a replication cohort and autopsy-confirmed CSF data is extremely rare; however, previous studies consisting largely of living patients with clinical phenotypes predictive of molecular pathology in FTLD7 found a similar or higher performance of low CSF p-tau or ratio of p-tau to t-tau to differentiate FTLD-TDP from FTLD-Tau17–19. Our pure sporadic FTLD-TDP group included patients with clinical ALS with varying levels of cognitive impairment (Table 1) which could have influenced our findings; however, the pure sporadic ALS/ALS-FTLD patients were younger than pure sporadic FTLD-TDP patients without clinical ALS by an average of ~14 years (data not shown) so we cannot dissociate the effects of aging and clinical ALS in the current FTLD-TDP autopsy sample. We previously found that non-autopsied ALS patients had lower p-tau levels and lower p-tau:t-tau ratio but similar t-tau levels compared to FTLD-Tau and controls17, while others find similar p-tau levels and higher CSF t-tau levels in ALS compared to FTLD-TDP or controls.49,37 Further, we also found similar levels of CSF t-tau (Table 1) and the ratio of p-tau:t-tau (data not shown) between the FTLD-Tau and FTLD-TDP group, while others have found higher CSF t-tau in FTLD-TDP compared to FTLD-Tau18, 19. Lack of autopsy data and differences in demographics and mutation status may contribute to these discrepancies between studies. Indeed, we provide here novel tissue validation for CSF p-tau, and not t-tau, for tau pathology in FTLD. Thus, we contend that low CSF p-tau may be associated with TDP-43 proteinopathies, that are characterized by very low tau pathology, especially in younger patients. Further work using prospective autopsy-confirmed FTLD with homogenous genetic backgrounds will help elucidate the complex interactions of CSF tau and underlying molecular neuropathology in FTLD and replicate diagnostic accuracy prior to clinical use of CSF p-tau to identify TDP-43 proteinopathies.
Several additional limitations to this study should be kept in mind when considering our data. First, referral bias of atypical or aggressive disease for an autopsy cohort in a tertiary center could limit generalization for clinical use in the general dementia clinic population. We did not include normal control data because the focus of this work was on autopsy-confirmed samples and CSF samples from autopsy-confirmed controls are exceedingly rare. Indeed, the high-prevalence of AD-related pathology in the aging population, even in the presence of normal cognition,50 likely would influence CSF p-tau levels based on our quantitative pathology data here, necessitating autopsy-confirmed samples to exclude control patients with pre-symptomatic AD tau pathology and obtain true normative non-pathogenic levels of CSF t-tau and p-tau.
With these caveats in mind, we provide here novel experimental data to suggest that low CSF p-tau levels may be useful as a biomarker to differentiate FTLD-TDP from FTLD-Tau in patients with pure sporadic FTLD pathology. There is need for FTLD-specific biomarkers that could be used in conjunction with CSF p-tau to help predict underlying neuropathology in clinical FTD, which is urgently needed for clinical trials.
Acknowledgments
We would like to thank Felicia Cooper, Jackson Kwok and Mendy Liang for their technical assistance and the patients and caregivers whom contributed to this research. This study was supported by NIH grants AG038490, AG010124, NS053488, AG032953, AG017586, AG043503, NS088341, Penn Institute on Aging and the Wyncote Foundation.
Footnotes
AUTHOR CONTRIBITIONS
Concept and design (DJI, AL, CTM, MG); data acquisition and analysis (DJI, AL, SXX, DAW, EBL, VMV, LMS, JQT, MG); and drafting the manuscript and figures (DJI, AL, CTM, SXX, MG).
POTENTIAL CONFLICTS OF INTEREST
None.
References
- 1.Shaw LM, Vanderstichele H, Knapik-Czajka M, et al. Cerebrospinal fluid biomarker signature in Alzheimer’s disease neuroimaging initiative subjects. Annals of neurology. 2009 Apr;65(4):403–13. doi: 10.1002/ana.21610. [DOI] [PMC free article] [PubMed] [Google Scholar]
- 2.Tapiola T, Alafuzoff I, Herukka SK, et al. Cerebrospinal fluid {beta}-amyloid 42 and tau proteins as biomarkers of Alzheimer-type pathologic changes in the brain. Archives of neurology. 2009 Mar;66(3):382–9. doi: 10.1001/archneurol.2008.596. [DOI] [PubMed] [Google Scholar]
- 3.Buerger K, Ewers M, Pirttila T, et al. CSF phosphorylated tau protein correlates with neocortical neurofibrillary pathology in Alzheimer’s disease. Brain : a journal of neurology. 2006 Nov;129(Pt 11):3035–41. doi: 10.1093/brain/awl269. [DOI] [PubMed] [Google Scholar]
- 4.Otto M, Wiltfang J, Tumani H, et al. Elevated levels of tau-protein in cerebrospinal fluid of patients with Creutzfeldt-Jakob disease. Neuroscience letters. 1997 Apr 11;225(3):210–2. doi: 10.1016/s0304-3940(97)00215-2. [DOI] [PubMed] [Google Scholar]
- 5.Ost M, Nylen K, Csajbok L, et al. Initial CSF total tau correlates with 1-year outcome in patients with traumatic brain injury. Neurology. 2006 Nov 14;67(9):1600–4. doi: 10.1212/01.wnl.0000242732.06714.0f. [DOI] [PubMed] [Google Scholar]
- 6.Hesse C, Rosengren L, Vanmechelen E, et al. Cerebrospinal fluid markers for Alzheimer’s disease evaluated after acute ischemic stroke. Journal of Alzheimer’s disease : JAD. 2000 Nov;2(3–4):199–206. doi: 10.3233/jad-2000-23-402. [DOI] [PubMed] [Google Scholar]
- 7.Irwin DJ, Cairns NJ, Grossman M, et al. Frontotemporal lobar degeneration: defining phenotypic diversity through personalized medicine. Acta neuropathologica. 2015 Dec 31;129(4):469–91. doi: 10.1007/s00401-014-1380-1. [DOI] [PMC free article] [PubMed] [Google Scholar]
- 8.Irwin DJ, McMillan CT, Toledo JB, et al. Comparison of cerebrospinal fluid levels of tau and Abeta 1-42 in Alzheimer disease and frontotemporal degeneration using 2 analytical platforms. Archives of neurology. 2012 Aug;69(8):1018–25. doi: 10.1001/archneurol.2012.26. [DOI] [PMC free article] [PubMed] [Google Scholar]
- 9.Toledo JB, Brettschneider J, Grossman M, et al. CSF biomarkers cutoffs: the importance of coincident neuropathological diseases. Acta neuropathologica. 2012 Jul;124(1):23–35. doi: 10.1007/s00401-012-0983-7. [DOI] [PMC free article] [PubMed] [Google Scholar]
- 10.Mackenzie IR, Baker M, Pickering-Brown S, et al. The neuropathology of frontotemporal lobar degeneration caused by mutations in the progranulin gene. Brain : a journal of neurology. 2006 Nov;129(Pt 11):3081–90. doi: 10.1093/brain/awl271. [DOI] [PubMed] [Google Scholar]
- 11.Whitwell JL, Weigand SD, Boeve BF, et al. Neuroimaging signatures of frontotemporal dementia genetics: C9ORF72, tau, progranulin and sporadics. Brain : a journal of neurology. 2012 Mar;135(Pt 3):794–806. doi: 10.1093/brain/aws001. [DOI] [PMC free article] [PubMed] [Google Scholar]
- 12.Forman M, Trojanoswki JQ, Lee VM-Y. In: Hereditary Tauopathies and Idiopathic Frontotemporal Dementias. 2. Esiri M, Lee VM-Y, JQT, editors. Cambridge, UK: Cambridge University Press; 2004. [Google Scholar]
- 13.Whitwell JL, Boeve BF, Weigand SD, et al. Brain atrophy over time in genetic and sporadic frontotemporal dementia: a study of 198 serial magnetic resonance images. European journal of neurology : the official journal of the European Federation of Neurological Societies. 2015 May;22(5):745–52. doi: 10.1111/ene.12675. [DOI] [PMC free article] [PubMed] [Google Scholar]
- 14.Irwin DJ, McMillan CT, Brettschneider J, et al. Cognitive decline and reduced survival in C9orf72 expansion frontotemporal degeneration and amyotrophic lateral sclerosis. Journal of neurology, neurosurgery, and psychiatry. 2013 Feb;84(2):163–9. doi: 10.1136/jnnp-2012-303507. [DOI] [PMC free article] [PubMed] [Google Scholar]
- 15.Mackenzie IR, Arzberger T, Kremmer E, et al. Dipeptide repeat protein pathology in C9ORF72 mutation cases: clinico-pathological correlations. Acta neuropathologica. 2013 Dec;126(6):859–79. doi: 10.1007/s00401-013-1181-y. [DOI] [PubMed] [Google Scholar]
- 16.Irwin DJ, Trojanowski JQ, Grossman M. Cerebrospinal fluid biomarkers for differentiation of frontotemporal lobar degeneration from Alzheimer’s disease. Frontiers in aging neuroscience. 2013;5:6. doi: 10.3389/fnagi.2013.00006. [DOI] [PMC free article] [PubMed] [Google Scholar]
- 17.Grossman M, Elman L, McCluskey L, et al. Phosphorylated tau as a candidate biomarker for amyotrophic lateral sclerosis. JAMA neurology. 2014 Apr;71(4):442–8. doi: 10.1001/jamaneurol.2013.6064. [DOI] [PMC free article] [PubMed] [Google Scholar]
- 18.Hu WT, Watts K, Grossman M, et al. Reduced CSF p-Tau181 to Tau ratio is a biomarker for FTLD-TDP. Neurology. 2013 Nov 26;81(22):1945–52. doi: 10.1212/01.wnl.0000436625.63650.27. [DOI] [PMC free article] [PubMed] [Google Scholar]
- 19.Borroni B, Benussi A, Archetti S, et al. Csf p-tau181/tau ratio as biomarker for TDP pathology in frontotemporal dementia. Amyotrophic lateral sclerosis & frontotemporal degeneration. 2015 Mar;16(1–2):86–91. doi: 10.3109/21678421.2014.971812. [DOI] [PubMed] [Google Scholar]
- 20.Irwin DJ, Byrne MD, McMillan CT, et al. Semi-Automated Digital Image Analysis of Pick’s Disease and TDP-43 Proteinopathy. The journal of histochemistry and cytochemistry : official journal of the Histochemistry Society. 2016 Jan;64(1):54–66. doi: 10.1369/0022155415614303. [DOI] [PMC free article] [PubMed] [Google Scholar]
- 21.Toledo JB, Van Deerlin VM, Lee EB, et al. A platform for discovery: The University of Pennsylvania Integrated Neurodegenerative Disease Biobank. Alzheimer’s & dementia : the journal of the Alzheimer’s Association. 2014 Jul;10(4):477–84e1. doi: 10.1016/j.jalz.2013.06.003. [DOI] [PMC free article] [PubMed] [Google Scholar]
- 22.Montine TJ, Phelps CH, Beach TG, et al. National Institute on Aging-Alzheimer’s Association guidelines for the neuropathologic assessment of Alzheimer’s disease: a practical approach. Acta neuropathologica. 2012 Jan;123(1):1–11. doi: 10.1007/s00401-011-0910-3. [DOI] [PMC free article] [PubMed] [Google Scholar]
- 23.Hamilton RL. Lewy bodies in Alzheimer’s disease: a neuropathological review of 145 cases using alpha-synuclein immunohistochemistry. Brain pathology. 2000 Jul;10(3):378–84. doi: 10.1111/j.1750-3639.2000.tb00269.x. [DOI] [PMC free article] [PubMed] [Google Scholar]
- 24.Hu WT, Josephs KA, Knopman DS, et al. Temporal lobar predominance of TDP-43 neuronal cytoplasmic inclusions in Alzheimer disease. Acta neuropathologica. 2008 Aug;116(2):215–20. doi: 10.1007/s00401-008-0400-4. [DOI] [PMC free article] [PubMed] [Google Scholar]
- 25.Irwin DJ, Brettschneider J, McMillan CT, et al. Deep clinical and neuropathological phenotyping of Pick disease. Annals of neurology. 2016 Feb;79(2):272–87. doi: 10.1002/ana.24559. [DOI] [PMC free article] [PubMed] [Google Scholar]
- 26.Schmidt ML, Schuck T, Sheridan S, et al. The fluorescent Congo red derivative, (trans, trans)-1-bromo-2,5-bis-(3-hydroxycarbonyl-4-hydroxy)styrylbenzene (BSB), labels diverse beta-pleated sheet structures in postmortem human neurodegenerative disease brains. The American journal of pathology. 2001 Sep;159(3):937–43. doi: 10.1016/s0002-9440(10)61769-5. [DOI] [PMC free article] [PubMed] [Google Scholar]
- 27.Wang LS, Leung YY, Chang SK, et al. Comparison of xMAP and ELISA assays for detecting cerebrospinal fluid biomarkers of Alzheimer’s disease. Journal of Alzheimer’s disease : JAD. 2012;31(2):439–45. doi: 10.3233/JAD-2012-120082. [DOI] [PMC free article] [PubMed] [Google Scholar]
- 28.Fagan AM, Shaw LM, Xiong C, et al. Comparison of analytical platforms for cerebrospinal fluid measures of beta-amyloid 1-42, total tau, and p-tau181 for identifying Alzheimer disease amyloid plaque pathology. Archives of neurology. 2011 Sep;68(9):1137–44. doi: 10.1001/archneurol.2011.105. [DOI] [PMC free article] [PubMed] [Google Scholar]
- 29.Mercken M, Vandermeeren M, Lubke U, et al. Monoclonal antibodies with selective specificity for Alzheimer Tau are directed against phosphatase-sensitive epitopes. Acta neuropathologica. 1992;84(3):265–72. doi: 10.1007/BF00227819. [DOI] [PubMed] [Google Scholar]
- 30.Braak H, Alafuzoff I, Arzberger T, Kretzschmar H, Del Tredici K. Staging of Alzheimer disease-associated neurofibrillary pathology using paraffin sections and immunocytochemistry. Acta neuropathologica. 2006 Oct;112(4):389–404. doi: 10.1007/s00401-006-0127-z. [DOI] [PMC free article] [PubMed] [Google Scholar]
- 31.Armstrong RA. Quantifying the pathology of neurodegenerative disorders: quantitative measurements, sampling strategies and data analysis. Histopathology. 2003 Jun;42(6):521–9. doi: 10.1046/j.1365-2559.2003.01601.x. [DOI] [PubMed] [Google Scholar]
- 32.Armstrong RA, Cairns NJ, Lantos PL. Laminar distribution of pick bodies, pick cells and Alzheimer disease pathology in the frontal and temporal cortex in Pick’s disease. Neuropathology and applied neurobiology. 1999 Aug;25(4):266–71. doi: 10.1046/j.1365-2990.1999.00173.x. [DOI] [PubMed] [Google Scholar]
- 33.Irwin DJ, Cohen TJ, Grossman M, et al. Acetylated tau, a novel pathological signature in Alzheimer’s disease and other tauopathies. Brain : a journal of neurology. 2012 Mar;135(Pt 3):807–18. doi: 10.1093/brain/aws013. [DOI] [PMC free article] [PubMed] [Google Scholar]
- 34.Wood EM, Falcone D, Suh E, et al. Development and Validation of Pedigree Classification Criteria for Frontotemporal Lobar Degeneration. JAMA neurology. 2013 Sep 30;70(11):1141–47. doi: 10.1001/jamaneurol.2013.3956. [DOI] [PMC free article] [PubMed] [Google Scholar]
- 35.Brettschneider J, Del Tredici K, Irwin DJ, et al. Sequential distribution of pTDP-43 pathology in behavioral variant frontotemporal dementia (bvFTD) Acta neuropathologica. 2014 Mar;127(3):423–39. doi: 10.1007/s00401-013-1238-y. [DOI] [PMC free article] [PubMed] [Google Scholar]
- 36.Raftery AE. Bayesian Model Selection in Social Research. Sociological Methodology. 1995;25:111–63. [Google Scholar]
- 37.Pijnenburg YA, Verwey NA, van der Flier WM, Scheltens P, Teunissen CE. Discriminative and prognostic potential of cerebrospinal fluid phosphoTau/tau ratio and neurofilaments for frontotemporal dementia subtypes. Alzheimers Dement (Amst) 2015 Dec;1(4):505–12. doi: 10.1016/j.dadm.2015.11.001. [DOI] [PMC free article] [PubMed] [Google Scholar]
- 38.Mattsson N, Zetterberg H, Hansson O, et al. CSF biomarkers and incipient Alzheimer disease in patients with mild cognitive impairment. JAMA : the journal of the American Medical Association. 2009 Jul 22;302(4):385–93. doi: 10.1001/jama.2009.1064. [DOI] [PubMed] [Google Scholar]
- 39.Mitchell TW, Mufson EJ, Schneider JA, et al. Parahippocampal tau pathology in healthy aging, mild cognitive impairment, and early Alzheimer’s disease. Annals of neurology. 2002 Feb;51(2):182–9. doi: 10.1002/ana.10086. [DOI] [PubMed] [Google Scholar]
- 40.Dickson D, editor. Sporadic Tauopaties: Pick’s disease, corticobasal degeneration, progressive supranuclear palsy and argyrophilic grain disease. 2. NY, NY: Cambridge University Press; 2004. [Google Scholar]
- 41.Guillozet-Bongaarts AL, Garcia-Sierra F, Reynolds MR, et al. Tau truncation during neurofibrillary tangle evolution in Alzheimer’s disease. Neurobiology of aging. 2005 Jul;26(7):1015–22. doi: 10.1016/j.neurobiolaging.2004.09.019. [DOI] [PubMed] [Google Scholar]
- 42.Berry RW, Sweet AP, Clark FA, et al. Tau epitope display in progressive supranuclear palsy and corticobasal degeneration. J Neurocytol. 2004 May;33(3):287–95. doi: 10.1023/B:NEUR.0000044190.96426.b9. [DOI] [PubMed] [Google Scholar]
- 43.Schmidt ML, Gur RE, Gur RC, Trojanowski JQ. Intraneuronal and extracellular neurofibrillary tangles exhibit mutually exclusive cytoskeletal antigens. Annals of neurology. 1988 Feb;23(2):184–9. doi: 10.1002/ana.410230212. [DOI] [PubMed] [Google Scholar]
- 44.Toledo JB, Xie SX, Trojanowski JQ, Shaw LM. Longitudinal change in CSF Tau and Abeta biomarkers for up to 48 months in ADNI. Acta neuropathologica. 2013 Nov;126(5):659–70. doi: 10.1007/s00401-013-1151-4. [DOI] [PMC free article] [PubMed] [Google Scholar]
- 45.Grossman M. Primary progressive aphasia: clinicopathological correlations. Nature reviews Neurology. 2010 Feb;6(2):88–97. doi: 10.1038/nrneurol.2009.216. [DOI] [PMC free article] [PubMed] [Google Scholar]
- 46.Johnson KA, Minoshima S, Bohnen NI, et al. Appropriate use criteria for amyloid PET: a report of the Amyloid Imaging Task Force, the Society of Nuclear Medicine and Molecular Imaging, and the Alzheimer’s Association. Alzheimer’s & dementia : the journal of the Alzheimer’s Association. 2013 Jan;9(1):e-1, 16. doi: 10.1016/j.jalz.2013.01.002. [DOI] [PMC free article] [PubMed] [Google Scholar]
- 47.Johnson KA, Schultz A, Betensky RA, et al. Tau positron emission tomographic imaging in aging and early Alzheimer disease. Annals of neurology. 2016 Jan;79(1):110–9. doi: 10.1002/ana.24546. [DOI] [PMC free article] [PubMed] [Google Scholar]
- 48.Knopman DS, Roberts RO. Estimating the number of persons with frontotemporal lobar degeneration in the US population. Journal of molecular neuroscience : MN. 2011 Nov;45(3):330–5. doi: 10.1007/s12031-011-9538-y. [DOI] [PMC free article] [PubMed] [Google Scholar]
- 49.Wilke C, Deuschle C, Rattay TW, Maetzler W, Synofzik M. Total tau is increased, but phosphorylated tau not decreased, in cerebrospinal fluid in amyotrophic lateral sclerosis. Neurobiology of aging. 2015 Feb;36(2):1072–4. doi: 10.1016/j.neurobiolaging.2014.10.019. [DOI] [PubMed] [Google Scholar]
- 50.Bennett DA, Schneider JA, Arvanitakis Z, et al. Neuropathology of older persons without cognitive impairment from two community-based studies. Neurology. 2006 Jun 27;66(12):1837–44. doi: 10.1212/01.wnl.0000219668.47116.e6. [DOI] [PubMed] [Google Scholar]