

Abstract
Background:
Chronic stress contributes to increased risks of atherosclerotic diseases including heart disease, stroke, and transient ischemic attack. However, its underline mechanisms are poorly understood. This study aimed to elucidate the mechanism via which chronic stress exerts its effect on atherosclerosis (AS).
Methods:
Fifty male New Zealand white rabbits were used. Aortic balloon-injury model was applied. Both social stress and physical stress methods were adopted to establish chronic stress models. The lumen stenotic degree, intimal and medial areas, maximum fibrous cap thickness, and plaque contents were measured with histological sections. Proteomic methods were applied to detect protein changes in abdominal aortas to identify the specialized mediators. Real-time reverse transcription-polymerase chain reaction was used for further verification and investigation.
Results:
The stress rabbits exhibited lower body weight, worse fur state, more inactivity behavior, and higher serum cortisol level. Chronic stress was significantly associated with the decreased medial area and increased plaque instability, which was manifested by thinner fibrous caps, larger lipid cores, more macrophages, and new vessels but fewer smooth muscle cells and elastic fibers. After chronic stress, the apoptosis-related genes UBE2K, BAX, FAS, Caspase 3, Caspase 9, and P53 were upregulated, and BCL-2/BAX was down-regulated; the angiogenesis-related genes ANG and VEGF-A were also highly expressed in atherosclerotic arteries.
Conclusions:
Rabbit models of chronic stress were successfully established by applying both social stress and physical stress for 8 weeks. Chronic stress can reduce AS tunica media and accelerate plaque instability by promoting apoptosis and neovascularization.
Keywords: Atherosclerosis, Chronic Stress, Plaque Stability, Rabbit Model, Tunica Media
INTRODUCTION
Research has shown chronic stress may promote the development of atherosclerosis (AS) and increase the risk of cardiovascular events and incident stroke.[1,2] Meanwhile, a positive and stable social environment may slow down the progression of AS.[3] A correlation among glucocorticoid, chronic inflammation, and chronic-stress-induced AS has been documented.[4,5] However, most of these experiments used mice (especially apoE-/-mice) as animal models and mainly focused on the effects of stress on total lesion areas rather than on atherosclerotic vascular wall or plaque stability.[6]
In human beings, the unstable atherosclerotic plaques are most responsible for the risk of acute atherothrombotic events.[7] To explore the effects of chronic stress on plaque stability, animal model with the same human plaque features should be used. Since rabbits are feasible for research on AS in terms of lipid metabolism[8] and closely resembling plaque,[9] we planned to establish a chronic stress model in New Zealand white rabbits.
The effect of chronic stress on AS involves multiple and complex pathways. Therefore, identification of novel targets requires a further understanding of the differentially expressed proteins in the atherosclerotic artery wall with or without chronic stress. The changed proteins may be linked with chronic-stress-induced structural changes in arterial wall and advanced vulnerable lesions.
Accordingly, we aimed to investigate the effects of chronic stress on abdominal AS and to explain the possible mechanisms in rabbit chronic stress models. The impacts of chronic stress including social stress and physical stress were assessed on behavioral, neuroendocrine, lipid metabolism, inflammation, and AS plaque characteristics. Moreover, given that the chronic stress has been shown to affect AS progress, we also used proteomics for further mechanism study.
METHODS
Animals, groups, and diets
The experimental protocol was approved by the Animal Care and Use Committee of the Institute of Laboratory Animal Sciences, Chinese Academy of Medical Sciences and Peking Union Medical College. All efforts were made to reduce pain and minimize suffering during the procedures.
Fifty male New Zealand white rabbits (2.5 months old, about 2.5 kg) were obtained from the institute. All animals were housed in individual cages (50 cm × 40 cm × 40 cm) and maintained in standard conditions of temperature (22 ± 1°C), relative humidity (60%), and a 12-h light/dark cycle (lights on at 07:00 a.m.).
After one week of acclimation, the rabbits were randomly divided into four groups: control group (Control group, n = 10), fed with standard rabbit chow (0% cholesterol); chronic stress group (Chronic Stress group, n = 10), fed with standard diet and given chronic stress for 8 weeks; balloon-injury operation plus high fat diet (HFD) model group (Operation + HFD group, n = 15), in which balloon-injury operation was combined with a high-fat diet (6% bean oil and 1% cholesterol) for 8 weeks; and balloon-injury operation plus a high-fat diet plus chronic stress group (Operation + HFD + Chronic Stress group, n = 15), receiving operation, high-fat diet, and 8-week chronic stress. Water was ad libitum, and cabbages were provided once a week.
Aortic balloon-injury model
After the rabbit was anesthetized with sodium pentobarbital (30 mg/kg) through marginal ear vein, a longitudinal incision was performed in the right groin, and the femoral artery was isolated. A 3 mm × 20 mm balloon catheter was advanced into the abdominal artery, inflated with 10 atm, and then, gently denuded three times. The procedures were performed under sterile conditions. Before being placed in their cages, the animals were allowed to recover under observation. In the first five days after surgery, benzylpenicillin sodium was administered by intramuscular injection at a dose of 40,000 U per day. The animals were provided with a normal chow diet for 4 weeks, followed by a high-fat diet for 8 weeks.[9]
Chronic stress procedures and assessments of chronic stress model
Stress is defined as a threatened state provoked by physiologic, psychological, or environmental stressors.[10] As there is no standard stress procedure for rabbits, we adopted both social stress (referred to as unstable social environment model) and physiologic stress (referred to as rat chronic unpredicted mild stress model, CUMS) methods [Table 1]. These two stress groups (Chronic Stress group and Operation + HFD + Chronic Stress group) were assigned in a separate room to avoid interfering the non-stress groups (Control group and Operation + HFD group). To reduce gastrointestinal injuries, stress manipulation was conducted after feeding, at least half an hour later.
Table 1.
Chronic stress procedures
| Methods | Time | |||||
|---|---|---|---|---|---|---|
| Monday | Tuesday | Wednesday | Thursday | Friday | Saturday | |
| Social stress | 4 h | 4 h | 4 h | 4 h | 4 h | 4 h |
| Physical stress | ||||||
| Overnight illumination | 12 h | – | – | – | – | – |
| White noise (80 db) | – | 2 h | – | – | – | – |
| Stroboscopic illumination | – | – | 2 h | – | – | – |
| Foot shock (1 mA) | – | – | – | 5 times | – | – |
–: Not available.
Social stress procedures: animals were paired together in one cage for 4 hours per day and the pairings were exchanged within the own groups every week, forcing rabbits to continually reestablish social relationships.[3] The time that rabbits in other cage (as intruder) and in home cage during the entire experiments should be balanced.
Physical stress procedures: continuous overnight illumination, 2 h of white noise (a tone of 80 dB), and 2 h of high-intensity stroboscopic illumination (300 flashes/min) were selected separately at different days. To reduce habituation, one-foot shock (1mA) was added (several seconds/time, five times in total).[11] The stress regime was started at the end of week 4 and lasted for 8 weeks.
The rabbits were carefully inspected after stress exposure. The fur scoring was recorded to reflect the basic health status (referred to as the standard of mouse).[12] To obtain the information on the impact of the stressors on animal behavior in natural state, all rabbits were recorded for 10 min on video, between 8:00 a.m. and 9:00 a.m. before the rabbits began eating. The video was recorded 3–4 times every week. The individual behavioral assessment of the same group was summed to provide a total score of each 4-week stress period.
Fur score: 1 point represents clean, shiny, and tidy fur; 2 points represent dull and irregular fur, with a few minor wounds; 3 points represent less hair fur, more marked with minor wounds; and 4 points represent lack of hair, ruffled fur, with several minor wounds. Rabbits with obvious wounding were excluded from the study.
Behavior score: it was observed that rabbit behaviors were mainly classified into inactivity, locomotor, grooming, and drinking. Inactivity was defined as rabbits sitting or huddling quietly in the cage. Locomotor behaviors comprised of cage exploration, walking, stretching out, and reacting to the other rabbits in the same room. Grooming behavior included licking their paws and using their paws to wipe and wash their face, ears, trunk, or hindquarters.[13] The behavioral activity of the 4 categories for each rabbit was scored as the percentage of 10-min observation period. The total percentage time in each group was calculated every 4 weeks after stress exposure (at week 8 and 12).
Blood sampling and biochemical assays
Rabbit blood samples were obtained from the central ear artery between 7:00 a.m. and 9:00 a.m. every 4 weeks, after 12 h of fasting. The serum samples separated by centrifugation at 4°C were stored in aliquots at −80°C.
The concentrations of total cholesterol (TC), triglyceride (TG), low-density lipoprotein (LDL), and high-density lipoprotein (HDL) were measured by an automated analyzer (Beckman, USA). High-sensitivity C-reactive protein (hs-CRP) was measured by enhanced immunoturbidimetric assay. Cortisol and interleukin-6 (IL-6) were measured by commercially available enzyme-linked immunosorbent assay (ELISA) kits (R and D Systems, Minneapolis, MN, USA).
Histomorphometric methods and measures
After being euthanized with ketamine hydrochloride, the whole abdominal aorta was removed and then evenly cut into four segments. Two of these parts (near iliac artery) were embedded in Tissue-Tek OCT compound (Sakura, Tokyo, Japan) for frozen sectioning and the others were snap-frozen in liquid nitrogen for proteomic analysis. The bilateral adrenal glands were removed and weighed, expressed as a percentage of body weight.
Serial 6-μm-thick sections were collected on slides and visualized by hematoxylin and eosin (H and E staining), Oil red O, and Verhoeff–Van Gieson (VVG) staining. Immunohistochemical staining was conducted with primary antibodies, comprising mouse anti-CD68 (ab31630, Abcam), human α-smooth muscle actin (1A4, Sigma), and mouse anti-CD31 (ab199012, Abcam).
After slicing, the remaining embedded vessels (about 3 mm) were placed in normal saline for gross examination using stereoscopic microscope (Axio Zoom V16, ZEISS, Germany). Planimetry was measured on digitized images with ×40 magnification of H & E stained sections. Intimal area was calculated by subtracting the luminal area from the area bounded by internal elastic lamina, and medial area was calculated by subtracting the area within the internal elastic lamina from the area bounded by external elastic lamina, using ZEN software (ZEISS Microsystems).
The fibrous caps, the lipid contents (determined as red in Oil red O staining), and the amounts of macrophages, smooth muscle cells (SMCs), and new vessels (determined as brown signals) were observed under light microscopy (BX51, OLYMPUS, Japan). IMAGEPRO PLUS was used to quantify maximum fibrous cap thickness, and plaque contents, indicated as ratios (%) of the positive area/intimal area. Elastic fibers were determined as dark violet or black in VVG staining. The thickness of the fibrous cap was measured at the thickest portion of the cap. Mean values were calculated by areas measured on 2 parts (6 replicates for each section) per artery.
Proteomics
To explore the possible mechanisms, we used isobaric tags for relative and absolute quantification (iTRAQ) techniques combined with multidimensional liquid chromatography-tandem mass spectrometry (LC-MS/MS) analysis to perform a quantitative proteomic analysis. Equal quality of abdominal aortic tissues within the same group (Control, Operation + HFD, and Operation + HFD + Chronic Stress groups) were mixed and ground in liquid nitrogen and lysed using protein extraction buffer. iTRAQ (AB Sciex, USA) with different reporter ions were applied as isobaric tags for relative quantification. The LC-MS/MS analysis was carried out using Q Exactive mass spectrometer (Thermo Scientific, USA). Proteome Discoverer software (Thermo Scientific, USA, version 1.4) was used to perform database searching against the NCBI's RefSeq rabbit protein sequence database using the Sequest algorithms.
Real-time reverse transcription-polymerase chain reaction
Total RNA from abdominal aortic tissues was extracted using TRIzol reagent according to standard protocols. Primers are listed in Table 2. Reverse transcription-polymerase chain reaction (RT-PCR) was performed in ABI QuantStudio 7 Flex Real-Time PCR system (Applied Biosystems, Foster City, CA, USA). Actin was used as the internal housekeeping gene. The relative level of the target gene was calculated using the formula of 2−Δc (average ct of target gene − average ct of housekeeping gene). Then, the target gene levels in Operation + HFD and Operation + HFD + Chronic Stress groups were normalized against the Control group.
Table 2.
Primers for real time PCR
| Gene | Forward | Reverse | GenBank number |
|---|---|---|---|
| BAX | 5’-TCCTCTCCTACTTCGGGACC-3’ | 5’-AGTAAGAAAAACGCCTGTGTCC-3’ | XM_002723696.3 |
| BCL2 | 5’-TTTTTCAACAGAGCGGTGCG-3’ | 5’-CGCTCTACCAGAGAACAGGC-3’ | XM_008261439.2 |
| UBE2K | 5’-TTCCGTCACAGGGGCTATTT-3’ | 5’-GCATCTTGTGGGTCATCTGG-3’ | XM_002709395.3 |
| CASP3 | 5’-GGTAGCGACAGAGTTCGAGT-3’ | 5’-TGAGAGGGAAGCAGAGTAACAG-3’ | XM_008273924.2 |
| CASP9 | 5’-TGTTTCCGAGCGAGGGATTT-3’ | 5’-CGCAGGAAGGTTTTGGGGTA-3’ | XM_008249762.2 |
| p53 | 5’-ATGCCTACCTCACGGGGTCT-3’ | 5’-AGGGTAGGGAACCAGCACCAT-3’ | NM_001082404.1 |
| FAS | 5’-CTTTGCACGGGTTGTTGGTA-3’ | 5’-TGGTAGGGAGAGGGGCTTAT-3’ | NM_001081995.1 |
| ANG | 5’-AGCTCTGTGTGGATCTGACAA-3’ | 5’-TGCCTGTAGTTTCAGTCCTTT-3’ | XM_002718039.3 |
| VEGF-A | 5’-ATGCGGATCAAACCTCACCA-3’ | 5’-TTTCGTTTTTGCCCCTTGCC-3’ | XM_017345155.1 |
| TSP-1 | 5’-TGGCGGTAGACTAGGGATGT-3’ | 5’-CCCATCGTTCCAGAAGGTGC-3’ | XM_002717799.3 |
| ACTIN | 5’-TGGCTCTAACAGTCCGCCTAG-3’ | 5’-AGTGCGACGTGGACATCCG-3’ | NM_001101683.1 |
PCR: Polymerase chain reaction; BAX: Bcl-2 Associated X Protein; UBE2K: Ubiquitin-conjugating enzyme E2 K; CASP: Cysteinyl aspartate specific proteinase 3; ANG: Angiogenin; VEGF-A: Vascular endothelial growth factor-A; TSP-1: Thrombospondin-1.
Statistical analyses
The results are expressed as the mean ± standard error (SE). Statistical analyses were performed using SPSS 20.0 software (IBM Corp., USA). Statistical significance was determined by Student's t-test when two groups were compared. One-factor analysis of variance followed by LSD or Dunnett's test was chosen when four groups were compared. Statistical significance was considered if the P < 0.05.
RESULTS
Assessments of chronic stress model
All animals were weighed at week 0 (baseline), week 4, week 8, and week 12. At baseline and week 4, the body weight showed no significant difference among four groups. There was no significant difference in weight gain before and after stress exposure in Operation + HFD + Chronic Stress group, which might be explained by the effect of the operation. However, in Chronic Stress group, the weight gains, during the first and second 4 weeks with stress procedures, were both decreased compared to weight increment without stress (t = −4.365, P = 0.002; t = −3.942, P = 0.003). At week 12, the mean animal weight was significantly lower in Operation + HFD + Chronic Stress group than in Operation + HFD group (F (3, 41) = 1.845, P = 0.026 [Figure 1a]).
Figure 1.

Assessments of chronic stress model. (a) Body weight. *P < 0.05 compared with Operation + HFD group. (b) Fur score. At week 8, *P < 0.001, ‡P < 0.001 compared with Control group; †P < 0.001 compared with Chronic Stress group; §P < 0.001 compared with Operation + HFD group. At week 12, *P < 0.001, ‡P < 0.001 compared with Control group; †P < 0.001 compared with Chronic Stress group; §P < 0.001 compared with Operation + HFD group. (c) Behavior assessments. At week 8, *P < 0.01, compared with Control group; †P < 0.001 compared with Control group, ‡P < 0.05 compared with Operation + HFD group; §P < 0.01 compared with Chronic Stress group. At week 12, *P < 0.01, †P < 0.001 compared with Control group, ‡P < 0.05 compared with Operation + HFD group; §P < 0.01 compared with Control group, ||P < 0.01 compared with Operation + HFD group; ¶P < 0.05, **P < 0.01 compared with Control group; ††P < 0.05 compared with Operation + HFD group. (d) Serum cortisol. At week 8, *P < 0.001, ††P < 0.001 compared with Control group, †P < 0.001, §P < 0.01 compared with Chronic Stress group, ||P < 0.01 compared with Operation + HFD group. At week 12, *P < 0.001, ‡P < 0.001 compared with Control group, †P < 0.001, §P < 0.001 compared with Chronic Stress group. (e) Adrenal weight/body weight. *P < 0.001, ††P < 0.001 compared with Control group, †P < 0.001, §P < 0.001 compared with Chronic Stress group. Data are shown as mean ± SE. and were analyzed by one-way analysis of variance. (Control group, n=9; Chronic Stress group, n=9; Operation+HFD group, n=14; Operation+HFD+Chronic Stress group, n=11).
A higher fur score reflects worse basic state. At week 8 and week 12, animals exposed to chronic stress got higher fur score than two groups without stress exposure [P < 0.001, Figure 1b].
The stress groups developed insignificantly heavier inactivity behavior than the non-stress groups at week 8; however, there was significantly decreased locomotor behavior in Operation + HFD + Chronic Stress group (vs. Operation + HFD group, F (3, 111) =6.277, P = 0.017). At week 12, the stress groups developed significantly heavier inactivity behavior than the non-stress groups (Chronic Stress vs. Control; Operation + HFD + Chronic Stress vs. Operation + HFD; F (3, 157) = 8.955, P = 0.002, P = 0.016). The grooming behavior was decreased in Chronic Stress group (F (3, 157) = 3.697, P = 0.032). However, it was not significantly increased in Operation + HFD + Chronic Stress group, suggesting that grooming behavior may be too variable to reflect behavioral differences after chronic tress [Figure 1c].
At week 8, Operation + HFD + Chronic Stress group had significantly higher cortisol level than Operation + HFD group (F (3, 34) =56.82, P = 0.006); meanwhile, the Chronic Stress group displayed a nonsignificant increase relative to Control group. At week 12, however, the relative elevated cortisol level in stress groups fell a bit, which might reflect partial adaptation to stress [Figure 1d]; in addition, serum cortisol levels were higher in HFD groups, related to hyperlipidemia.
There were no significant differences in adrenal gland weight/body weight between stress groups and nonstress groups [Figure 1e].
Assessment of serum lipid profile
The mean serum TG ([2.270 ± 0.186] vs. [1.449 ± 0.253], t = 2.349, P = 0.027) and LDL ([20.385 ± 0.724] vs. [16.799 ± 1.058], t = 2.831, P = 0.009) levels in Operation + HFD + Chronic Stress group (vs. Operation + HFD group) were elevated at week 8. The mean serum TC ([43.987 ± 0.727] vs. [38.086 ± 2.569], t = 2.210, P = 0.037) and TG ([5.842 ± 0.722] vs. [3.858 ± 0.438], t = 2.349, P = 0.027) levels were significantly elevated in Operation + HFD + Chronic Stress group at week 12. There was no obvious change in HDL. Compared with Control group, the lipid metabolism showed no significant change after 8 weeks of chronic stress exposure in the Chronic Stress group [Figure 2a].
Figure 2.

Assessments of chronic stress on lipids, inflammation, stenotic degree, intimal area and medial area. (a) Serum lipid profiles. At week 8, *P < 0.05, †P < 0.01 compared with Operation + HFD group. At week 12, *P < 0.05, †P < 0.01 compared with Operation + HFD group. (b) Serum hs-CRP. At week 8, *P < 0.01 compared with Control group, †P < 0.05 compared with Chronic Stress group, ‡P < 0.05 compared with Operation + HFD group. At week 12, *P < 0.001 compared with Control group, †P < 0.05 compared with Operation + HFD group. (c) Serum IL-6. At week 8, *P < 0.01, †P < 0.001, §P < 0.001 compared with Control group; ‡P < 0.001, ||P < 0.001 compared with Chronic Stress group; ¶P < 0.05 compared with Operation+HFD group. At week 12, *P < 0.05, †P < 0.001, §P < 0.001 compared with Control group; ‡P < 0.001, ||P < 0.001 compared with Chronic Stress group; ¶P < 0.01 compared with Operation+HFD group. (d) Gross examination, ×40. (e) H & E staining, original magnification ×40. (f) Comparison of stenotic degree. *P < 0.001, ‡P < 0.001 compared with Control group; †P < 0.001, §P < 0.001 compared with Chronic Stress group. (g) Comparison of intimal area. *P < 0.001, ‡P < 0.001 compared with Control group; †P < 0.001, §P < 0.001 compared with Chronic Stress group. (h) Comparison of medial area. *P < 0.01 compared with Control group, †P < 0.001 compared with Chronic Stress group, ‡P < 0.05 compared with Operation + HFD group. (i) Comparison of intima/media area ratio. *P < 0.001, ‡P < 0.001 compared with Control group; †P < 0.001, §P < 0.001 compared with Chronic Stress group. Bars represent SE. Data were analyzed by one-way analysis of variance. (Control group, n = 9; Chronic Stress group, n = 9; Operation + HFD group, n = 11; Operation + HFD + Chronic Stress group, n = 8).
Assessment of serum high-sensitivity C-reactive protein and interleukin-6 levels
It has been demonstrated that many different forms of chronic stress were associated with inflammation.[14,15] At week 12, the serum CRP and IL-6 concentrations in Operation + HFD + Chronic Stress group were significantly higher than in Operation + HFD group [Figure 2b and 2c].
Assessment chronic stress on atherosclerosis stenotic degree, intimal area, and medial area
To evaluate structural changes, gross examination of abdominal aorta was performed by stereoscopic microscope. As shown in Figure 2d, operation combined with high-fat food treatment induced obvious AS plaques and artery wall expansion. Further quantitative analysis of H & E stained sections revealed no remarkable change in the degree of luminal stenosis, expressed as (1-lumen area/[intimal area + lumen area] ×100%) in both stress groups and nonstress groups [Figure 2e and 2f].
The intimal area was also unchanged, which was unexpected [Figure 2g]. However, compared with Operation + HFD group, the Operation + HFD + Chronic Stress group presented significantly decreased medial area [Figure 2h]. The ratio of intimal area/medial area changed insignificantly [Figure 2i].
Effect of chronic stress on atherosclerosis plaque stability
As shown in Figure 3a, the maximum cap thickness was selected from three measurements and calculated. The Operation + HFD + Chronic Stress group exhibited significantly thinner fibrous caps than the Operation + HFD group ([73.974 ± 8.144] vs. [120.920 ± 10.692], t = −3.193, P = 0.003), suggesting plaque vulnerability [Figure 3g].
Figure 3.
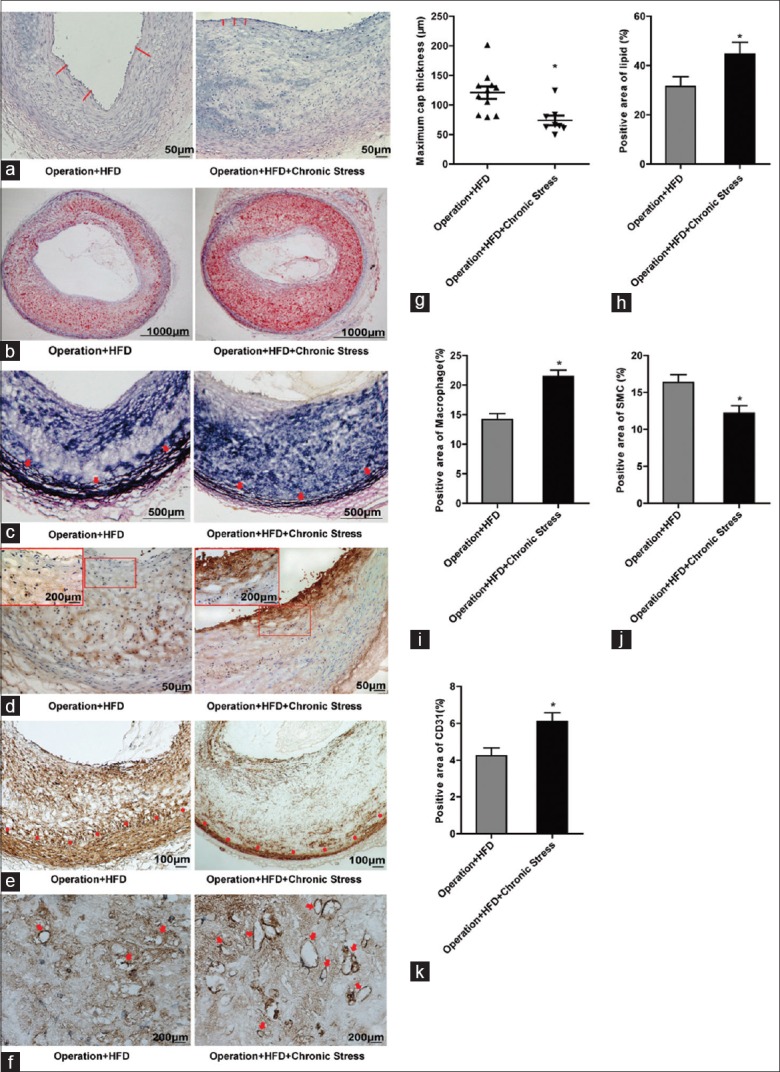
Assessments of chronic stress on plaque stability. (a) H & E staining for fibrous cap (red line), original magnification ×100. (b) Oil red O staining for lipid deposition, original magnification ×40. (c) Verhoeff–Van Gieson staining for elastic fiber (arrowhead, internal elastic lamina), original magnification ×100. (d) Immunostaining for macrophage marker CD68, original magnification ×100. Rectangle represents partial enlarged view, original magnification ×400. (e) Immunostaining for SMC (Dot, internal elastic lamina), original magnification ×100. (f) Immunostaining for new vessels (arrowhead), original magnification ×100. (g) Comparison of the maximum cap thickness, *P < 0.01. (h) Quantitative analyses of lipids, *P < 0.05. (i) Quantitative analyses of CD68, *P < 0.001. (j) Quantitative analyses of SMC, *P < 0.01. (k) Quantitative analyses of CD31, *P < 0.01. Bars represent SE. Data were analyzed by Student's t-test. (Operation + HFD group, n = 11; Operation + HFD + Chronic Stress group, n = 8).
More lipid-positive areas were found in Operation + HFD + Chronic Stress group than in Operation + HFD group [Figure 3b and 3h].
VVG staining revealed defective internal elastic lamina in Operation + HFD + Chronic Stress group. The elastic fiber layers were observed to be more substantial and integrated into the tunica media in the Operation + HFD [Figure 3c].
Immunohistochemical staining showed significantly increased amount of macrophage-rich areas in intima, especially near the fibrous caps, in Operation + HFD + Chronic Stress group [Figure 3d and 3i].
Immunohistochemical staining showed significantly decreased amount of SMC-rich area in intima in the Operation + HFD + Chronic Stress group [Figure 3e and 3j]. In addition, the amount of SMCs was reduced in media, indicating that chronic stress accelerated the degrading medial smooth muscle.
Effect of chronic stress on cell apoptosis
In three groups (Control, Operation + HFD, and Operation + HFD + Chronic Stress groups), 444 differentially expressed proteins (≥1.5-fold change) were identified in a total of 3684 proteins. Compared with Operation + HFD group, after stress, there were 63 up-regulated and 29 downregulated proteins [Supplementary Table 1]. The results of pathway analysis of the upregulated proteins are shown in Figure 4a.
Supplementary Table 1.
Proteomics show the differential expression proteins in operation + HFD + chronic stress group when compared with operation + HFD group
| Accession | Description | Operation + HFD + chronic stress group/operation + HFD group |
|---|---|---|
| 291411929 | Predicted: ATP synthase subunit g, mitochondrial (O. cuniculus) | 4128.734 |
| 655889416 | Predicted: Glycogen synthase kinase-3 alpha, partial (O. cuniculus) | 1159.396 |
| 291395631 | Predicted: Histone H2B type 1 (O. cuniculus) | 1054.544 |
| 291409112 | Predicted: Erlin-2 (O. cuniculus) | 1054.078 |
| 655878391 | Predicted: 60S ribosomal protein L35 (O. cuniculus) | 929.745 |
| 655879926 | Predicted: Histone-binding protein RBBP4 (O. cuniculus) | 916.680 |
| 291391146 | Predicted: V-type proton ATPase subunit F (O. cuniculus) | 829.562 |
| 655839882 | Predicted: Histone H2B type 1-B (O. cuniculus) | 734.800 |
| 291390555 | Predicted: Heat shock factor-binding protein 1 (O. cuniculus) | 608.791 |
| 655859728 | Predicted: Nebulette isoform X2 (O. cuniculus) | 423.510 |
| 291404220 | Predicted: Eukaryotic translation initiation factor 4E-binding protein 2 (O. cuniculus) | 403.829 |
| 291403459 | Predicted: Angiogenin (O. cuniculus) | 348.576 |
| 655884244 | Predicted: Serum amyloid A-4 protein-like isoform X2 (O. cuniculus) | 339.668 |
| 655861225 | Predicted: Receptor-type tyrosine-protein phosphatase C isoform X5 (O. cuniculus) | 301.419 |
| 655830476 | Predicted: Serine/threonine-protein kinase 38-like isoform X4 (O. cuniculus) | 296.165 |
| 655846531 | Predicted: Chromatin target of PRMT1 protein isoform X5 (O. cuniculus) | 234.743 |
| 291397378 | Predicted: ATP-binding cassette subfamily F member 2 (O. cuniculus) | 224.269 |
| 291413675 | Predicted: Fructosamine-3-kinase (O. cuniculus) | 223.281 |
| 291396345 | Predicted: Ammonium transporter Rh type A (O. cuniculus) | 169.990 |
| 655859026 | Predicted: Low quality protein: Selenide, water dikinase 1 (O. cuniculus) | 78.302 |
| 655835923 | Predicted: Band 4.1-like protein 3 isoform X30 (O. cuniculus) | 41.487 |
| 291415261 | Predicted: Pyridoxal kinase (O. cuniculus) | 35.611 |
| 291396976 | Predicted: Syntaxin-7 (O. cuniculus) | 31.425 |
| 126722836 | Complement component C8 gamma chain precursor (O. cuniculus) | 29.150 |
| 655854442 | Predicted: Low quality protein: Profilin-2 (O. cuniculus) | 27.553 |
| 291408940 | Predicted: Integral membrane protein 2B (O. cuniculus) | 27.449 |
| 291396339 | Predicted: Methylmalonyl-CoA mutase, mitochondrial (O. cuniculus) | 26.848 |
| 655853086 | Predicted: Schwannomin-interacting protein 1 isoform X4 (O. cuniculus) | 25.985 |
| 291391482 | Predicted: Rab3 GTPase-activating protein catalytic subunit isoform X2 (O. cuniculus) | 25.936 |
| 655903053 | Predicted: AH receptor-interacting protein (O. cuniculus) | 25.411 |
| 291406912 | Predicted: Protein phosphatase 1F (O. cuniculus) | 25.166 |
| 284005108 | Inactive rhomboid protein 1 (O. cuniculus) | 24.739 |
| 291394851 | Predicted: 40S ribosomal protein S17 (O. cuniculus) | 24.610 |
| 291385675 | Predicted: Ubiquitin-conjugating enzyme E2 K (O. cuniculus) | 23.543 |
| 291388964 | Predicted: D-tyrosyl-tRNA (Tyr) deacylase 1 (O. cuniculus) | 22.811 |
| 655871476 | Predicted: Membrane primary amine oxidase-like (O. cuniculus) | 22.715 |
| 655835965 | Predicted: EMILIN-2 (O. cuniculus) | 22.411 |
| 291398138 | Predicted: D-3-phosphoglycerate dehydrogenase (O. cuniculus) | 22.262 |
| 655604166 | Predicted: Low quality protein: Cathepsin F (O. cuniculus) | 21.431 |
| 655869908 | Predicted: Ankyrin repeat and FYVE domain-containing protein 1 (O. cuniculus) | 21.316 |
| 291415948 | Predicted: Epiplakin (O. cuniculus) | 21.074 |
| 291408920 | Predicted: Tubulointerstitial nephritis antigen-like (O. cuniculus) | 18.701 |
| 291394602 | Predicted: Peptidyl-prolyl cis-trans isomerase FKBP14 (O. cuniculus) | 16.238 |
| 655896783 | Predicted: Nuclear factor 1 X-type (O. cuniculus) | 15.021 |
| 291398563 | Predicted: Transcription initiation factor IIB (O. cuniculus) | 14.417 |
| 655838304 | Predicted: Endoplasmic reticulum aminopeptidase 1 isoform X2 (O. cuniculus) | 14.254 |
| 291384137 | Predicted: Protein Hikeshi isoform X1 (O. cuniculus) | 12.425 |
| 291398326 | Predicted: Glutathione S-transferase Yb-3 (O. cuniculus) | 12.368 |
| 291392588 | Predicted: WW domain-binding protein 11 (O. cuniculus) | 10.834 |
| 655715562 | Predicted: Receptor-type tyrosine-protein phosphatase alpha (O. cuniculus) | 10.586 |
| 291398429 | Predicted: Lipoamide acyltransferase component of branched-chain alpha-keto acid dehydrogenase complex, mitochondrial (O. cuniculus) | 9.410 |
| 655828146 | Predicted: SEC14 domain and spectrin repeat-containing protein 1 (O. cuniculus) | 9.249 |
| 655875803 | Predicted: Low quality protein: Coiled-coil domain-containing protein 22 (O. cuniculus) | 8.909 |
| 655898897 | Predicted: Kynurenine-oxoglutarate transaminase 1 isoform X5 (O. cuniculus) | 8.695 |
| 655842122 | Predicted: Unconventional myosin-VI isoform X5 (O. cuniculus) | 8.309 |
| 126723431 | Niemann-Pick C1 protein precursor (O. cuniculus) | 6.097 |
| 291414997 | Predicted: Apoptosis regulator BAX isoform X2 (O. cuniculus) | 6.008 |
| 655893680 | Predicted: Myelin basic protein (O. cuniculus) | 2.772 |
| 655603017 | Predicted: Low quality protein: Transmembrane protease serine 13-like (O. cuniculus) | 2.150 |
| 655845739 | Predicted: Myelin protein P0 (O. cuniculus) | 2.052 |
| 655740408 | Predicted: Peripherin (O. cuniculus) | 1.955 |
| 655877309 | Predicted: Myelin proteolipid protein isoform X1 (O. cuniculus) | 1.674 |
| 655881879 | gdp | 1.605 |
| 291408454 | Predicted: 26S proteasome non-ATPase regulatory subunit 5 (O. cuniculus) | 0.666 |
| 291403258 | Predicted: Thrombospondin-1 (O. cuniculus) | 0.659 |
| 655851215 | Predicted: ER membrane protein complex subunit 1 isoform X5 (O. cuniculus) | 0.654 |
| 126723743 | Sex hormone-binding globulin precursor (O. cuniculus) | 0.647 |
| 291405213 | Predicted: Platelet glycoprotein Ib alpha chain (O. cuniculus) | 0.643 |
| 655898355 | Predicted: Acidic leucine-rich nuclear phosphoprotein 32 family member A (O. cuniculus) | 0.642 |
| 655831559 | Predicted: Alpha-2-macroglobulin-like isoform X1 (O. cuniculus) | 0.636 |
| 655850855 | Predicted: PITH domain-containing protein 1 (O. cuniculus) | 0.630 |
| 655897691 | Predicted: Low quality protein: Cytohesin-2 (O. cuniculus) | 0.628 |
| 655835791 | Predicted: Ras-related protein Rab-31 (O. cuniculus) | 0.626 |
| 284005433 | Serpin B10 (O. cuniculus) | 0.622 |
| 126723213 | Tartrate-resistant acid phosphatase type 5 precursor (O. cuniculus) | 0.621 |
| 291389840 | Predicted: Glycosyltransferase 8 domain-containing protein 2 isoform X2 (O. cuniculus) | 0.618 |
| 655854509 | Predicted: Platelet glycoprotein V (O. cuniculus) | 0.603 |
| 291411025 | Predicted: Syntaxin-4 (O. cuniculus) | 0.603 |
| 126723155 | Decorin precursor (O. cuniculus) | 0.595 |
| 655887741 | Predicted: Low quality protein: Syntaxin-binding protein 2 (O. cuniculus) | 0.589 |
| 930841416 | Hemoglobin subunit beta-1/2 isoform 1 (O. cuniculus) | 0.587 |
| 655900718 | Predicted: Fermitin family homolog 3 (O. cuniculus) | 0.583 |
| 126723523 | Platelet microbicidal protein 1 precursor (O. cuniculus) | 0.582 |
| 655841265 | Predicted: Trem-like transcript 1 protein (O. cuniculus) | 0.573 |
| 148224174 | UDPglucuronosyltransferase 1-6 precursor (O. cuniculus) | 0.551 |
| 126722759 | Hemoglobin subunit alpha-1/2 (O. cuniculus) | 0.536 |
| 655846515 | Predicted: Protein S100-A1 (O. cuniculus) | 0.516 |
| 291409859 | Predicted: Protein NipSnap homolog 1 (O. cuniculus) | 0.512 |
| 291391299 | Predicted: cAMP-dependent protein kinase type II-beta regulatory subunit (O. cuniculus) | 0.446 |
| 655882729 | Predicted: Cytochrome b-c1 complex subunit Rieske, mitochondrial (O. cuniculus) | 0.431 |
| 655850387 | Predicted: Peptidyl-prolyl cis-trans isomerase E isoform X1 (O. cuniculus) | 0.342 |
| 126723706 | Haptoglobin precursor (O. cuniculus) | 0.309 |
O. cuniculus: Oryctolagus cuniculus; HFD: High fat diet.
Figure 4.

Chronic stress-induced plaque instability associate with increased apoptosis and angiogenin. (a) Enriched functions associated to the chronic stress to AS (the top 10 pathway). (b) BAX protein level. (c) UBE2K protein level. (d) BAX mRNA expression. *P < 0.01, †P < 0.01 compared with Control group; ‡P < 0.001 compared with Operation + HFD group. (e) UBE2K mRNA expression. *P < 0.05, †P < 0.01 compared with Control group; ‡P < 0.01 compared with Operation + HFD group. (f) The ratio of Bcl-2/BAX. *P < 0.001, †P < 0.001 compared with Control group; ‡P < 0.01 compared with Operation + HFD group. (g) FAS mRNA expression. *P < 0.05 compared with Control group; †P < 0.05 compared with Operation + HFD group. (h) Caspse3 mRNA expression. *P < 0.05 compared with Control group; †P < 0.05 compared with Operation + HFD group. (i) Caspase9 mRNA expression. *P < 0.001, †P < 0.001 compared with Control group; ‡P < 0.001 compared with Operation + HFD group. (j) P53 mRNA expression. *P < 0.05, †P < 0.001 compared with Control group; ‡P < 0.001 compared with Operation + HFD group. (k) Angiogenin protein level. (l) ANG mRNA expression. *P < 0.001, †P < 0.01 compared with Control group; ‡P < 0.001 compared with Operation + HFD group. (m) VEGF-A mRNA expression. *P < 0.001 compared with Control group; †P < 0.001 compared with Operation + HFD group. (n) TSP-1 mRNA expression. *P < 0.05 compared with Control group.
From the top 10 pathways, we proposed the apoptosis pathway and lysosome pathway played key roles in stress-mediated medial area reduction. In the high-expression variant proteins, the relative quantity of apoptosis regulator Bcl-2 Associated X Protein (BAX) and ubiquitin-conjugating enzyme E2 K (UBE2K) was increased by 23.5 folds and 6.0 folds, respectively [Figure 4b and 4c]. Real-time RT-PCR was performed for further verification and investigation. The outcomes showed that, after stress, the apoptosis-related genes BAX, UBE2K, FAS, cysteinyl aspartate-specific proteinase 3 (Caspase 3), Caspase 9, and P53 were upregulated by 2.2 folds [P < 0.001, Figure 4d], 2.0 folds [P = 0.002, Figure 4e], 3.2 folds [P = 0.011, Figure 4g], 2.9 folds [P = 0.040, Figure 4h], 1.4 folds [P < 0.001, Figure 4i], and 1.6 folds [P < 0.001, Figure 4j]. BCL-2/BAX was downregulated by 0.6 fold [P = 0.008, Figure 4f].
Effect of chronic stress on neovascularization
Compared with the Operation + HFD group, the protein angiogenin (ANG) in the Operation + HFD + Chronic Stress group was increased by 348.6 folds [Figure 4k]. The expressions of proangiogenic genes ANG and vascular endothelial growth factor-A (VEGF-A) increased by 2.2 folds each [Figure 4l and 4m]. The expression of thrombospondin-1 (TSP-1), an antiangiogenesis gene, showed no significant change [Figure 4n].
Immunohistochemical staining showed that the number of new vessels marked with CD31 in AS plaques was increased after stress exposure [Figure 3f and 3k].
DISCUSSION
Rabbits have rarely been used as an animal model for stress, which is primarily based on rodents. In our current study, we attempted to establish and evaluate a chronic stress model in rabbits and then analyze the effect of chronic stress on AS in terms of artery wall and plaque stability. Both social and physical stress methods were used during modeling to mimic various stimulations in human beings and reduce adaptation. Physical stress used in our study included noise and strobe light rather than swimming in 4°C cold water or damp sawdust. It was found that exposure to both social and physical stress for 8 weeks in rabbits induce body weight loss, worse fur status, exaggerated inactivity behavior, and increased serum cortisol level. In addition, the results showed that chronic stress promoted lipid metabolism disturbance and inflammation, which was consistent with the previous findings.[6,16]
Chronic stress may aggravate AS development, as determined by measuring the total lesion areas.[3] However, few literature has explored the effect of chronic stress on artery structure and plaque stability. We have discovered that chronic stress played a passive role in atherosclerotic media. It is paradoxical that stress may induce media thickening as the sympathetic nervous system can be activated repeatedly on stress exposure. However, in our current study, the vascular SMC layers of atherosclerotic abdominal artery were reduced obviously. There are several reasons as follows: first, compared with abdominal artery, heart ventricle and aortic artery are mainly involved in the increased blood pressure caused by sympathetic overactivation; second, the proliferation and degradation of SMCs are dynamic; and third, chronic stress may prominently promote medial degeneration by accelerating apoptosis.
In our current study, chronic stress increased plaque vulnerability to rupture, characterized with thinner fibrous caps, larger lipid cores, more macrophages and new vessels but less SMCs and elastic fibers. Thus, chronic stress may not induce larger plaque areas but advanced atherosclerotic lesions. Then, how did chronic stress influence AS plaque stability? The level of inflammation and oxidative stress, which can be aggravated by chronic stress, has been proved to be related with the destabilization of atherosclerotic plaque.[17,18] To further elucidate the pathogenesis, the differentially expressed proteins might provide valuable information. In our current study, we focused on the apoptosis and angiogenesis.
Ubiquitin-proteasome system is the principal degradation route of proteins in eukaryotic cell, playing a crucial role in the regulation of apoptosis.[19] BAX is an important apoptosis regulator, and its excessive expression can adversely affect the protective effect of the BCL-2, causing cell apoptosis.[20] FAS, expressed on SMC membrane surface, can combine its ligand FASL to transduce death signal and further activate caspase cascade. Caspase 9 mainly involves in apoptosis starting. Caspase 3 is the main effect factor in the process of apoptosis, and its activation signs the irreversible phase of cell apoptosis. P53 can down-regulate BCL-2/BAX to promote apoptosis.[21] The excessive expressions of genes after stress exposure indicated that chronic stress promoted the apoptosis of AS vascular cells.
The imbalance between proliferation and apoptosis of SMCs is a key factor in occurrence and development of AS.[22] The increased macrophage apoptosis results in severer plaque burden in more advanced lesions.[23,24] In this study, the SMC contents in intima and the SMC layers in media were reduced significantly. Thus, stress may promote the apoptosis of SMCs, although further investigation is still required.
Angiogenin, a soluble protein and also one of the most potent angiogenic factors, plays a key role in the growth of new capillaries.[25] Several studies have suggested that plasma angiogenin level is remarkably increased in patients with the acute coronary syndrome. Angiogenin may promote AS and lead to the destabilization of atherosclerotic plaque by activating proteases and promoting intralesional angiogenesis.[25,26] However, the potential effect of chronic stress on angiogenesis has not been validated.
VEGF family is the most commonly known factor in promoting angiogenesis.[27] VEGF-A, as an important member, may promote intimal hyperplasia and aggravate atheroslerosis by promoting monocyte activation, adhesion, and migration and increasing endothelial cell permeability.[28] TSP-1 could be expressed in the case of increased angiogenesis, however, the result is not the case, considering that chronic stress compromises the ability of blood vessels to maintain homeostasis. In our current study, the number of new vessels was obviously elevated in the Operation + HFD + Chronic Stress group. Therefore, it is concluded that chronic stress may promote angiogenesis and adversely affect plaque stability.
In conclusions, This study established a chronic stress model in rabbits and then concluded that chronic stress-induced atherosclerotic media reduction and destabilized atherosclerotic lesions, probably by promoting SMCs apoptosis and angiogenesis in plaques.
Supplementary information is linked to the online version of the paper on the Chinese Medical Journal website.
Financial support and sponsorship
This work was supported by a grant from National Natural Science Foundation of China (No. 31271097).
Conflicts of interest
There are no conflicts of interest.
Footnotes
Edited by: Yi Cui
REFERENCES
- 1.Everson-Rose SA, Roetker NS, Lutsey PL, Kershaw KN, Longstreth WT, Jr, Sacco RL, et al. Chronic stress, depressive symptoms, anger, hostility, and risk of stroke and transient ischemic attack in the multi-ethnic study of atherosclerosis. Stroke. 2014;45:2318–23. doi: 10.1161/STROKEAHA.114.004815. doi: 10.1161/STROKEAHA.114.004815. [DOI] [PMC free article] [PubMed] [Google Scholar]
- 2.Henderson KM, Clark CJ, Lewis TT, Aggarwal NT, Beck T, Guo H, et al. Psychosocial distress and stroke risk in older adults. Stroke. 2013;44:367–72. doi: 10.1161/STROKEAHA.112.679159. doi: 10.1161/STROKEAHA.112.679159. [DOI] [PMC free article] [PubMed] [Google Scholar]
- 3.McCabe PM, Gonzales JA, Zaias J, Szeto A, Kumar M, Herron AJ, et al. Social environment influences the progression of atherosclerosis in the watanabe heritable hyperlipidemic rabbit. Circulation. 2002;105:354–9. doi: 10.1161/hc0302.102144. [DOI] [PubMed] [Google Scholar]
- 4.Tang YL, Jiang JH, Wang S, Liu Z, Tang XQ, Peng J, et al. TLR4/NF-κB signaling contributes to chronic unpredictable mild stress-induced atherosclerosis in apoe-/-mice. PLoS One. 2015;10:e0123685. doi: 10.1371/journal.pone.0123685. doi: 10.1371/journal.pone.0123685. [DOI] [PMC free article] [PubMed] [Google Scholar]
- 5.Wang S, Xiaoling G, Pingting L, Shuqiang L, Yuaner Z. Chronic unpredictable mild stress combined with a high-fat diets aggravates atherosclerosis in rats. Lipids Health Dis. 2014;13:77. doi: 10.1186/1476-511X-13-77. doi: 10.1186/1476-511X-13-77. [DOI] [PMC free article] [PubMed] [Google Scholar]
- 6.Tang YL, Jiang JH, Wang S, Liu Z, Tang XQ, Peng J, et al. TLR4/NF-κB signaling contributes to chronic unpredictable mild stress-induced atherosclerosis in apoE-/-mice. PLoS One. 2015;10:e0123685. doi: 10.1371/journal.pone.0123685. doi: 10.1371/journal.pone.0123685. [DOI] [PMC free article] [PubMed] [Google Scholar]
- 7.Fredman G, Hellmann J, Proto JD, Kuriakose G, Colas RA, Dorweiler B, et al. An imbalance between specialized pro-resolving lipid mediators and pro-inflammatory leukotrienes promotes instability of atherosclerotic plaques. Nat Commun. 2016;7:12859. doi: 10.1038/ncomms12859. doi: 10.1038/ncomms12859. [DOI] [PMC free article] [PubMed] [Google Scholar]
- 8.Fan J, Kitajima S, Watanabe T, Xu J, Zhang J, Liu E, et al. Rabbit models for the study of human atherosclerosis: From pathophysiological mechanisms to translational medicine. Pharmacol Ther. 2015;146:104–19. doi: 10.1016/j.pharmthera.2014.09.009. doi: 10.1016/j.pharmthera.2014.09.009. [DOI] [PMC free article] [PubMed] [Google Scholar]
- 9.Okabe T, Hoshiga M, Negoro N, Nakakoji T, Arishiro K, Ishihara T, et al. Rabbit plaque models closely resembling lesions in human coronary artery disease. Int J Cardiol. 2011;147:271–7. doi: 10.1016/j.ijcard.2009.09.528. doi: 10.1016/j.ijcard.2009.09.528. [DOI] [PubMed] [Google Scholar]
- 10.Black PH, Garbutt LD. Stress, inflammation and cardiovascular disease. J Psychosom Res. 2002;52:1–23. doi: 10.1016/s0022-3999(01)00302-6. doi: 10.1016/S0022-3999(01)00302-6. [DOI] [PubMed] [Google Scholar]
- 11.Rabasa C, Muñoz-Abellán C, Daviu N, Nadal R, Armario A. Repeated exposure to immobilization or two different footshock intensities reveals differential adaptation of the hypothalamic-pituitary-adrenal axis. Physiol Behav. 2011;103:125–33. doi: 10.1016/j.physbeh.2011.02.022. doi: 10.1016/j.physbeh.2011.02.022. [DOI] [PubMed] [Google Scholar]
- 12.Savignac HM, Hyland NP, Dinan TG, Cryan JF. The effects of repeated social interaction stress on behavioural and physiological parameters in a stress-sensitive mouse strain. Behav Brain Res. 2011;216:576–84. doi: 10.1016/j.bbr.2010.08.049. doi: 10.1016/j.bbr.2010.08.049. [DOI] [PubMed] [Google Scholar]
- 13.Aloyo VJ, Dave KD. Behavioral response to emotional stress in rabbits: Role of serotonin and serotonin2A receptors. Behav Pharmacol. 2007;18:651–9. doi: 10.1097/FBP.0b013e3282effc0d. doi: 10.1097/FBP.0b013e3282effc0d. [DOI] [PubMed] [Google Scholar]
- 14.Cohen S, Janicki-Deverts D, Doyle WJ, Miller GE, Frank E, Rabin BS, et al. Chronic stress, glucocorticoid receptor resistance, inflammation, and disease risk. Proc Natl Acad Sci U S A. 2012;109:5995–9. doi: 10.1073/pnas.1118355109. doi: 10.1073/pnas.1118355109. [DOI] [PMC free article] [PubMed] [Google Scholar]
- 15.Bernberg E, Ulleryd MA, Johansson ME, Bergström GM. Social disruption stress increases IL-6 levels and accelerates atherosclerosis in apoE-/- mice. Atherosclerosis. 2012;221:359–65. doi: 10.1016/j.atherosclerosis.2011.11.041. doi: 10.1016/j.atherosclerosis.2011.11.041. [DOI] [PubMed] [Google Scholar]
- 16.Kiecolt-Glaser JK, Preacher KJ, MacCallum RC, Atkinson C, Malarkey WB, Glaser R, et al. Chronic stress and age-related increases in the proinflammatory cytokine IL-6. Proc Natl Acad Sci U S A. 2003;100:9090–5. doi: 10.1073/pnas.1531903100. doi: 10.1073/pnas.1531903100. [DOI] [PMC free article] [PubMed] [Google Scholar]
- 17.Nation DA, Gonzales JA, Mendez AJ, Zaias J, Szeto A, Brooks LG, et al. The effect of social environment on markers of vascular oxidative stress and inflammation in the watanabe heritable hyperlipidemic rabbit. Psychosom Med. 2008;70:269–75. doi: 10.1097/PSY.0b013e3181646753. doi: 10.1097/PSY.0b013e3181646753. [DOI] [PubMed] [Google Scholar]
- 18.Legein B, Temmerman L, Biessen EA, Lutgens E. Inflammation and immune system interactions in atherosclerosis. Cell Mol Life Sci. 2013;70:3847–69. doi: 10.1007/s00018-013-1289-1. doi: 10.1007/s00018-013-1289-1. [DOI] [PMC free article] [PubMed] [Google Scholar]
- 19.Perego P. The ubiquitin proteasome system as a source of drug targets for cancer therapy. Curr Pharm Des. 2013;19:4024. doi: 10.2174/1381612811319220011. doi: 10.2174/1381612811319220011. [DOI] [PubMed] [Google Scholar]
- 20.Misao J, Hayakawa Y, Ohno M, Kato S, Fujiwara T, Fujiwara H, et al. Expression of bcl-2 protein, an inhibitor of apoptosis, and bax, an accelerator of apoptosis, in ventricular myocytes of human hearts with myocardial infarction. Circulation. 1996;94:1506–12. doi: 10.1161/01.cir.94.7.1506. [DOI] [PubMed] [Google Scholar]
- 21.Miyashita T, Krajewski S, Krajewska M, Wang HG, Lin HK, Liebermann DA, et al. Tumor suppressor p53 is a regulator of bcl-2 and bax gene expression in vitro and in vivo. Oncogene. 1994;9:1799–805. [PubMed] [Google Scholar]
- 22.Clarke MC, Littlewood TD, Figg N, Maguire JJ, Davenport AP, Goddard M, et al. Chronic apoptosis of vascular smooth muscle cells accelerates atherosclerosis and promotes calcification and medial degeneration. Circ Res. 2008;102:1529–38. doi: 10.1161/CIRCRESAHA.108.175976. doi: 10.1161/CIRCRESAHA.108.175976. [DOI] [PubMed] [Google Scholar]
- 23.Linton MF, Babaev VR, Huang J, Linton EF, Tao H, Yancey PG, et al. Macrophage apoptosis and efferocytosis in the pathogenesis of atherosclerosis. Circ J. 2016;80:2259–68. doi: 10.1253/circj.CJ-16-0924. doi: 10.1253/circj.CJ-16-0924. [DOI] [PMC free article] [PubMed] [Google Scholar]
- 24.Gautier EL, Huby T, Witztum JL, Ouzilleau B, Miller ER, Saint-Charles F, et al. Macrophage apoptosis exerts divergent effects on atherogenesis as a function of lesion stage. Circulation. 2009;119:1795–804. doi: 10.1161/CIRCULATIONAHA.108.806158. doi: 10.1161/CIRCULATIONAHA.108.806158. [DOI] [PubMed] [Google Scholar]
- 25.Kręcki R, Krzemińska-Pakuła M, Drożdż J, Szcześniak P, Peruga JZ, Lipiec P, et al. Relationship of serum angiogenin, adiponectin and resistin levels with biochemical risk factors and the angiographic severity of three-vessel coronary disease. Cardiol J. 2010;17:599–606. [PubMed] [Google Scholar]
- 26.Moreno PR, Purushothaman KR, Fuster V, Echeverri D, Truszczynska H, Sharma SK, et al. Plaque neovascularization is increased in ruptured atherosclerotic lesions of human aorta: Implications for plaque vulnerability. Circulation. 2004;110:2032–8. doi: 10.1161/01.CIR.0000143233.87854.23. doi: 10.1161/01.CIR.0000143233.87854.23. [DOI] [PubMed] [Google Scholar]
- 27.Leung DW, Cachianes G, Kuang WJ, Goeddel DV, Ferrara N. Vascular endothelial growth factor is a secreted angiogenic mitogen. Science. 1989;246:1306–9. doi: 10.1126/science.2479986. [DOI] [PubMed] [Google Scholar]
- 28.Bhardwaj S, Roy H, Heikura T, Ylä-Herttuala S. VEGF-A, VEGF-D and VEGF-D (DeltaNDeltaC) induced intimal hyperplasia in carotid arteries. Eur J Clin Invest. 2005;35:669–76. doi: 10.1111/j.1365-2362.2005.01555.x. doi: 10.1111/j.1365-2362.2005.01555.x. [DOI] [PubMed] [Google Scholar]