

Abstract
Most patients with nonalcoholic fatty liver disease (NAFLD) are overweight or obese. However, a significant proportion of patients have a normal body mass index (BMI), denoted as lean NAFLD. The long‐term prognosis of lean NAFLD is unclear. We conducted a cohort study of 646 patients with biopsy‐proven NAFLD. Patients were defined as lean (BMI < 25.0), overweight (BMI 25.0‐29.9), or obese (BMI ≥ 30.0) at the time of biopsy. Each case was matched for age, sex, and municipality to 10 controls. Overall mortality and development of severe liver disease were evaluated using population‐based registers. Cox regression models adjusted for age, sex, type 2 diabetes, and fibrosis stage were used to examine the long‐term risk of mortality and liver‐related events in lean and nonlean NAFLD. Lean NAFLD was seen in 19% of patients, while 52% were overweight and 29% were obese. Patients with lean NAFLD were older, had lower transaminases, lower stages of fibrosis, and lower prevalence of nonalcoholic steatohepatitis at baseline compared to patients with a higher BMI. During a mean follow‐up of 19.9 years (range 0.4‐40 years) representing 12,631 person years and compared to patients who were overweight, patients with lean NAFLD had no increased risk for overall mortality (hazard ratio 1.06; P = 0.73) while an increased risk for development of severe liver disease was found (hazard ratio 2.69; P = 0.007). Conclusion: Although patients with lean NAFLD have lower stages of fibrosis, they are at higher risk for development of severe liver disease compared to patients with NAFLD and a higher BMI, independent of available confounders. (Hepatology Communications 2018;2:48–57)
Abbreviations
- BMI
body mass index
- CI
confidence interval
- HCV
hepatitis C virus
- HR
hazard ratio
- NAFLD
nonalcoholic fatty liver disease
- NASH
nonalcoholic steatohepatitis
- NPR
Patient Register of Hospital Discharges
- PNPLA3
patatin‐like phospholipase domain‐containing 3
- T2DM
type 2 diabetes mellitus
Introduction
Nonalcoholic fatty liver disease (NAFLD) is the most common cause of chronic liver disease worldwide,1, 2, 3 affecting up to 25% of the global population.4 There is a strong association between obesity and NAFLD, and most patients with NAFLD have a body mass index (BMI) of ≥25 kg/m2, which is considered overweight or obese according to the World Health Organization.5 However, a subset of persons with NAFLD has a BMI below 25 kg/m2, usually denoted as lean NAFLD.6 The prevalence of lean NAFLD has been described in different populations and ranges from 12% to 20%.7, 8, 9, 10, 11, 12
Several studies have shown that patients with lean NAFLD have similar metabolic profiles to patients with NAFLD and a higher BMI,9, 11, 13, 14 although a recent large Italian study found a lower prevalence of metabolic alterations in lean NAFLD.15 Compared to lean controls without NAFLD, subjects with lean NAFLD have impaired glucose tolerance and a higher prevalence of the patatin‐like phospholipase domain‐containing 3 (PNPLA3) C/G or G/G genotype,16 known to be associated with steatosis.17 However, studies with histologic data and sufficient follow‐up time are lacking. Thus, the natural history of lean NAFLD remains unknown. An abstract from 201418 reported a paradoxically increased mortality for lean patients with NAFLD compared to patients with higher BMI, but no final report has been published. The most important risk factors for mortality and morbidity generally in NAFLD include age, type 2 diabetes, and higher stages of fibrosis,19, 20, 21 but it is unclear if this also applies to patients with lean NAFLD.
The overall aim of this study was to investigate the long‐term prognosis in a large cohort of patients with biopsy‐proven lean NAFLD with a prolonged follow‐up time. Specifically, we studied if overall mortality and liver‐specific morbidity differed compared to patients with a higher BMI and evaluated which risk factors best predicted future mortality in lean NAFLD.
Patients and Methods
SUBJECTS
We conducted a retrospective cohort study including all patients diagnosed with NAFLD by liver biopsy at the Karolinska University Hospital, Huddinge, and Linköping University Hospital from 1971 to 2009. The method for the creation of the study cohort and the main results have been published.22 Briefly, 646 patients with NAFLD who had undergone liver biopsy were included. We collected laboratory, clinical, and histologic data from the time of biopsy. Patients with other liver diseases or causes for steatosis were excluded.22 Presence of nonalcoholic steatohepatitis (NASH) was defined according to the fatty liver inhibition of progress (FLIP) algorithm23; the NAFLD activity score and fibrosis stage were graded according to Kleiner et al.24 by one pathologist (R.H.). We excluded 57 biopsies due to inadequate quality. All included biopsies had at least seven portal tracts. Unfortunately, the initial biopsy was missing in 69 cases and could not be scored for necroinflammatory changes (NAFLD activity score and presence of NASH). In these 69 cases, however, data on fibrosis stage were obtained from the initial pathology report.
Weight (in kilograms) and height (in centimeters) were objectively measured by hospital staff at the time of biopsy and were used to calculate BMI, expressed as kg/m2. Type 2 diabetes mellitus (T2DM) was defined as a registered diagnosis in patient charts, a nonfasting glucose value ≥180 mg/dL or a fasting glucose value of ≥126 mg/dL, or having any antidiabetic medication prescribed. Hypertension was defined as a registered diagnosis in patient charts, a resting blood pressure ≥140/90 mm Hg, or having any antihypertensive medication prescribed. Atherosclerotic cardiovascular disease was defined as having previous ischemic heart disease or known angina pectoris, a previous stroke, or intermittent claudication. Hyperlipidemia was defined as having any antilipidemic drug prescribed or a fasting total cholesterol value ≥240 mg/dL. Smoking was defined as being a current smoker or having smoked previously.
Patients were categorized into three groups based on BMI: < 25.0 (lean), 25.0‐29.9 (overweight), and ≥30 kg/m2 (obese). A flowchart for patient inclusion and exclusion is presented in Fig. 1. The regional ethics committees at Karolinska Institute and Linköping University approved this study (Dnr 2011/905‐31/2 and 2015/1591‐32).
Figure 1.
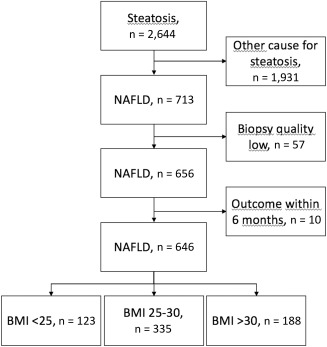
Study flowchart.
FOLLOW‐UP
The personal identification number is a unique 10‐digit code provided to all inhabitants in Sweden.25 The personal identification number was first used to create a control population derived from Statistics Sweden, using 10 controls per case (n = 6,345 after exclusions). Matching was performed for sex, age, and municipality at the time of biopsy. Patients and controls (n = 6,991) were then linked to national population‐based registers. We used outcome data from the National Patient Register of Hospital Discharges (NPR), the Cause of Death Register, and the Swedish Cancer Register. The validity of hospital discharge diagnoses obtained from the NPR is between 85%‐95% depending on diagnosis.26 The Cause of Death Register contains data regarding the causes of death of all inhabitants in Sweden, including if the person died abroad. It is mandatory for the responsible physician to report the underlying cause of death (e.g., hepatocellular carcinoma) and any disease that could have contributed to the death of the individual (e.g., liver cirrhosis). The Swedish Cancer Register contains data on verified solid and nonsolid tumors, irrespective of the diagnostic modality. The completeness of the register is around 96%.27
OUTCOMES
The registries were used to ascertain all causes of death and all cases of severe liver disease during follow‐up. Severe liver disease was defined as a diagnosis of decompensated liver disease, liver failure, hepatocellular carcinoma, or cirrhosis. A list of all International Classification of Diseases codes used to define the outcomes is presented in Supporting Table S1.
STATISTICAL ANALYSIS
Data are expressed as means with SD or as total numbers with percentages where applicable. The Kruskal‐Wallis test was used to examine differences in continuous parameters among the three groups, and the chi‐square test was used for categorical data. Cox regression models were used to estimate hazard ratios (HRs) for overall mortality and severe liver disease, respectively. When investigating development of severe liver disease, cases that died from any other cause were censored. For the comparison of cases with NAFLD against controls, the distribution of sex, age, and residence was balanced due to the matching. Thus, no further adjustments were made. Also, data on other variables were lacking in the control population.
A model that investigated within‐group differences in NAFLD cases was stratified on BMI category and used patients with BMI 25.0‐29.9 kg/m2 as the reference category. This was because we hypothesized that patients with BMI ≥30kg/m2 would be a higher risk for mortality and severe liver disease and would obtain false low estimates from the model if these were included in the reference category. The model was adjusted using two a priori defined models, the first being adjusted for age at biopsy, sex, and presence of T2DM and the second model further adjusted for fibrosis stage (0–4) at baseline.
Next, we investigated which parameters best predicted overall mortality in patients with lean NAFLD. As there were only 19 cases of severe liver disease in the lean NAFLD group, we did not specifically investigate this outcome in the analysis due to low power. A stepwise‐forward approach was used to identify potential parameters in the lean NAFLD group that were associated with overall mortality. We included the clinically most relevant parameters to reduce the possibility of a type 2 error. Parameters with P < 0.1 in univariate analysis were fitted to a multivariate analysis with overall mortality as the independent variable. The end of follow‐up was December 31, 2014, or time of event (whichever occurred first).
In the sensitivity analysis, we performed a competing risk regression28 for the outcome severe liver disease, using overall mortality other than liver disease as the competing risk. We excluded cases where hepatitis C virus (HCV) testing had not been performed during baseline or follow‐up. As development of T2DM might be different in patients across BMI categories and patients with T2DM are at an increased risk for severe liver disease, we next modelled incident diabetes as a time‐varying covariate. We then investigated the baseline characteristics of the cohort stratified on BMI category and whether or not severe liver disease developed. Stata 13 (StataCorp LP, College Station, TX) was used for all analyses.
Results
The cohort included 646 cases and consisted of 402 men (62.2%). Mean age at baseline was 48.2 (SD, 13.7) years, and mean BMI was 28.3 (SD, 4.0) kg/m2. A total of 123 patients (19.0%) had a BMI < 25.0 and were classified as lean NAFLD cases. Of these, only 2 had a BMI below 18.5 kg/m2, 1 with F0 and 1 with F3. Furthermore, 335 (51.9%) were overweight with a BMI between 25.0 and 29.9, and 188 patients (29.1%) were obese with a BMI ≥30.0 kg/m2. Baseline characteristics of the cohort, stratified on BMI category, are listed in Table 1. Of note, patients with lean NAFLD were older but had a lower mean fibrosis stage and lower prevalence of NASH, lower values of aspartate aminotransferase and alanine aminotransferase, and similar levels of total cholesterol but lower levels of triglycerides and fasting glucose.
Table 1.
Demographic, Clinical, and Histopathologic Characteristics of Study Subjects at Baseline
| Parameter | BMI < 25 (n = 123) | BMI 25.0‐29.9 (n = 335) | BMI ≥ 30.0 (n = 188) | P |
|---|---|---|---|---|
| NASH (yes, %) | 55 (50) | 190 (64.6) | 138 (79.8) | <0.001 |
| NAS (1‐8, SD) | 3.5 (1.8) | 4.3 (1.9) | 5.1 (1.9) | <0.001 |
| Fibrosis stage 0 (n, %) | 39 (31.7) | 89 (26.6) | 35 (18.6) | 0.002 |
| Fibrosis stage 1 (n, %) | 57 (46.3) | 122 (36.4) | 77 (41.0) | |
| Fibrosis stage 2 (n, %) | 15 (12.2) | 88 (26.3) | 46 (24.5) | |
| Fibrosis stage 3 (n, %) | 7 (5.7) | 25 (7.5) | 26 (13.8) | |
| Fibrosis stage 4 (n, %) | 5 (4.1) | 11 (3.3) | 4 (2.1) | |
| Steatosis grade 1 (n, %) | 63 (57.3) | 122 (41.4) | 43 (24.6) | <0.001 |
| Steatosis grade 2 (n, %) | 22 (20.0) | 72 (24.4) | 55 (31.4) | |
| Steatosis grade 3 (n, %) | 25 (22.7) | 101 (24.2) | 77 (44.0) | |
| Lobular inflammation 0 (n, %) | 11 (10.0) | 30 (10.2) | 11 (6.3) | <0.001 |
| Lobular inflammation 1 (n, %) | 64 (58.2) | 127 (43.1) | 54 (31.0) | |
| Lobular inflammation 2 (n, %) | 30 (27.3) | 111 (37.6) | 79 (45.4) | |
| Lobular inflammation 3 (n, %) | 5 (4.6) | 27 (9.2) | 30 (17.2) | |
| Ballooning 0 (n, %) | 55 (50.0) | 100 (34.0) | 34 (19.7) | <0.001 |
| Ballooning 1 (n, %) | 34 (30.9) | 104 (35.4) | 69 (39.9) | |
| Ballooning 2 (n, %) | 21 (19.1) | 90 (90.6) | 70 (40.5) | |
| Portal inflammation 0 (n, %) | 65 (59.1) | 128 (43.4) | 61 (35.1) | 0.002 |
| Portal inflammation 1 (n, %) | 31 (28.2) | 112 (38.0) | 83 (47.8) | |
| Portal inflammation 2 (n, %) | 14 (12.7) | 55 (18.4) | 30 (17.2) | |
| Hypertension (yes) (n, %) | 34 (27.6) | 98 (28.3) | 64 (34.0) | 0.40 |
| T2DM (yes) (n, %) | 7 (5.7) | 50 (14.9) | 36 (19.2) | 0.004 |
| Hyperlipidemia (yes) (n, %) | 10 (8.1) | 31 (9.3) | 16 (8.5) | 0.92 |
| Smoking (never) (n, %) | 62 (59.6) | 166 (55.2) | 88 (53.7) | 0.53 |
| Smoking (previous) (n, %) | 15 (14.4) | 66 (21.9) | 37 (22.6) | |
| Smoking (current) (n, %) | 27 (26.0) | 69 (22.9) | 39 (23.8) | |
| BMI (kg/m2, SD) | 23.1 (2.7) | 27.5 (1.4) | 33.2 (2.8) | <0.001 |
| Sex (male, %) | 71 (58) | 227 (68) | 104 (55) | 0.03 |
| Age (years, SD) | 51.4 (13.4) | 48.7 (13.2) | 45.2 (14.1) | <0.001 |
| AST (U/L, SD) | 44 (25) | 48 (31) | 58 (41) | <0.001 |
| ALT (U/L, SD) | 72 (47) | 79 (46) | 100 (62) | <0.001 |
| GGT (U/L, SD) | 144 (180) | 101 (113) | 100 (106) | 0.17 |
| ALP (U/L, SD) | 98 (59) | 87 (37) | 93 (52) | 0.14 |
| Bilirubin (mg/dL, SD) | 0.77 (0.69) | 0.69 (0.40) | 0.64 (0.29) | 0.41 |
| INR (SD) | 1.0 (0.1) | 1.0 (0.1) | 1.0 (0.1) | 0.02 |
| Albumin (g/L, SD) | 4.1 (0.5) | 4.2 (0.4) | 4.2 (0.4) | 0.47 |
| Creatinine (mg/dL, SD) | .97 (0.17) | 1.00 (0.19) | 0.95 (0.19) | 0.003 |
| Hemoglobin (g/dL, SD) | 14.6 (1.3) | 14.9 (1.2) | 14.9 (1.1) | 0.03 |
| Platelet count (x109, SD) | 251 (86) | 245 (71) | 248 (69) | 0.78 |
| Total cholesterol (mg/dL, SD) | 232 (55) | 232 (53) | 234 (56) | 0.99 |
| Triglycerides (mg/dL, SD) | 195 (177) | 206 (147) | 221 (119) | 0.002 |
| Fasting glucose (mg/dL, SD) | 98 (26) | 109 (42) | 112 (44) | 0.003 |
| Ferritin (µg/L, SD) | 180 (166) | 239 (269) | 269 (252) | 0.003 |
Data are presented per BMI category as mean values with SDs for continuous parameters and as frequencies and percentages for categorical parameters. Significance was tested with the Kruskal‐Wallis test for continuous parameters and with the chi‐square test for categorical parameters. Abbreviations: ALP, alkaline phosphatase; ALT, alanine aminotransferase; AST, aspartate aminotransferase; GGT, gamma‐glutamyl transferase; INR, international normalized ratio; NAS, NAFLD activity score.
OUTCOMES
The cohort was followed for a mean period of 19.9 years (SD, 8.7; range 0.4‐40.0 years), corresponding to 12,631 person years in NAFLD cases. During follow‐up, a total of 214 cases and 1,903 controls died (P = 0.10). Liver‐related (7.9% in cases versus 1.4% in controls; P < 0.001) and endocrine‐related mortality, including diabetes (5.1% versus 2.7%; P = 0.02) were significantly more common in NAFLD cases than controls. Stratified on fibrosis stage, there was a total of 47 deaths (29%) in patients with fibrosis stage 0, 71 (28%) in F1, 50 (34%) in F2, 32 (55%) in F3, and 14 (70%) in F4, compared to 1,903 controls (30%).
During follow‐up, 76 patients (11.8%) and 139 controls (2.2%) developed severe liver disease (P < 0.001). Patients with lean NAFLD had slightly more events of severe liver disease during follow‐up compared to cases with BMI 25.0‐29.9 (15.5% versus 9.3%; P = 0.06) but not compared to patients with BMI ≥30 (15.5% versus 13.8%; P = 0.69). Stratified on fibrosis stage, there were 12 cases of severe liver disease (7%) in patients with fibrosis stage 0, 16 (6%) in F1, 18 (12%) with F2, 15 (26%) with F3, and 15 (75%) with F4, compared to 139 controls (2%). Outcomes stratified on BMI category are listed in Table 2.
Table 2.
Events During Follow‐Up Per Bmi Category And In Controls
| Controls | BMI < 25 | BMI 25‐29.9 | BMI ≥ 30 | ||
|---|---|---|---|---|---|
| Parameter | n = 6,345 | n = 123 | n = 335 | n = 168 | P |
| Death, n (%) | 1,903 (30.0) | 47 (38.2) | 105 (31.3) | 62 (33.0) | 0.19 |
| Time to death, years (SD) | 19.9 (8.8) | 20.5 (8.8) | 19.9 (8.7) | 18.2 (8.3) | 0.02 |
| Liver‐related death, n (%) | 70 (1.1) | 10 (8.1) | 10 (3.0) | 8 (4.3) | <0.001 |
| Atherosclerotic cardiovascular death, n (%) | 748 (11.8) | 16 (13.0) | 40 (11.9) | 23 (12.2) | 0.98 |
| Endocrine‐related death, n (%) | 52 (0.8) | 1 (0.8) | 4 (1.2) | 6 (3.2) | 0.008 |
| Development of severe liver disease, n (%) | 139 (2.2) | 19 (15.5) | 31 (9.3) | 26 (13.8) | <0.001a |
| Time to first event of severe liver disease, years (SD) | 19.9 (8.8) | 19.0 (10.0) | 19.2 (9.2) | 16.9 (8.9) | <0.001 |
P values obtained from chi‐square tests.
P = 0.06 for BMI < 25 versus BMI 25.0‐29.9 and P = 0.69 for BMI < 25 versus BMI ≥ 30.
REGRESSION ANALYSES
Comparison With Controls
Compared to controls, patients with NAFLD in general had similar mortality but a higher risk for severe liver disease and liver‐related mortality. Only patients with obesity were at a greater risk for overall mortality (HR, 2.07; 95% confidence interval [CI], 1.56‐2.74). No excess mortality was seen in patients with lean NAFLD (HR, 1.04; 95% CI, 0.76‐1.41).
All patients with NAFLD were at an increased risk for development of severe liver disease compared to their respective controls. These data are presented in Table 3,4 and Figs. 2 and 3.
Table 3.
Hazard Ratios For Overall Mortality, Stratified Per Bmi Category And Compared To Controls Matched For Age, Sex, And Municipality
| Hazard Ratios for Overall Mortality | HR | 95% CI | P |
|---|---|---|---|
| Controls | (ref.) | ||
| BMI < 25 | 1.04 | 0.76‐1.41 | 0.82 |
| BMI 25‐30 | 1.23 | 0.91‐1.38 | 0.28 |
| BMI ≥ 30 | 2.07 | 1.56‐2.74 | <0.001 |
Abbreviation: ref., reference.
Table 4.
Hazard Ratios For Development Of Severe Liver Disease, Stratified Per Bmi Category and Compared To Controls Matched For Age, Sex, and Municipality
| Hazard Ratios for Development of Severe Liver Disease | HR | 95% CI | P |
|---|---|---|---|
| Controls | (ref.) | ||
| BMI < 25 | 4.42 | 2.25‐8.66 | <0.001 |
| BMI 25‐30 | 3.87 | 2.38‐8.30 | <0.001 |
| BMI ≥ 30 | 6.01 | 3.19‐11.32 | <0.001 |
Abbreviation: ref., reference.
Figure 2.
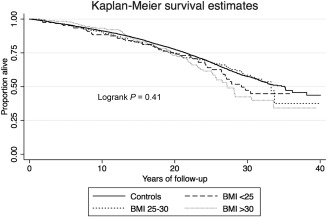
Kaplan‐Meier survival curve for overall mortality stratified on BMI category.
Figure 3.
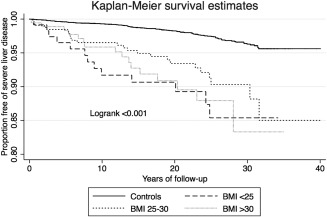
Kaplan‐Meier survival curve for development of severe liver disease stratified on BMI category.
NAFLD Cases
When comparing NAFLD cases and using patients with BMI 25.0‐29.9 as the reference category, patients with obesity were at a greater risk for overall mortality (HR, 1.46; P = 0.02) while no excess risk was found for patients who were lean (HR, 1.06; P = 0.73). An increased risk for severe liver disease was noted in the final model for patients with lean NAFLD (HR, 2.69; P = 0.007), while no increased risk was found for patients with obesity (HR, 1.11; P = 0.74). These estimates were only significant in the model that adjusted for fibrosis stage. These data are presented in Table 5,6.
Table 5.
Hazard Ratios For Overall Mortality
| Hazard Ratios for Overall Mortality | Model 1 | Model 2 | Model 3 | ||||||
|---|---|---|---|---|---|---|---|---|---|
| HR | 95% CI | P | HR | 95% CI | P | HR | 95% CI | P | |
| BMI 25‐30 | (ref.) | (ref.) | (ref.) | ||||||
| BMI < 25 | 1.16 | 0.82‐1.64 | 0.40 | 1.02 | 0.71‐1.45 | 0.93 | 1.06 | 0.75‐1.52 | 0.73 |
| BMI ≥ 30 | 1.22 | 0.89‐1.68 | 0.21 | 1.55 | 1.12‐2.15 | 0.009 | 1.46 | 1.05‐2.02 | 0.02 |
Hazard rations are stratified per BMI category and use patients with BMI 25.0‐29.9 as the reference category. Model 1, unadjusted estimates; Model 2, adjusted for sex, age, and type 2 diabetes at baseline; Model 3, further adjusted for fibrosis stage as a discrete variable (0–4).
Abbreviation: ref., reference.
Table 6.
Hazard Ratios For Development Of Severe Liver Disease
| Hazard Ratios for Development of Severe Liver Disease | Model 1 | Model 2 | Model 3 | ||||||
|---|---|---|---|---|---|---|---|---|---|
| HR | 95% CI | P | HR | 95% CI | P | HR | 95% CI | P | |
| BMI 25‐30 | (ref.) | (ref.) | (ref.) | ||||||
| BMI < 25 | 1.48 | 0.75‐2.91 | 0.26 | 1.68 | 0.84‐3.39 | 0.14 | 2.69 | 1.31‐5.50 | 0.007 |
| BMI ≥ 30 | 1.35 | 0.72‐2.55 | 0.35 | 1.52 | 0.79‐2.91 | 0.21 | 1.11 | 0.58‐2.13 | 0.74 |
Hazard rations are stratified per BMI category and use patients with BMI 25.0‐29.9 as the reference category. Model 1, unadjusted estimates; Model 2, adjusted for sex, age, and type 2 diabetes at baseline; Model 3, further adjusted for fibrosis stage as a discrete variable (0–4).
Abbreviation: ref., reference.
PREDICTORS OF MORTALITY IN LEAN NAFLD
In univariate analysis, several parameters were associated with overall mortality. In multivariate analysis, the only parameters that were independently associated with mortality were advanced fibrosis (stage 3‐4: HR, 4.33; 95% CI, 1.60‐11.73; P = 0.004), age at baseline (HR, 1.10; 95% CI, 1.05‐1.15; P < 0.001), and hypertension (HR, 2.25; 95% CI, 1.04‐4.86; P = 0.04). HRs for overall mortality in patients with lean NAFLD are presented in Table 7.
Table 7.
Predictors Of Overall Mortality In Cases With Lean Nafld (Bmi < 25 kg/m2)
| Model 1 | Model 2 | |||||
|---|---|---|---|---|---|---|
| Parameter | HR | 95% CI | P | HR | 95% CI | P |
| NASH (yes) | 1.07 | 0.57‐2.00 | 0.83 | |||
| NAS score (1–8) | 1.10 | 0.92‐1.30 | 0.29 | |||
| Fibrosis stage 0‐4a | 1.71 | 1.30‐2.25 | <0.001 | |||
| Fibrosis stage 3‐4 versus 0‐2a | 5.19 | 2.39‐11.25 | <0.001 | 4.32 | 1.60‐11.73 | 0.004 |
| Steatosis grade 1‐3 | 1.01 | 0.70‐1.46 | 0.96 | |||
| Lobular inflammation 0‐3 | 2.46 | 1.48‐4.09 | 0.001 | 1.51 | 0.82‐2.80 | 0.18 |
| Ballooning 0‐2 | 1.04 | 0.69‐1.56 | 0.86 | |||
| Portal inflammation 0‐2 | 2.45 | 1.60‐3.73 | <0.001 | 1.35 | 0.80‐2.27 | 0.27 |
| Hypertension (yes) | 2.89 | 1.61‐5.20 | <0.001 | 2.25 | 1.04‐4.86 | 0.04 |
| T2DM (yes) | 8.45 | 2.74‐26.03 | <0.001 | 1.32 | 0.22‐7.91 | 0.77 |
| Hyperlipidemia (yes) | 0.56 | 0.14‐2.31 | 0.42 | |||
| Smoking (never) | (ref) | |||||
| Smoking (previous) | 0.95 | 0.36‐2.51 | 0.92 | |||
| Smoking (current) | 1.20 | 0.59‐2.43 | 0.61 | |||
| BMI (kg/m2) | 0.96 | 0.88‐1.05 | 0.37 | |||
| Sex (male) | 0.36 | 0.20‐0.66 | 0.001 | 1.15 | 0.53‐2.52 | 0.72 |
| Age (years) | 1.11 | 1.08‐1.15 | <0.001 | 1.10 | 1.05‐1.15 | <0.001 |
| AST (U/L) | 1.02 | 1.00‐1.03 | 0.005 | 1.00 | 0.98‐1.02 | 0.75 |
| ALT (U/L) | 1.00 | 0.99‐1.01 | 0.27 | |||
| Platelet count (x109) | 1.00 | 0.99‐1.00 | 0.17 | |||
| Total cholesterol (mg/dL) | 1.00 | 0.99‐1.01 | 0.85 | |||
| Triglycerides (mg/dL) | 1.00 | 1.00‐1.00 | 0.09 | 1.00 | 1.00‐1.00 | 0.75 |
| Fasting glucose (mg/dL) | 1.02 | 1.01‐1.03 | <0.001 | 1.01 | 0.99‐1.02 | 0.53 |
| Ferritin (µg/L) | 1.00 | 1.00‐1.01 | 0.27 |
Model 1, univariate associations; Model 2, multivariate model that included all parameters with P < 0.1 in univariate analysis.
Fibrosis stage was added to the multivariate model as a categorical parameter (stage 3‐4 versus 0‐2).
Abbreviations: ALT, alanine aminotransferase; AST, aspartate aminotransferase; NAS, NAFLD activity score.
SENSITIVITY ANALYSES
In competing risk regression and compared to patients with BMI 25.0‐29.9 kg/m2, estimates for patients with lean NAFLD were similar to Cox regression estimates for development of severe liver disease (HR, 2.56; 95% CI, 1.28‐5.09; P = 0.008).
Hepatitis C testing had been performed at baseline or during follow‐up in 492 cases (76%). Of the 154 cases where HCV had not been actively excluded, only 12 cases had been investigated after 1991. There was no difference in the number of clinical events regarding severe liver disease in the HCV‐tested group versus the untested group (11.4% versus 13.0% experienced an event; P = 0.59). No significant changes in the regression models were found (data not shown).
Modelling incident diabetes as a time‐varying covariate resulted in slightly lower estimates for development of severe liver disease (HR, 2.34; 95% CI, 1.17‐4.67; P = 0.02) and overall mortality (HR, 0.99; 95% CI, 0.65‐1.52; P = 0.97) but did not reduce the significance of the model.
When stratifying the cohort on BMI category and if severe liver disease developed or not, in general patients that developed severe liver disease were older and had higher stages of fibrosis at baseline but no major differences in patients with lean and overweight NAFLD were noted (Supporting Table S2).
Discussion
This is the first published study investigating the long‐term risk of mortality and development of severe liver disease in biopsy‐proven lean NAFLD. Our main finding was that although patients with lean NAFLD had a better prognostic profile at baseline with a lower prevalence of advanced fibrosis and NASH, an increased risk for development of severe liver disease during follow‐up compared to patients with a higher BMI was found, after adjustment of important confounders, such as age and fibrosis stage at baseline.
No increased risk of overall mortality was noted compared to controls or to other patients with NAFLD; however, patients with NAFLD with obesity had a higher risk for overall mortality both compared to their matched controls and to overweight patients with NAFLD. The parameters that best predicted overall mortality in lean NAFLD were advanced fibrosis, age, and hypertension at baseline. This is consistent with other studies of risk factors for mortality in NAFLD.19, 20, 21
The presence of intrahepatic fat required for NAFLD usually occurs in the setting of decreased physical activity, increased caloric intake relative to expenditure, and for the most part, excess adipose tissue or fat mass. However, individuals with BMI defined as normal may have absolute excesses of adipose tissue; these “metabolically obese” individuals with normal weight (lean) may have a body composition that favors visceral adiposity, insulin resistance, and development of NAFLD.
The finding that patients with lean NAFLD are at an increased risk of severe liver disease despite a lower prevalence of advanced fibrosis and NASH at baseline is paradoxical. Logically, this suggests that fibrosis progression is faster in lean NAFLD than in patients with NAFLD with a higher BMI. Genetic variations in PNPLA3, transmembrane 6 superfamily 2 (TM6SF2), membrane‐bound O‐acyltransferase domain‐containing 7 (MBOAT7), or other genes associated with steatosis could possibly explain the association between lean NAFLD and the increased risk of future development of severe liver disease seen in this study. Differences in dietary patterns and other lifestyle parameters that possibly affect fibrosis progression could also be present. Unfortunately, none of these parameters could be evaluated in the current study.
As this is the first published data on the natural history in lean NAFLD, no direct comparisons are possible. An abstract published in 201418 that included a smaller cohort (n = 483) reported increased mortality in lean NAFLD despite a healthier metabolic profile and lower prevalence of advanced fibrosis. Liver‐specific outcomes were not reported. Our cohort was larger, with a longer duration of follow‐up, which is why our estimates could be more accurate. Previous studies of lean NAFLD compared to nonlean NAFLD suggest a similar or slightly better metabolic profile compared to nonlean NAFLD,14, 16 which was also noted in this cohort.
The main strength of this study is that all patients were diagnosed with NAFLD using the gold standard, i.e., liver biopsy. The cohort is the largest of its kind (n = 646), and the follow‐up time is the longest ever documented in biopsy‐proven NAFLD. This is critical in allowing for enough time to pass in patients with minimal disease to develop cirrhosis, as the time needed for this can be up to 30 years.29
Furthermore, due to high‐quality population‐based Swedish registers, all outcomes could be ascertained. The selection of robust outcome criteria, such as disease‐specific mortality or ascites, allowed us to capture theoretically all cases with severe liver disease. However, because outpatient visits in specialist care were only entered into the NPR after 2001, we may have missed cases with compensated cirrhosis only seen in outpatient care before this; consequently, our estimates might be falsely low. Estimates for mortality are not affected by this.
Limitations of our study include the selection of patients being made from two university hospitals, indicating that selection bias could be present. Indeed, 66.4% of patients had NASH, which is higher than in the general population.30 The use of liver biopsy was more common in previous decades, which is reflected by the number of cases (81.6%) in this study that underwent biopsy before the year 2000. Although we did perform a thorough chart review to identify and exclude cases that either under‐reported their alcohol consumption at baseline or increased their alcohol consumption during follow‐up, some cases might not have reported this to primary care or other caregivers, meaning that there is some possibility of misclassification.
Additionally, apart from register data and patient charts, we did not obtain detailed individual patient data, including new histologic and biochemical data, or development of BMI and whether there had been a reduction in BMI prior to baseline. Specifically, patients with lean NAFLD might have increased their weight during follow‐up. Furthermore, we lack data on parameters of insulin sensitivity other than fasting glucose, genetic variations (including PNPLA3), and body composition variables other than BMI. Indeed, it was recently shown that body composition measures that reflect visceral adiposity, including waist circumference, are better at predicting severe liver disease than BMI.31 Finally, we did not have access to biochemical or histologic data in the control population, which is why adjustments for confounders other that sex, age, and municipality could only be performed within the NAFLD group.
Our results suggest a paradoxical association between lean NAFLD and the development of future severe liver disease. Although at first glance lean NAFLD can seem benign compared to other patients with NAFLD, this might not be the case. Identifying factors in lean patients that are associated with fibrosis progression is of high interest. Additional studies should be made to corroborate or dispute our findings in similarly sized cohorts. Moreover, the importance of body fat distribution as well as genetic variants, such as PNPLA3 and TM6SF2, in lean NAFLD should be further explored.
Patients with lean NAFLD have a better histologic and biochemical profile compared to patients with NAFLD and a higher BMI. Despite this, patients with lean NAFLD are at a higher risk of future severe liver disease. Clinicians should be aware of this, and not exclude patients with lean NAFLD from follow‐up.
Author name in bold designate shared co‐first authorship.
Supporting information
Additional Supporting Information may be found at onlinelibrary.wiley.com/doi/10.1002/hep4.1124/full.
Supporting Information
Potential conflict of interest: Nothing to report.
Supported by grants from the Swedish Royal Academy of Sciences, the Bengt Ihre scholarship, and the Swedish Gastroenterology Fund (to H.H.).
REFERENCES
- 1. Younossi ZM, Stepanova M, Afendy M, Fang Y, Younossi Y, Mir H, et al. Changes in the prevalence of the most common causes of chronic liver diseases in the United States from 1988 to 2008. Clin Gastroenterol Hepatol 2011;9:524‐530.e1. [DOI] [PubMed] [Google Scholar]
- 2. Loomba R, Sanyal AJ. The global NAFLD epidemic. Nat Rev Gastroenterol Hepatol 2013;10:686‐690. [DOI] [PubMed] [Google Scholar]
- 3. Setiawan VW, Stram DO, Porcel J, Lu SC, Le Marchand L, Noureddin M. Prevalence of chronic liver disease and cirrhosis by underlying cause in understudied ethnic groups: the multiethnic cohort. Hepatology 2016;64:1969‐1977. [DOI] [PMC free article] [PubMed] [Google Scholar]
- 4. Younossi ZM, Koenig AB, Abdelatif D, Fazel Y, Henry L, Wymer M. Global epidemiology of nonalcoholic fatty liver disease‐meta‐analytic assessment of prevalence, incidence, and outcomes. Hepatology 2016;64:73‐84. [DOI] [PubMed] [Google Scholar]
- 5. Trends in adult body‐mass index in 200 countries from 1975 to 2014: a pooled analysis of 1698 population‐based measurement studies with 19.2 million participants. Lancet 2016;387:1377–1396. [DOI] [PMC free article] [PubMed] [Google Scholar]
- 6. Argo CK, Henry ZH. Editorial: “lean” NAFLD: metabolic obesity with normal BMI… is it in the genes? Am J Gastroenterol 2017;112:111‐113. [DOI] [PubMed] [Google Scholar]
- 7. Bhat G, Baba CS, Pandey A, Kumari N, Choudhuri G. Insulin resistance and metabolic syndrome in nonobese Indian patients with non‐alcoholic fatty liver disease. Trop Gastroenterol 2013;34:18‐24. [DOI] [PubMed] [Google Scholar]
- 8. Nishioji K, Sumida Y, Kamaguchi M, Mochizuki N, Kobayashi M, Nishimura T, et al. Prevalence of and risk factors for non‐alcoholic fatty liver disease in a non‐obese Japanese population, 2011‐2012. J Gastroenterol 2015;50:95‐108. [DOI] [PubMed] [Google Scholar]
- 9. Feng RN, Du SS, Wang C, Li YC, Liu LY, Guo FC, et al. Lean‐non‐alcoholic fatty liver disease increases risk for metabolic disorders in a normal weight Chinese population. World J Gastroenterol 2014;20:17932‐17940. [DOI] [PMC free article] [PubMed] [Google Scholar]
- 10. Margariti E, Deutsch M, Manolakopoulos S, Papatheodoridis GV. Non‐alcoholic fatty liver disease may develop in individuals with normal body mass index. Ann Gastroenterol 2012;25:45‐51. [PMC free article] [PubMed] [Google Scholar]
- 11. Kim HJ, Kim HJ, Lee KE, Kim DJ, Kim SK, Ahn CW, et al. Metabolic significance of nonalcoholic fatty liver disease in nonobese, nondiabetic adults. Arch Intern Medicine 2004;164:2169‐2175. [DOI] [PubMed] [Google Scholar]
- 12. Younossi ZM, Stepanova M, Negro F, Hallaji S, Younossi Y, Lam B, et al. Nonalcoholic fatty liver disease in lean individuals in the United States. Medicine 2012;91:319‐327. [DOI] [PubMed] [Google Scholar]
- 13. Alam S, Gupta UD, Alam M, Kabir J, Chowdhury ZR, Alam AK. Clinical, anthropometric, biochemical, and histological characteristics of nonobese nonalcoholic fatty liver disease patients of Bangladesh. Indian J Gastroenterol 2014;33:452‐457. [DOI] [PubMed] [Google Scholar]
- 14. Sookoian S, Pirola CJ. Systematic review with meta‐analysis: risk factors for non‐alcoholic fatty liver disease suggest a shared altered metabolic and cardiovascular profile between lean and obese patients. Aliment Pharmacol Ther 2017;46:85‐95. [DOI] [PubMed] [Google Scholar]
- 15. Fracanzani AL, Petta S, Lombardi R, Pisano G, Russello M, Consonni D, et al. Liver and cardiovascular damage in patients with lean nonalcoholic fatty liver disease, and association with visceral obesity. Clin Gastroenterol Hepatol 2017;15:1604‐1611. [DOI] [PubMed] [Google Scholar]
- 16. Feldman A, Eder SK, Felder TK, Kedenko L, Paulweber B, Stadlmayr A, et al. Clinical and metabolic characterization of lean Caucasian subjects with non‐alcoholic fatty liver. Am J Gastroenterol 2017;112:102‐110. [DOI] [PubMed] [Google Scholar]
- 17. Romeo S, Kozlitina J, Xing C, Pertsemlidis A, Cox D, Pennacchio LA, et al. Genetic variation in PNPLA3 confers susceptibility to nonalcoholic fatty liver disease. Nat Genet 2008;40:1461‐1465. [DOI] [PMC free article] [PubMed] [Google Scholar]
- 18. Dela Cruz AC, Bugianesi E, George J, Day CP, Liaquat H, Charatcharoenwitthaya P, et al. Characteristics and long‐term prognosis of lean patients with nonalcoholic fatty liver disease [Abstract]. Gastroenterology 2014:146(Suppl. 1):S‐909. http://www.gastrojournal.org/article/S0016-508563307-2/abstract. [Google Scholar]
- 19. Angulo P, Kleiner DE, Dam‐Larsen S, Adams LA, Bjornsson ES, Charatcharoenwitthaya P, et al. Liver fibrosis, but no other histologic features, associates with long‐term outcomes of patients with nonalcoholic fatty liver disease. Gastroenterology 2015;149:389‐397. [DOI] [PMC free article] [PubMed] [Google Scholar]
- 20. Ekstedt M, Hagstrom H, Nasr P, Fredrikson M, Stal P, Kechagias S, et al. Fibrosis stage is the strongest predictor for disease‐specific mortality in NAFLD after up to 33 years of follow‐up. Hepatology 2015;61:1547‐1554. [DOI] [PubMed] [Google Scholar]
- 21. Younossi ZM, Stepanova M, Rafiq N, Makhlouf H, Younoszai Z, Agrawal R, et al. Pathologic criteria for nonalcoholic steatohepatitis: interprotocol agreement and ability to predict liver‐related mortality. Hepatology 2011;53:1874‐1882. [DOI] [PubMed] [Google Scholar]
- 22. Hagström H, Nasr P, Ekstedt M, Hammar U, Stål P, Hultcrantz R, et al. Fibrosis stage but not NASH predicts mortality and time to development of severe liver disease in biopsy‐proven NAFLD. J Hepatol 2017; doi: 10.1016/j.jhep.2017.07.027. [DOI] [PubMed] [Google Scholar]
- 23. Bedossa P. Utility and appropriateness of the fatty liver inhibition of progression (FLIP) algorithm and steatosis, activity, and fibrosis (SAF) score in the evaluation of biopsies of nonalcoholic fatty liver disease. Hepatology 2014;60:565‐575. [DOI] [PubMed] [Google Scholar]
- 24. Kleiner DE, Brunt EM, Van Natta M, Behling C, Contos MJ, Cummings OW, et al.; Nonalcoholic Steatohepatitis Clinical Research Network . Design and validation of a histological scoring system for nonalcoholic fatty liver disease. Hepatology 2005;41:1313‐1321. [DOI] [PubMed] [Google Scholar]
- 25. Ludvigsson JF, Otterblad‐Olausson P, Pettersson BU, Ekbom A. The Swedish personal identity number: possibilities and pitfalls in healthcare and medical research. Eur J Epidemiol 2009;24:659‐667. [DOI] [PMC free article] [PubMed] [Google Scholar]
- 26. Ludvigsson JF, Andersson E, Ekbom A, Feychting M, Kim JL, Reuterwall C, et al. External review and validation of the Swedish national inpatient register. BMC Public Health 2011;11:450. [DOI] [PMC free article] [PubMed] [Google Scholar]
- 27. Barlow L, Westergren K, Holmberg L, Talback M. The completeness of the Swedish Cancer Register: a sample survey for year 1998. Acta Oncol 2009;48:27‐33. [DOI] [PubMed] [Google Scholar]
- 28. Jepsen P, Vilstrup H, Andersen PK. The clinical course of cirrhosis: the importance of multistate models and competing risks analysis. Hepatology 2015;62:292‐302. [DOI] [PubMed] [Google Scholar]
- 29. Singh S, Allen AM, Wang Z, Prokop LJ, Murad MH, Loomba R. Fibrosis progression in nonalcoholic fatty liver versus nonalcoholic steatohepatitis: a systematic review and meta‐analysis of paired‐biopsy studies. Clin Gastroenterol Hepatol 2015;13:643‐654.e1‐9. [DOI] [PMC free article] [PubMed] [Google Scholar]
- 30. Williams CD, Stengel J, Asike MI, Torres DM, Shaw J, Contreras M, et al. Prevalence of nonalcoholic fatty liver disease and nonalcoholic steatohepatitis among a largely middle‐aged population utilizing ultrasound and liver biopsy: a prospective study. Gastroenterology 2011;140:124‐131. [DOI] [PubMed] [Google Scholar]
- 31. Andreasson A, Carlsson AC, Onnerhag K, Hagstrom H. Waist/hip ratio better predicts development of severe liver disease within 20 years than body mass index: a population‐based cohort study. Clin Gastroenterol Hepatol 2017;15:1294‐1301.e2. [DOI] [PubMed] [Google Scholar]
Associated Data
This section collects any data citations, data availability statements, or supplementary materials included in this article.
Supplementary Materials
Additional Supporting Information may be found at onlinelibrary.wiley.com/doi/10.1002/hep4.1124/full.
Supporting Information