Abstract
The aim of the present study was to identify genes, microRNAs (miRNAs/miRs) or pathways associated with the development of pituitary gonadotroph adenomas. The array data of GSE23207, which included 16 samples of multiple endocrine neoplasia-associated rat pituitary homozygous mutations and 5 pituitary tissue samples from healthy rats, were downloaded from the Gene Expression Omnibus database. Differentially expressed genes (DEGs) were analyzed prior to functional enrichment analysis and protein-protein interaction (PPI) network construction. miRNAs associated with DEGs were predicted, and an miRNA-target regulatory network was constructed. A total of 187 upregulated and 370 downregulated DEGs were identified in the pituitary gonadotroph adenoma group compared with the healthy (control) group. Cyclin-dependent kinase (Cdk) 1 exhibited the highest degree in the PPI network. The upregulated DEGs were predominately enriched in ‘neuroactive ligand-receptor interaction’ pathway, and downregulated DEGs were mainly enriched in ‘cell cycle’. The DEGs in module were predominately enriched in the ‘cell cycle’, whereas DEGs in module b and c were enriched in ‘neuroactive ligand-receptor interaction’. miR-374, −153, −145 and −33 were identified as important miRNAs in the regulation of the DEGs. Cdk1, cyclin (Ccn) A2, Ccnb1, ‘cell cycle’ and ‘neuroactive ligand-receptor interaction’ pathways may serve important roles in the development of pituitary gonadotroph adenomas; Ccna2 and Ccnb1 may contribute to this development via an effect on the ‘cell cycle’ pathway. Furthermore, miR-374 and −145 may contribute to the development of pituitary gonadotroph adenomas via regulation of the expression of target genes.
Keywords: pituitary gonadotroph adenomas, differentially expressed genes, protein-protein interaction network, modules, microRNA-target regulatory network
Introduction
Pituitary adenomas are generally benign, arise from adenohypophyseal cells and are one of the most frequent types of intracranial tumor (1). It is reported that pituitary gonadotroph adenomas account for 15–22% of all pituitary adenomas and include the majority of clinically nonfunctional pituitary adenomas (2,3). Surgery remains the first line of treatment for the majority of patients, but it cannot effectively control invasive pituitary adenomas (4). Therefore, novel and effective therapeutic approaches are required. Understanding the molecular mechanisms of pituitary gonadotroph adenoma development may provide new insights for their treatment.
Heaney et al (5) proposed peroxisome proliferator-activated receptor-γ ligands as candidates for the management of nonfunctioning pituitary tumors. Chesnokova et al (6) indicated that Forkhead box gene transcription factor L2 (FOXL2) activated the clusterin promoter in gonadotroph pituitary cells. Chesnokova et al (7) reported that clusterin and FOXL2 regulated the growth of pituitary gonadotroph adenoma. Lee et al (8) suggested that somatostatin receptor 3 may be a possible target for the treatment of pituitary gonadotroph adenomas. Furthermore, the downregulation of miRNA targeting high mobility group AT-hook 1 (HMGA) 1 and 2 and E2F transcription factor 1 may contribute to pituitary tumorigenesis (9). The downregulation of miR-23b and miR-130b expression may contribute to pituitary tumorigenesis (10). In addition, targeting phosphoinositide 3-kinase/mechanistic target of rapamycin signaling may activate antitumor effects against nonfunctioning pituitary adenomas (11). Despite results demonstrated in these previous studies, knowledge about the underlying molecular mechanisms of pituitary gonadotroph adenoma development may be insufficient and further research is required.
Lee et al (12), the contributors of the GSE23207 microarray dataset, demonstrated that the multiple endocrine neoplasia (MENX) rat model could be used as an experimental tool to study the pathological mechanisms for human pituitary tumorigenesis. Zhang et al (13) used the GSE23207 dataset to identify that differentially expressed genes (DEGs) associated with ‘cell cycle’, ‘cell division’, ‘neuroactive ligand-receptor interaction’, ‘pituitary gland’, ‘adenohypophysis’ and ‘endocrine system’ may serve important roles in the pathogenesis of pituitary adenomas via DEG screening, gene ontology (GO) and pathway enrichment analysis, and protein-protein interaction (PPI) network construction. The present study used the microarray GSE23207 dataset in addition to the above techniques; however, miRNA-DEG regulatory network analysis was also performed. Important genes, miRNAs and pathways associated with the development of pituitary gonadotroph adenomas were identified, in order to aid the clarification of the molecular mechanisms of pituitary adenomas.
Materials and methods
Microarray data
The raw microarray data from GSE23207, as deposited by Lee et al (12), and GPL6247, as produced with the Affymetrix Rat Gene 1.0 ST array [transcript (gene) version; Thermo Fisher Scientific, Inc., Waltham, MA, USA] were downloaded from the Gene Expression Omnibus (GEO; http://www.ncbi.nlm.nih.gov/geo) database. From these datasets, data from a total of 21 pituitary samples, including 16 from MENX rats with homozygous mutations (p27Kip1/Cdknb1) and 5 healthy rat pituitary tissue samples were used in the present study.
Data preprocessing
The processing of the raw data, including format conversion, the supplementation of missing values, background correction and quartile normalization, was performed using the affy package in R (14).
Screening of DEGs
The DEGs in the pituitary gonadotroph adenoma group compared with the control group were screened with the limma package (15). The P-values for DEGs were calculated by a t-test in the limma package. Then, the P-values were adjusted to false discovery rate (FDR) values using the Benjamini-Hochberg procedure (16). |log2 fold change (FC) |≥1 and FDR <0.05 were set as cut-off criteria for all DEGs. The heatmap for DEGs was drawn with the pheatmap package in R (17).
Functional enrichment analysis tools
Gene ontology (GO) annotation (18), including the categories of molecular function (MF), biological process (BP) and cellular component (CC), and Kyoto Encyclopedia of Genes and Genomes (KEGG) (19) pathway enrichment analyses were performed to identify upregulated and downregulated DEGs. The functional enrichment analysis was performed using the Multifaceted Analysis Tool for Human Transcriptome (MATHT; www.biocloudservice.com). The Gene Set Function-Functional Enrichment-mRNA Enrichment module, based on Fisher's test, was used for the enrichment analysis of gene sets with a cut off of P<0.05.
PPI network
The Search Tool for the Retrieval of Interacting Genes database was used to predict and analyze the interactions of proteins encoded by DEGs (20). PPI networks were constructed using Cytoscape software (version 3.2.0) (21). The input gene sets were the identified DEGs, and the species was set to Rattus norvegicus. DEGs were constructed into a PPI network with a weight threshold of ≤0.4 (medium confidence). The top 20 genes were added one-by-one according to degree value from high to low, starting with Cdk1, in the cluster analysis until the top 20 genes clustered correctly. Clustering analysis was performed using molecular context detection Cytoscape plug-in (MCODE; version 1.4.1; http://baderlab.org/Software/MCODE).
miRNA-target genes regulatory network analysis
The miRNA that potentially regulated the DEGs were predicted using WebGestal (22,23), and a miRNA-target regulatory network was constructed using Cytoscape. Experimentally verified miRNA-DEG interactions were downloaded from Mirwalk2 (24).
Verification
The GSE26966 dataset, including 10 gonadotroph tumors and 9 normal human pituitaries from autopsy samples, were downloaded from the GEO database. Data normalization and DEG analysis was performed with the affy and limma packages, respectively. |log FC |>1 and P<0.05 were used as cut-off criteria. GO-BP and KEGG pathway enrichment analyses were performed using the Database for Annotation, Visualization and Integrated Discovery (25). FDR<0.05 was set as a cut-off value. In addition, the DEGs in GSE26966 were compared with the DEGs in GSE23207.
Results
DEGs analysis
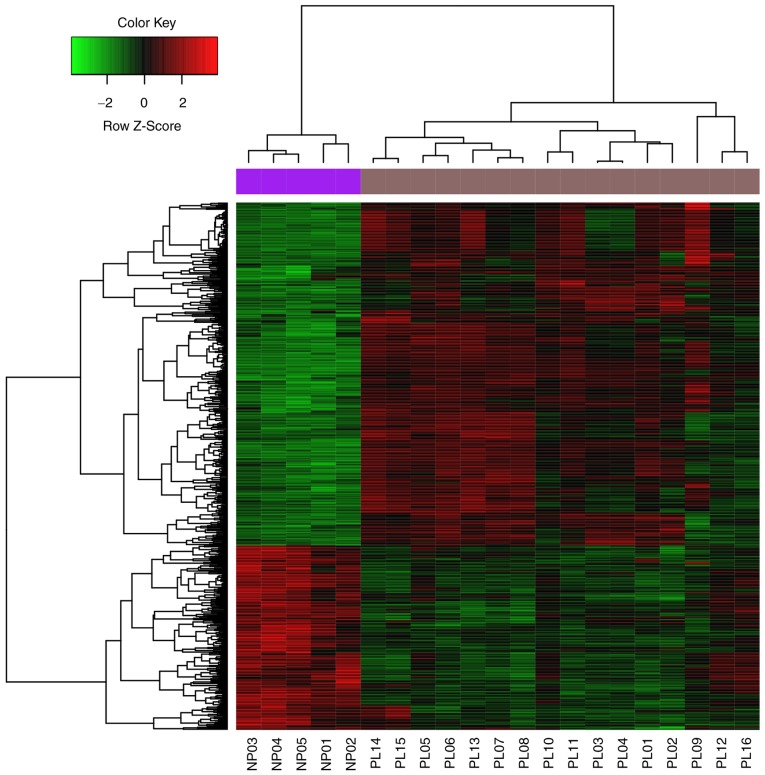
In total, 557 DEGs, including 187 significantly upregulated and 370 significantly downregulated DEGs, were identified in the pituitary gonadotroph adenoma group compared with the control group (Fig. 1).
Figure 1.
Heatmap and hierarchical clustering analysis of differentially expressed genes between the GSE23207 (PL) and GPL6247 (NP) datasets.
Functional enrichment analysis
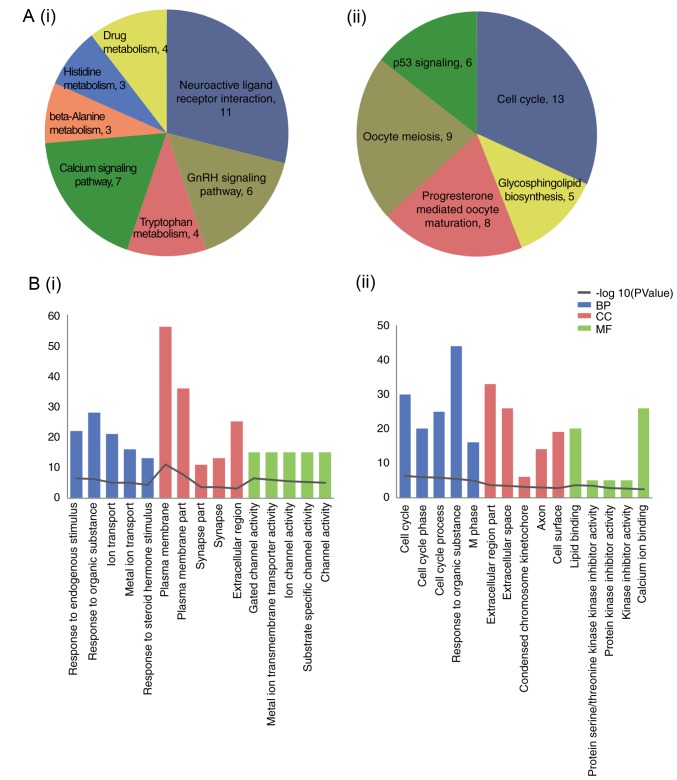
The results of functional enrichment analysis for the up- and downregulated DEGs are included in Fig. 2. The upregulated DEGs were predominately enriched in ‘neuroactive ligand-receptor interaction’ and the ‘GnRH signaling pathway’; downregulated DEGs were enriched in ‘cell cycle’.
Figure 2.
Functional enrichment analysis of up- and downregulated DEGs. (A) Enriched Kyoto Encyclopedia of Genes and Genomes pathways, including (i) upregulated and (ii) downregulated. (B) Encircled Gene Ontology terms, including the top 5 for (i) upregulated and (ii) downregulated DEGs. DEGs, differentially expressed genes; BP, biological process; CC, cellular component; MF, molecular function.
PPI network
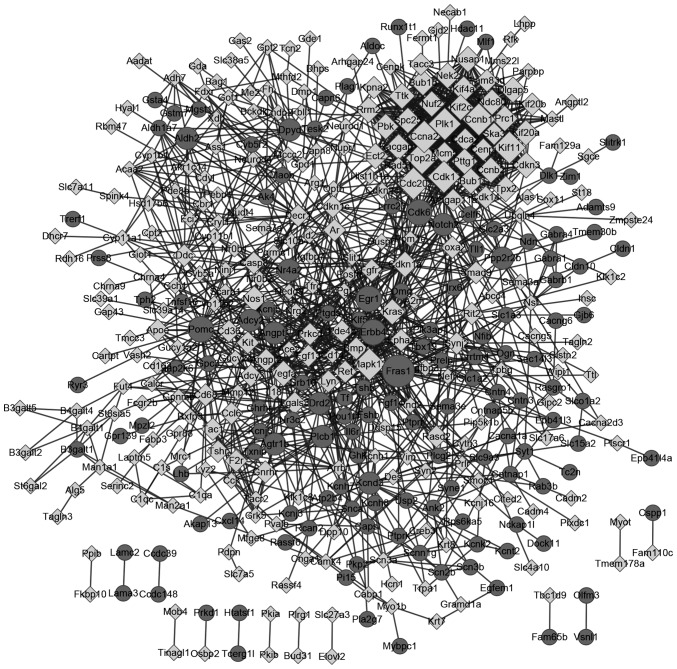
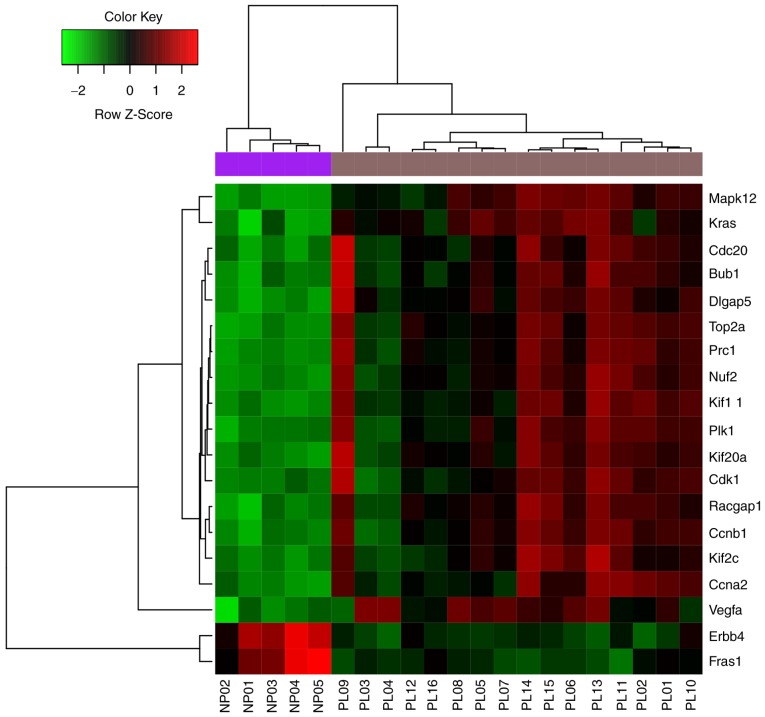
There were 413 nodes and 1,601 protein pairs in the PPI network (Fig. 3). The top 20 nodes with the highest degrees are included in Table I. The top 5 nodes were Cdk1 (degree, 52), topoisomerase (DNA) II α (Top2α; degree, 51), Ccna2; (degree, 50), Fraser extracellular matrix complex subunit 1 (Fras1; degree, 46) and Ccnb1 (degree, 46). The expression of the top 20 nodes from the PPI network is illustrated in Fig. 4.
Figure 3.
Protein-protein interaction network for DEGs. Circle, upregulated DEGs; diamond, downregulated DEGs. The higher the degree value, the larger the node. DEGs, differentially expressed genes.
Table I.
Top 20 nodes with the highest degrees in the protein-protein interaction network.
| Node | Degree |
|---|---|
| Cdk1 | 52 |
| Top2a | 51 |
| Ccna2 | 50 |
| Fras1 | 46 |
| Ccnb1 | 46 |
| Plk1 | 45 |
| Mapk12 | 44 |
| Cdc20 | 44 |
| Kif11 | 41 |
| Racgap1 | 37 |
| Bub1 | 37 |
| Prc1 | 36 |
| Bub1b | 36 |
| Kras | 35 |
| Kif20a | 35 |
| Kif2c | 34 |
| Vegfa | 34 |
| Dlgap5 | 33 |
| Erbb4 | 32 |
| Nuf2 | 32 |
Figure 4.
Heatmap and hierarchical clustering analysis for the top 20 nodes.
Network cluster module
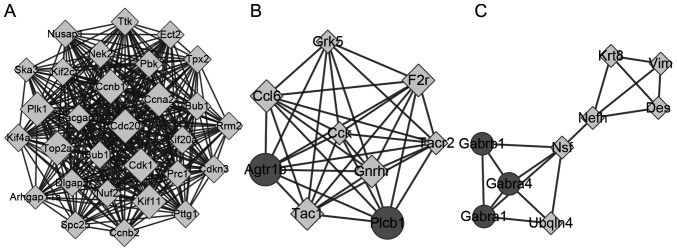
A total of 3 cluster modules were obtained (A-C; Fig. 5). Module a contained 29 nodes and 365 edges, module b contained 9 nodes and 35 edges and module c contained 9 nodes and 16 edges. All genes in module a were upregulated, and all of the top 20 genes were included in this module. The KEGG pathways significantly enriched by these modules are included in Table II. The DEGs in module a were enriched in the ‘cell cycle’ and ‘oocyte meiosis’ pathways. The DEGs in module b were enriched in the ‘chemokine signaling pathway’, ‘calcium signaling pathway’, and ‘neuroactive ligand-receptor interaction’. DEGs in module c were enriched in ‘neuroactive ligand-receptor interaction’.
Figure 5.
Three network cluster modules. (A) Module A contained 29 nodes and 365 edges. (B) Module b contained 9 nodes and 35 edges. (C) Module C contained 9 nodes and 16 edges. Circle, upregulated DEGs; diamond, downregulated DEGs. DEGs, differentially expressed genes.
Table II.
The Kyoto Encyclopedia of Genes and Genomes pathways significantly enriched in the three identified modules.
| A, enriched terms associated with module a | ||||
|---|---|---|---|---|
| Pathway ID | Pathway name | Count | P-value | Genes |
| rno04110 | Cell cycle | 9 | 4.71×10⁻¹³ | CCNB1, CCNB2, PLK1, BUB1, BUB1B, TTK, CDC20, PTTG1, CCNA2 |
| rno04114 | Oocyte meiosis | 6 | 3.34×10⁻⁷ | CCNB1, CCNB2, PLK1, BUB1, CDC20, PTTG1 |
| rno04914 | Progesterone-mediated oocyte maturation | 5 | 6.50×10⁻⁶ | CCNB1, CCNB2, PLK1, BUB1, CCNA2 |
| rno04115 | p53 signaling pathway | 3 | 4.69×10⁻³ | CCNB1, CCNB2, RRM2 |
| B, enriched terms associated with module b | ||||
| Pathway ID | Pathway name | Count | P-value | Genes |
| rno04062 | Chemokine signaling pathway | 4 | 5.26×10⁻⁴ | AGTR1B, GRK5, PLCB1, CCL6 |
| rno04020 | Calcium signaling pathway | 4 | 6.32×10⁻⁴ | AGTR1B, TACR2, PLCB1, F2R |
| rno04080 | Neuroactive ligand-receptor interaction | 4 | 1.83×10⁻³ | AGTR1B, TACR2, GNRHR, F2R |
| C, enriched terms associated with module c | ||||
| Pathway ID | Pathway name | Count | P-value | Genes |
| Brno04080 | Neuroactive ligand-receptor interaction | 3 | 1.23×10⁻² | GABRA1, GABRA4, GABRB1 |
miRNA-target regulatory network analysis
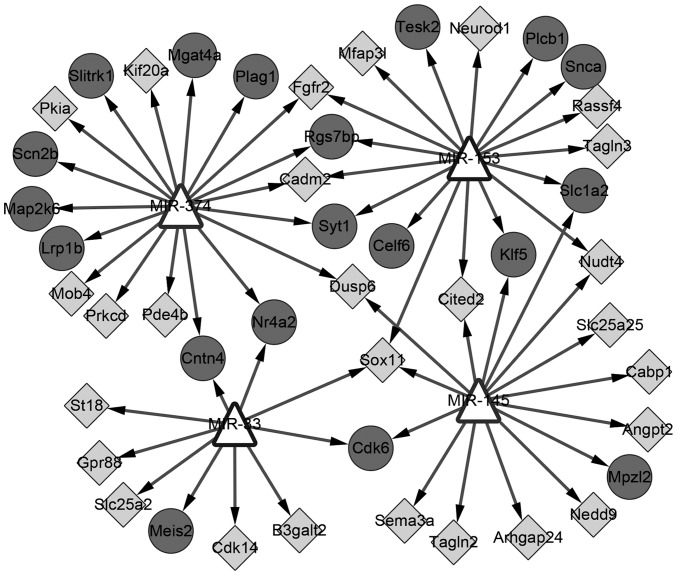
In total, 4 miRNAs were identified (miR-374, −153, −145 and −33); miR-374 and −145 had been experimentally verified to be able to regulate DEGs (26,27). A total of 50 nodes and 60 edges were included in this regulatory network (Fig. 6). The KEGG pathway enriched by target genes in this network was ‘GnRH signaling’.
Figure 6.
The miRNA-target regulatory network. Triangle, miRNA; circle, upregulated DEGs; diamond, downregulated DEGs. miRNA, microRNA; DEGs, differentially expressed genes.
Verification
A total of 1,432 DEGs (including 651 upregulated, 781 downregulated) were identified in the pituitary gonadotroph adenoma group compared with the control group. In total, 13 common upregulated and 38 common downregulated DEGs were obtained from comparing the GSE26966 and GSE23207 data. The significantly enriched GO-BP and KEGG pathways for GSE26966 were also identified; the top 10 upregulated GO-BP terms were ‘ion transmembrane transport’, ‘positive regulation of synapse assembly’, ‘adherens junction organization’, ‘central nervous system development’, ‘membrane depolarization during cardiac muscle cell action potential’, ‘chloride transmembrane transport’, ‘heterophilic cell-cell adhesion via plasma membrane cell adhesion molecules’, ‘sodium ion transport’, ‘potassium ion transport’ and ‘negative regulation of the mitotic cell cycle’.
Discussion
A total of 557 DEGs, including 187 significantly upregulated and 370 downregulated DEGs, were identified in the pituitary gonadotroph adenoma group compared with the control group. Cdk1 (degree, 52) had the highest degree in the PPI network. Ccna2 (degree, 50) and Ccnb1 (degree, 46) were also enriched in the ‘cell cycle’. Furthermore, the upregulated DEGs were predominately enriched in ‘neuroactive ligand-receptor interaction’ and downregulated DEGs were mainly enriched in the ‘cell cycle’. DEGs in module were also mainly enriched in ‘cell cycle’. DEGs in module b and c were enriched in ‘neuroactive ligand-receptor interaction’. Furthermore, miR-374, −153, −145 and −33 were identified as miRNAs that may have regulated the DEGs.
Cdk1, Ccna2 and Ccnb1 demonstrated the highest connectivity degrees in the PPI network. A number of previous studies have suggested that Ccnb1 and Ccna2 are abnormally expressed in pituitary adenomas (10,28). Another study suggested that the downregulation of miR-410, which targets Ccnb1, contributes to pituitary gonadotroph tumor development (4). The overexpression of Ccna2 serves a key function in pituitary tumorigenesis (10). p27 belongs to the Cdk1 family, and is downregulated in invasive and recurrent adenomas as well as pituitary carcinomas (29). These studies suggest that Cdk1, Ccna2 and Ccnb1 may have important roles in the development of pituitary gonadotroph adenomas, which supports the results of the present study.
Furthermore, in this study, the upregulated DEGs were predominately enriched in ‘neuroactive ligand-receptor interaction’ and downregulated DEGs were enriched in ‘cell cycle’. DEGs in module a were also mainly enriched in ‘cell cycle’. DEGs in modules b and c were enriched in ‘neuroactive ligand-receptor interactions’. Previous research has demonstrated cell cycle dysregulation in pituitary adenomas (30–32). Quereda et al (31) indicated that the dysregulation of the cell cycle in pituitary disease had a significant effect on treatment. Cell cycle dysregulation is the main mechanism by which HMGA proteins cause the development of pituitary adenomas (33). The damage to cell cycle regulation in pituitary adenomas caused by Wee1 downregulation may cause the G2/M checkpoint to be lost, leading to the accumulation of DNA damage and the induction of tumor development (34). Thus, the dysregulation of the cell cycle may be associated with the progression of pituitary gonadotroph adenomas. In addition, Zhang et al (13) indicated that genes associated with neuroactive ligand-receptor interaction, including the γ-aminobutyric acid type a receptor α1, α4 and β1 subunits, may serve essential roles in the pathogenesis of pituitary adenomas. Although the role of neuroactive ligand-receptor interaction in pituitary adenoma development have not been fully characterized, the present study identified that the upregulated DEGs were predominately enriched in ‘neuroactive ligand-receptor interaction’, and that DEGs in module b and c were particularly enriched in ‘neuroactive ligand-receptor interaction’. Thus, it may be that a neuroactive ligand-receptor interaction is critical in the pathogenesis of pituitary gonadotroph adenomas.
Ccna2 and Ccnb1 were also enriched in ‘cell cycle’ in the present study. Therefore, Ccna2 and Ccnb1 may be associated with the development of pituitary gonadotroph adenomas via an effect on the cell cycle.
The results also identified that miR-374, −153, −145 and −33 may have been important miRNAs for regulating DEGs. miRNAs function as antisense regulators of gene expression, and contribute to the progression and development of cancer (35). One study demonstrated that miR-374 was upregulated in pituitary gonadotroph adenomas compared with the normal pituitary by reverse transcription-quantitative polymerase chain reaction (RT-qPCR) analysis (4). Palumbo et al (36) further confirmed that miR-145 was downregulated in pituitary tumors compared with normal tissues by performing RT-qPCR. Sachdeva and Mo (37) suggested that miR-145 could be regarded as a potential cancer biomarker and a novel target for the therapy of cancer. Furthermore, miR-374 and −145 have been verified to be able to regulate DEGs by previous experiments (26,27). Thus, the present study corroborates previous research by demonstrating that miR-374 and −145 may contribute to the development of pituitary gonadotroph adenomas via regulating the expression of target genes. To the best of our knowledge, no previous experimental studies concerning the association between miR-153 and −33 and pituitary adenomas have been performed; therefore, this topic should be further researched.
The upregulated and downregulated DEGs identified using the GSE26966 human dataset were not significantly enriched in the ‘neuroactive ligand-receptor interaction’ pathways or ‘cell cycle’ pathways. However, as the neuroactive ligand-receptor interaction pathway is a collection of receptors and ligands associated with intracellular and extracellular signaling pathways on the plasma membrane (38), a total of 5 of the top 10 upregulated GO-BP terms (including ‘ion transmembrane transport’, ‘positive regulation of synapse assembly’, ‘chloride transmembrane transport’, ‘sodium ion transport’ and ‘potassium ion transport’) were therefore associated with the neuroactive ligand-receptor interaction pathway.
The downregulated DEGs were predominately enriched in the GO-BP terms ‘negative regulation of cell proliferation’, ‘regulation of insulin-like growth factor receptor signaling pathway’, ‘aging’ and ‘regulation of cell growth’, among which ‘negative regulation of cell proliferation’, ‘aging’ and ‘regulation of cell growth’ were associated with ‘cell cycle’. Other enriched BP terms identified in this study include ‘cell differentiation’, ‘positive regulation of osteoblast differentiation’, ‘fat cell differentiation’, ‘positive regulation of cell proliferation’ and ‘cell cycle arrest’ were also associated with ‘cell cycle’. Therefore, the association of neuroactive ligand-receptor interactions and the cell cycle pathway were indirectly verified for the human array data of GSE26966, suggesting that the mechanisms associated with neuroactive ligand-receptor interactions and the cell cycle pathway may also serve important roles in the development of human pituitary gonadotroph adenomas.
Although the array data, GSE23207, which was used to perform the present analysis, had been analyzed by a previously published study (12), there were several differences between the present study and that of Zhang et al (13). First, as described in the introduction section, in addition to the screening of DEGs, PPI network analysis and GO and KEGG pathway enrichment analysis, miRNA-target gene regulatory network analysis was also performed. Secondly, verification was achieved using the human array data from GSE26966. Therefore, the present study provides new information to advance the understanding of the development of pituitary gonadotroph adenomas.
In conclusion, Cdk1, Ccna2, Ccnb1, ‘cell cycle’ and ‘neuroactive ligand-receptor interaction’ pathways may serve important roles in the development of pituitary gonadotroph adenomas, and Ccna2 and Ccnb1 may be involved in the development of pituitary gonadotroph adenomas via the cell cycle pathway. Furthermore, miR-374 and −145 may contribute to the development of pituitary gonadotroph adenomas via regulating the expression of target genes. These genes, pathways and miRNAs are potential targets of pituitary gonadotroph adenoma therapy. However, there were several limitations in this study, including the relatively small sample size and the lack of miRNA array data for human pituitary gonadotroph adenomas for the verification of the up- and downregulated miRNAs. Further studies concerning the association between miR-153 and −33, and pituitary gonadotroph adenomas/pituitary adenomas, are required.
References
- 1.Trouillas J, Roy P, Sturm N, Dantony E, Cortet-Rudelli C, Viennet G, Bonneville JF, Assaker R, Auger C, Brue T, et al. A new prognostic clinicopathological classification of pituitary adenomas: A multicentric case-control study of 410 patients with 8 years post-operative follow-up. Acta Neuropatholo. 2013;126:123–135. doi: 10.1007/s00401-013-1084-y. [DOI] [PubMed] [Google Scholar]
- 2.Daly AF, Rixhon M, Adam C, Dempegioti A, Tichomirowa MA, Beckers A. High prevalence of pituitary adenomas: A cross-sectional study in the province of liege, belgium. J Clin Endocrinol Metab. 2006;91:4769–4775. doi: 10.1210/jc.2006-1668. [DOI] [PubMed] [Google Scholar]
- 3.Fernandez A, Karavitaki N, Wass JA. Prevalence of pituitary adenomas: A community-based, cross-sectional study in banbury (Oxfordshire, UK) Clin Endocrinol (Oxf) 2010;72:377–382. doi: 10.1111/j.1365-2265.2009.03667.x. [DOI] [PubMed] [Google Scholar]
- 4.Müssnich P, Raverot G, Jaffrain-Rea ML, Fraggetta F, Wierinckx A, Trouillas J, Fusco A, D'Angelo D. Downregulation of miR-410 targeting the cyclin B1 gene plays a role in pituitary gonadotroph tumors. Cell Cycle. 2015;14:2590–2597. doi: 10.1080/15384101.2015.1064207. [DOI] [PMC free article] [PubMed] [Google Scholar]
- 5.Heaney AP, Fernando M, Melmed S. PPAR-gamma receptor ligands: Novel therapy for pituitary adenomas. J Clin Invest. 2003;111:1381–1388. doi: 10.1172/JCI200316575. [DOI] [PMC free article] [PubMed] [Google Scholar]
- 6.Chesnokova V, Zonis S, Zhou C, Ben-Shlomo A, Wawrowsky K, Toledano Y, Tong Y, Kovacs K, Scheithauer B, Melmed S. Lineage-specific restraint of pituitary gonadotroph cell adenoma growth. PLoS One. 2011;6:e17924. doi: 10.1371/journal.pone.0017924. [DOI] [PMC free article] [PubMed] [Google Scholar]
- 7.Chesnokova V, Zonis S, Wawrowsky K, Tani Y, Ben-Shlomo A, Ljubimov V, Mamelak A, Bannykh S, Melmed S. Clusterin and foxl2 act concordantly to regulate pituitary gonadotroph adenoma growth. Mol Endocrinol. 2012;26:2092–2103. doi: 10.1210/me.2012-1158. [DOI] [PMC free article] [PubMed] [Google Scholar]
- 8.Lee M, Lupp A, Mendoza N, Martin N, Beschorner R, Honegger J, Schlegel J, Shively T, Pulz E, Schulz S, et al. SSTR3 is a putative target for the medical treatment of gonadotroph adenomas of the pituitary. Endocr Relat Cancer. 2015;22:111–119. doi: 10.1530/ERC-14-0472. [DOI] [PubMed] [Google Scholar]
- 9.D'Angelo D, Palmieri D, Mussnich P, Roche M, Wierinckx A, Raverot G, Fedele M, Croce CM, Trouillas J, Fusco A. Altered microRNA expression profile in human pituitary GH adenomas: Down-regulation of miRNA targeting HMGA1, HMGA2, and E2F1. J Clin Endocrinol Metab. 2012;97:E1128–E1138. doi: 10.1210/jc.2011-3482. [DOI] [PubMed] [Google Scholar]
- 10.Leone V, Langella C, D'Angelo D, Mussnich P, Wierinckx A, Terracciano L, Raverot G, Lachuer J, Rotondi S, Jaffrain-Rea ML, et al. Mir-23b and miR-130b expression is downregulated in pituitary adenomas. Mol Cell Endocrinol. 2014;390:1–7. doi: 10.1016/j.mce.2014.03.002. [DOI] [PubMed] [Google Scholar]
- 11.Lee M, Wiedemann T, Gross C, Leinhäuser I, Roncaroli F, Braren R, Pellegata NS. Targeting PI3K/mTOR signaling displays potent antitumor efficacy against nonfunctioning pituitary adenomas. Clin Cancer Res. 2015;21:3204–3215. doi: 10.1158/1078-0432.CCR-15-0288. [DOI] [PubMed] [Google Scholar]
- 12.Lee M, Marinoni I, Irmler M, Psaras T, Honegger JB, Beschorner R, Anastasov N, Beckers J, Theodoropoulou M, Roncaroli F, Pellegata NS. Transcriptome analysis of MENX-associated rat pituitary adenomas identifies novel molecular mechanisms involved in the pathogenesis of human pituitary gonadotroph adenomas. Acta Neuropathol. 2013;126:137–150. doi: 10.1007/s00401-013-1132-7. [DOI] [PMC free article] [PubMed] [Google Scholar]
- 13.Zhang H, Xu C, Sun N, Zhou Y, Yu X, Yan X, Zhang Q. Gene expression profiling analysis of MENX-associated rat pituitary adenomas contributes to understand molecular mechanisms of human pituitary adenomas. Oncol Lett. 2016;11:125–133. doi: 10.3892/ol.2015.3904. [DOI] [PMC free article] [PubMed] [Google Scholar]
- 14.Gautier L, Cope L, Bolstad BM, Irizarry RA. Affy-analysis of Affymetrix GeneChip data at the probe level. Bioinformatics. 2004;20:307–315. doi: 10.1093/bioinformatics/btg405. [DOI] [PubMed] [Google Scholar]
- 15.Smyth GK. LIMMA: Linear models for microarray data. Bioinformatics and Computational Biology Solutions Using R and Bioconductor. Statistics for Biology and Health. 2005:397–420. [Google Scholar]
- 16.Ferreira JA. The Benjamini-Hochberg method in the case of discrete test statistics. Int J Biostat. 2007;3:11. doi: 10.2202/1557-4679.1065. [DOI] [PubMed] [Google Scholar]
- 17.Wang L, Cao C, Ma Q, Zeng Q, Wang H, Cheng Z, Zhu G, Qi J, Ma H, Nian H, Wang Y. RNA-seq analyses of multiple meristems of soybean: Novel and alternative transcripts, evolutionary and functional implications. BMC Plant Biol. 2014;14:169. doi: 10.1186/1471-2229-14-169. [DOI] [PMC free article] [PubMed] [Google Scholar]
- 18.Ashburner M, Ball CA, Blake JA, Botstein D, Butler H, Cherry JM, Davis AP, Dolinski K, Dwight SS, Eppig JT, et al. Gene ontology: Tool for the unification of biology. The gene ontology consortium. Nat Genet. 2000;25:25–29. doi: 10.1038/75556. [DOI] [PMC free article] [PubMed] [Google Scholar]
- 19.Kanehisa M, Goto S. KEGG: Kyoto encyclopedia of genes and genomes. Nucleic Acids Res. 2000;28:27–30. doi: 10.1093/nar/28.1.27. [DOI] [PMC free article] [PubMed] [Google Scholar]
- 20.Szklarczyk D, Franceschini A, Kuhn M, Simonovic M, Roth A, Minguez P, Doerks T, Stark M, Muller J, Bork P, et al. The STRING database in 2011: Functional interaction networks of proteins, globally integrated and scored. Nucleic Acids Res. 2011;39(Database Issue):D561–D568. doi: 10.1093/nar/gkq973. [DOI] [PMC free article] [PubMed] [Google Scholar]
- 21.Shannon P, Markiel A, Ozier O, Baliga NS, Wang JT, Ramage D, Amin N, Schwikowski B, Ideker T. Cytoscape: A software environment for integrated models of biomolecular interaction networks. Genome Res. 2003;13:2498–2504. doi: 10.1101/gr.1239303. [DOI] [PMC free article] [PubMed] [Google Scholar]
- 22.Wang J, Duncan D, Shi Z, Zhang B. WEB-based gene set analysis toolkit (WebGestalt): Update 2013. Nucleic Acids Res. 2013;41(Web Server Issue):W77–W83. doi: 10.1093/nar/gkt439. [DOI] [PMC free article] [PubMed] [Google Scholar]
- 23.Zhang B, Kirov S, Snoddy J. WebGestalt: An integrated system for exploring gene sets in various biological contexts. Nucleic Acids Res. 2005;33(Web Server Issue):W741–W748. doi: 10.1093/nar/gki475. [DOI] [PMC free article] [PubMed] [Google Scholar]
- 24.Dweep H, Gretz N. miRWalk2.0: A comprehensive atlas of microRNA-target interactions. Nat Methods. 2015;12:697. doi: 10.1038/nmeth.3485. [DOI] [PubMed] [Google Scholar]
- 25.Huang DW, Sherman BT, Tan Q, Kir J, Liu D, Bryant D, Guo Y, Stephens R, Baseler MW, Lane HC, Lempicki RA. DAVID bioinformatics resources: Expanded annotation database and novel algorithms to better extract biology from large gene lists. Nucleic Acids Res. 2007;35(Web Server Issue):W169–W175. doi: 10.1093/nar/gkm415. [DOI] [PMC free article] [PubMed] [Google Scholar]
- 26.Jeyaseelan K, Lim KY, Armugam A. MicroRNA expression in the blood and brain of rats subjected to transient focal ischemia by middle cerebral artery occlusion. Stroke. 2008;39:959–966. doi: 10.1161/STROKEAHA.107.500736. [DOI] [PubMed] [Google Scholar]
- 27.Turczyńska KM, Hellstrand P, Swärd K, Albinsson S. Regulation of vascular smooth muscle mechanotransduction by microRNAs and L-type calcium channels. Commun Integr Biol. 2013;6:e22278. doi: 10.4161/cib.22278. [DOI] [PMC free article] [PubMed] [Google Scholar]
- 28.Raverot G, Wierinckx A, Dantony E, Auger C, Chapas G, Villeneuve L, Brue T, Figarella-Branger D, Roy P, Jouanneau E, et al. Prognostic factors in prolactin pituitary tumors: clinical, histological, and molecular data from a series of 94 patients with a long postoperative follow-up. J Clin Endocrinol Metab. 2010;95:1708–1716. doi: 10.1210/jc.2009-1191. [DOI] [PubMed] [Google Scholar]
- 29.Kontogeorgos G. Predictive markers of pituitary adenoma behavior. Neuroendocrinology. 2006;83:179–188. doi: 10.1159/000095526. [DOI] [PubMed] [Google Scholar]
- 30.Bahar A, Bicknell JE, Simpson DJ, Clayton RN, Farrell WE. Loss of expression of the growth inhibitory gene GADD45 gamma, in human pituitary adenomas, is associated with CpG island methylation. Oncogene. 2004;23:936–944. doi: 10.1038/sj.onc.1207193. [DOI] [PubMed] [Google Scholar]
- 31.Quereda V, Malumbres M. Cell cycle control of pituitary development and disease. J Mol Endocrinol. 2009;42:75–86. doi: 10.1677/JME-08-0146. [DOI] [PubMed] [Google Scholar]
- 32.Chesnokova V, Melmed S. Pituitary senescence: The evolving role of Pttg. Mol Cell Endocrinol. 2010;326:55–59. doi: 10.1016/j.mce.2010.02.012. [DOI] [PMC free article] [PubMed] [Google Scholar]
- 33.Fedele M, Palmieri D, Fusco A. HMGA2: A pituitary tumour subtype-specific oncogene? Mol Cell Endocrinol. 2010;326:19–24. doi: 10.1016/j.mce.2010.03.019. [DOI] [PubMed] [Google Scholar]
- 34.Butz H, Likó I, Czirják S, Igaz P, Khan MM, Zivkovic V, Bálint K, Korbonits M, Rácz K, Patócs A. Down-regulation of Wee1 kinase by a specific subset of microRNA in human sporadic pituitary adenomas. J Clin Endocrinol Metab. 2010;95:E181–E191. doi: 10.1210/jc.2010-0581. [DOI] [PubMed] [Google Scholar]
- 35.Amaral FC, Torres N, Saggioro F, Neder L, Machado HR, Silva WA, Jr, Moreira AC, Castro M. MicroRNAs differentially expressed in ACTH-secreting pituitary tumors. J Clin Endocrinol Metab. 2009;94:320–323. doi: 10.1210/jc.2008-1451. [DOI] [PubMed] [Google Scholar]
- 36.Palumbo T, Faucz FR, Azevedo M, Xekouki P, Iliopoulos D, Stratakis CA. Functional screen analysis reveals miR-26b and miR-128 as central regulators of pituitary somatomammotrophic tumor growth through activation of the PTEN-AKT pathway. Oncogene. 2013;32:1651–1659. doi: 10.1038/onc.2012.190. [DOI] [PMC free article] [PubMed] [Google Scholar]
- 37.Sachdeva M, Mo YY. miR-145-mediated suppression of cell growth, invasion and metastasis. Am J Transl Res. 2010;2:170–180. [PMC free article] [PubMed] [Google Scholar]
- 38.Lauss M, Kriegner A, Vierlinger K, Noehammer C. Characterization of the drugged human genome. Pharmacogenomics. 2007;8:1063–1073. doi: 10.2217/14622416.8.8.1063. [DOI] [PubMed] [Google Scholar]


