Abstract
The prognostic value of minimal residual disease (MRD) in Philadelphia-chromosome-positive (Ph+) childhood acute lymphoblastic leukemia (ALL) treated with tyrosine kinase inhibitors is not fully established. We detected MRD by real-time quantitative polymerase chain reaction (RQ-PCR) of rearranged immunoglobulin/T-cell receptor genes (IG/TR) and/or BCR/ABL1 fusion transcript to investigate its predictive value in patients receiving Berlin-Frankfurt-Münster (BFM) high-risk (HR) therapy and post-induction intermittent imatinib (the European intergroup study of post-induction treatment of Philadelphia-chromosome-positive acute lymphoblastic leukemia (EsPhALL) study). MRD was monitored after induction (time point (TP)1), consolidation Phase IB (TP2), HR Blocks, reinductions, and at the end of therapy. MRD negativity progressively increased over time, both by IG/TR and BCR/ABL1. Of 90 patients with IG/TR MRD at TP1, nine were negative and none relapsed, while 11 with MRD<5×10⁻⁴ and 70 with MRD≥5×10⁻⁴ had a comparable 5-year cumulative incidence of relapse of 36.4 (15.4) and 35.2 (5.9), respectively. Patients who achieved MRD negativity at TP2 had a low relapse risk (5-yr cumulative incidence of relapse (CIR)=14.3[9.8]), whereas those who attained MRD negativity at a later date showed higher CIR, comparable to patients with positive MRD at any level. BCR/ABL1 MRD negative patients at TP1 had a relapse risk similar to those who were IG/TR MRD negative (1/8 relapses). The overall concordance between the two methods is 69%, with significantly higher positivity by BCR/ABL1. In conclusion, MRD monitoring by both methods may be functional not only for measuring response but also for guiding biological studies aimed at investigating causes for discrepancies, although from our data IG/TR MRD monitoring appears to be more reliable. Early MRD negativity is highly predictive of favorable outcome. The earlier MRD negativity is achieved, the better the prognosis.
Introduction
The t(9;22)(q34;q11) translocation resulting in the Philadelphia chromosome (Ph) occurs in about 3% of children with ALL.1,2 In the past, this translocation was consistently associated with poor outcome, with a 5-year event-free survival (EFS) of 40%, despite intensive chemotherapy regimens and allogeneic hematopoietic stem cells transplantation (HSCT).3,4 The introduction of tyrosine kinase inhibitors (TKI) has markedly improved outcome, but relapse remains the main cause of treatment failure.5–8
Several studies have shown that detection of MRD by IG/TR somatic rearrangements is a strong and independent prognostic factor in all subgroups of childhood ALL, including Ph+ ALL treated with conventional chemotherapy.9–11 In this context, whether BCR/ABL1 could be a more appropriate MRD marker for pediatric Ph+ ALL is still a matter of debate. Moreover, data on the predictive value of early MRD response in Ph+ ALL treated with TKIs is limited or inconclusive.5–8 Therefore, it remains relevant to compare MRD based on a clonospecific marker versus the oncogenic marker (BCR-ABL1) in patients treated with TKIs.
In the intergroup EsPhALL study, imatinib was started after the first induction phase, which lasted from five to seven weeks, depending on national frontline protocols, and administered intermittently thereafter until the beginning of the maintenance phase. Most patients, however, underwent HSCT before reinduction therapy.8
Herein, we report the results of molecular MRD monitoring based on IG/TR and/or BCR/ABL1 transcript as PCR markers and their predictive value in patients treated with imatinib in the EsPhALL study.
Methods
Study population
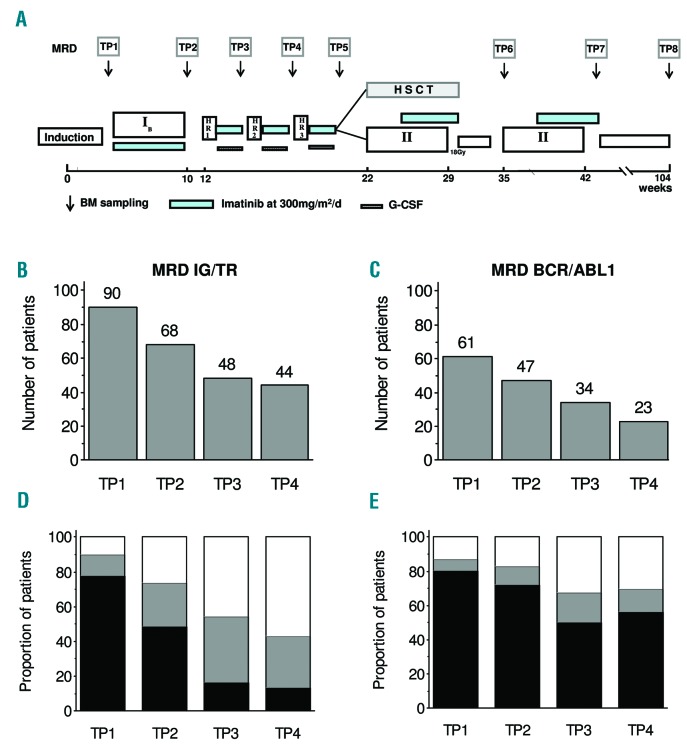
Between January 2004 and December 2009, 160 Ph+ ALL patients were enrolled into the EsPhALL study (EudraCT 2004-001647-30 and clinicaltrials.gov Identifier: 00287105) in the centers of ten national study groups, which obtained approval from their Institutional Review Boards. Written informed consent to participate in the study was provided for all patients by parents or legal guardians. Treatment details and outcome have already been published.7 As described, patients defined as good-risk (GR; good response to prednisone at day eight, or ≤25% bone marrow (BM) blast cells at day 15, or ≤5% BM blast cells at day 21, and in complete remission at the end of induction) were randomized to receive imatinib or not, whereas those defined as poor-risk (PR) were given imatinib intermittently during intensive therapeutic phases, for a total of 18 weeks for patients treated with chemotherapy only. The duration of treatment with imatinib was shorter (usually ten weeks) in the 80% of patients who underwent HSCT, but some patients received imatinib post-HSCT as per institutional policies. Overall, 128 patients received imatinib. An ancillary study was conducted to assess the predictive value of MRD detection by RQ-PCR analysis of both IG/TR genes and/or by BCR/ABL1 transcript at each BM aspiration, i.e., at the beginning of each treatment phase and before HSCT, as shown in Figure 1A. No clinical decision was based on MRD. Here follows our report on the MRD results in patients who received imatinib. MRD at TP1 (day 33 of treatment) was available for 90 and 61 patients for IG/TR and BCR/ABL1, respectively. Among the 90 patients with IG/TR MRD data at TP1, 51 (56.7%) of them were PR, representing 72.9% of PR patients treated with imatinib (51/70). No difference in outcome by MRD availability at TP1 was observed.7 In the report herein, subsequent time points, namely TP2 (day 78 of treatment), TP3 (day 120) and TP4 (day 141) were included only if patients had MRD evaluations at all previous time points (Figure 1B,C).
Figure 1.
EsPhALL treatment schema and MRD results. EsPhALL treatment schema with minimal residual disease (MRD) sampling time points (time point, panel A). Sample size at different follow-up time points, by IG/TR (panel B) and BCR/ABL1 (panel C). MRD load at different follow-up time points, by IG/TR (panel D) and BCR/ABL1 (panel E): MRD negative (white), low positive (<5×10⁻⁴, gray) and highly positive (≥5×10⁻⁴, black). BM: bone marrow; HSCT: hematopoietic stem cells transplantation; IG/TR: immunoglobulin/T-cell receptor; G-CSF: granulocyte-colony stimulating factor.
MRD methodology
In each national reference laboratory, diagnostic DNA samples obtained from BM mononuclear cells at diagnosis were screened by PCR amplification for somatic gene rearrangements as per laboratory specific strategy, within the frame of the Euro-MRD. Briefly, after identifying patient-specific IG/TR junctional region sequences, complementary allele-specific oligonucleotide primers were designed, and PCR-MRD targets were tested for specificity and sensitivity. Quantitative PCR analysis was performed and interpreted according to the guidelines developed within the Euro-MRD network.11,12 In contrast to the corresponding serial dilution standard curve, a quantitative range (QR) for each marker was defined as the lowest dilution which gave a specific and reproducible amplification (DeltaCT of all replicates less than or equal to 1.5; all cycle threshold (CT) values at least 1.0 Ct less than the lowest CT value of the amplification observed in normal mononuclear cell (MNC) DNA). Moreover, the mean CT value had to be within a range defined by the mean CT value of the previous dilution point: 2.6–4.0 CT between 10-fold dilutions (e.g., 10-3 vs. 10−4), and 0.5–1.5 CT between 2-fold dilutions (e.g,. 10-3 vs. 5 times 10−4).
The majority of national referral laboratories for BCR/ABL1 monitoring followed the protocol recommended by the Europe Against Cancer (EAC) consortium.13 All laboratories participated in the development of guidelines for the interpretation of BCR/ABL1 RQ-PCR data, and participated in annual quality control rounds in the frame of EuroMRD (Pfeifer H. et al., unpublished observations). Briefly, a standard curve was produced by plasmid dilutions in order to define a QR, similarly to that for IG/TR (see above). A sample was termed ‘positive’ if at least one replicate was positive, and it was quantified if the PCR amplification was within the QR; any MRD-positive sample outside the quantitative range was scored as ‘positive not quantifiable’ (i.e., below the value of the QR). A sample was defined as ‘negative’ when all replicates were negative with at least 10000 ABL1 copies detected. The ratio between BCR/ABL1 to 10000 ABL1 copies was calculated at diagnosis and at each follow-up time point. The MRD value of each follow-up sample was calculated as the logarithmic reduction with respect to the diagnostic value.
The concordance between IG/TR and BCR/ABL1 results were assessed within the cohort of patients in whom MRD was measured with both methodologies. Results were considered discordant in the case of at least one log difference if both transpired to be positive; in the case of a negative result by only one of the two methodologies, results were considered discordant if the difference between the positive result and the sensitivity (QR) of the negative one was more than one log (although this could overestimate concordance).
Statistical analysis
EFS was calculated as the time from start of EsPhALL treatment (i.e., Phase IB) to first failure, defined as resistance, relapse, death from any cause, or second malignant neoplasm (SMN). Observation periods were censored at date of last contact when no event was observed. The final follow-up was on June 30, 2014 and the median follow-up time was 6.4 years (range: 0.2 – 10.4). EFS curves were estimated according to Kaplan-Meier (with Greenwood standard error) and compared with the log-rank test. The Cox model, including MRD at TP2 (positive vs. negative) and EsPhALL risk stratification (GR vs. PR) was used for multivariate analysis. CIR was estimated adjusting for competing risks of other events and compared with the Gray test.14 The two methodologies used for MRD measurement were compared using the Bland-Altman approach for analyses of agreement between two different assays.15 The differences between the two log-transformed measures on each subject were plotted against their average value. After excluding any dependence, the 95% range for the difference, calculated from twice the standard deviation and the hypothesis of zero mean difference (bias), was examined with a paired t-test. All tests were two-sided. All analyses were performed with SAS software (version 9.2).
Results
Overall, the 5-year EFS (standard error [SE]) of 128 EsPhALL patients who received imatinib was 62.0 (4.3). Of note, all patients eventually achieved first complete remission (CR1) by the end of HR Block3. The outcome of 108 (84%) transplanted and 20 (16%) non-transplanted patients is described in Online Supplementary Table S1. The size of each cohort of patients with available MRD data by methodology and BM time point is shown in Figure 1. In a cascade order, patients who had TP1, the first two time points, the first three time points, or all four time points (TP1, TP2, TP3 and TP4) decreased progressively from 90 to 44 for IG/TR MRD (Figure 1B) and from 61 to 23 for BCR/ABL1 MRD (Figure 1C). The distribution of patients as MRD negative (with QR of at least 1×10⁻⁴), MRD low positive (<5×10⁻⁴) and MRD highly positive (i.e., ≥5×10⁻⁴) is shown in Figure 1D,E. As expected, MRD negativity increased progressively, from 10% at TP1 to 57% at TP4 by IG/TR (Figure 1D) and from 13% at TP1 to 30% at TP4, by BCR/ABL1 (Figure 1E).The proportion of patients with highly positive MRD decreased from 78% to 14% and from 80% to 57% at TP1 to TP4 with IG/TR and BCR/ABL1 techniques, respectively. The probability of IG/TR negativity at any time point was higher in patients classified as GR vs. those at PR, 18% vs. 4%, respectively, at TP1 (before any exposure to imatinib, P=0.0368), 39% vs. 16% at TP2 (after exposure to imatinib during Protocol IB, P=0.0533), 60% vs. 36% (P=0.1429) at TP3, and 70% vs. 46% at TP4 (P=0.1350; Online Supplementary Figure S1A,C). Corresponding figures for BCR/ABL1 were 25% vs. 3%, 37% vs. 4%, 60% vs. 10% and 50% vs. 20%, respectively (Online Supplementary Figure S1B,D). Among the 90 patients with TP1 available for IG/TR, 51 carried the p190 BCR/ABL1 variant, 6 carried that of p210, while for the remaining 33 patients the variant was unknown; concerning the 61 patients with BCR/ABL1 monitored at TP1, the same distribution was 41, 7, and 13, respectively.
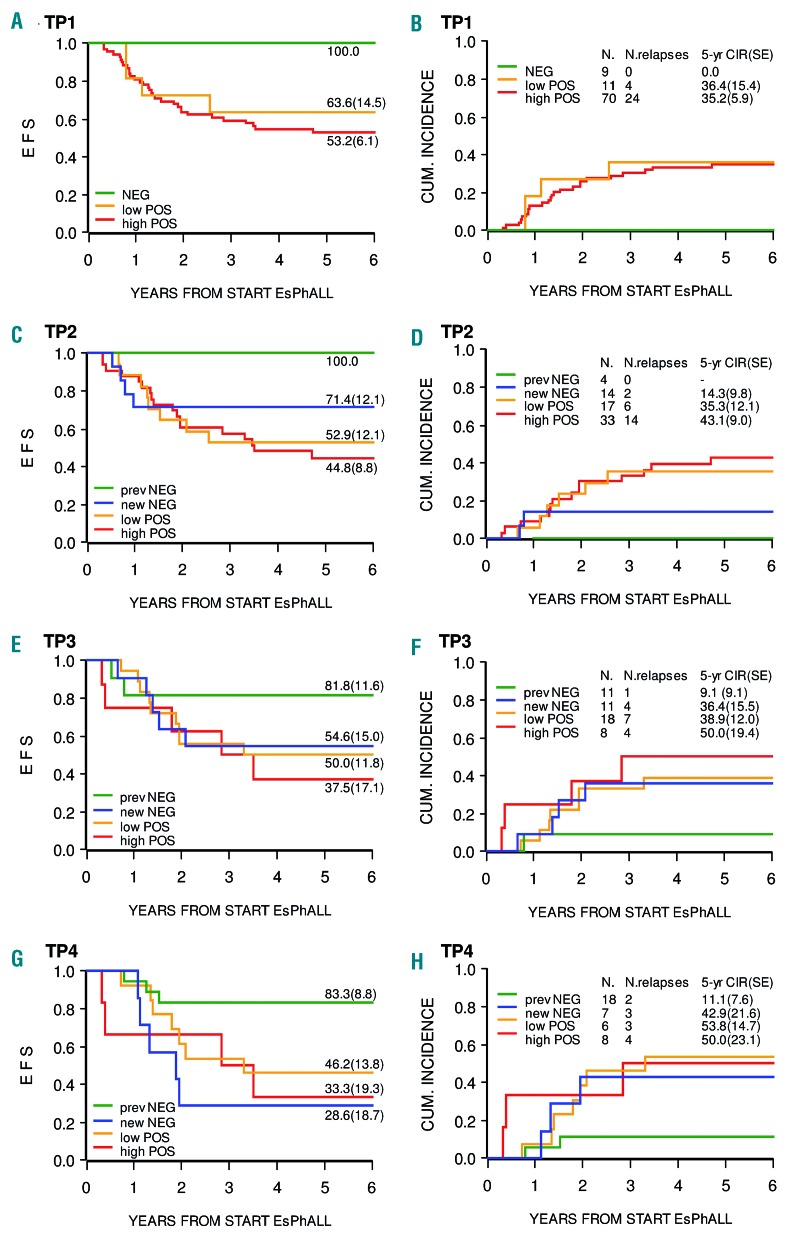
Figure 2 shows the impact of MRD levels measured by IG/TR PCR on EFS and CIR at TP1, TP2, TP3, and TP4, respectively. Ninety patients were tested at TP1 (Figure 2A,B). The minority of patients who were MRD negative (N=9, 10%) had a favorable outcome with no relapses, whereas patients with high or low MRD positivity had similar 5-year CIR (SE) of 35.2 (5.9) and 36.4 (15.4), respectively. The difference in CIR between MRD negative and positive patients was significant (0.0 vs. 35.3 (5.4), P=0.0368). With respect to TP2, TP3 and TP4, the outcome of patients who achieved negativity at the respective time point (new negative) was analyzed separately from the outcome of those who achieved negativity earlier on. As shown, MRD negativity at TP2 (N=14, Figure 2C,D), in both GR and PR patients, is associated with low risk of relapse (two relapses, 5-year CIR (SE) 14.3 [9.8]), while the four patients who had achieved negativity at TP1 did not present relapses. Achieving negativity at TP3 or TP4 is associated with a CIR of 36.4 (15.5) and 42.9 (21.6), respectively, comparable to that of patients with low or high positivity at any time point. In a multivariate analysis adjusting for risk group stratification, MRD negativity within TP2 was associated with a non-statistically significant reduced risk of failure as compared to positivity at any level (hazard ratio (HR)=0.50, 95%CI (0.19 – 1.38), P=0.1811).
Figure 2.
Event-free survival and cumulative incidence of relapse according to IG/TR MRD levels. Event-free survival (EFS; panels A, C, E and G) and cumulative incidence of relapse (CIR; panels B, D, F and H) according to IG/TR MRD levels at time points 1 through 4 (TP1-TP4). At TP1, there were seven good-risk and two poor-risk (panel B) negative patients with no relapses. At TP2, among the 14 new negative patients, nine were good-risk (1 relapse) and five were poor-risk (1 relapse). CUM: cumulative; EsPhALL: European intergroup study of post-induction treatment of Philadelphia-chromosome-positive acute lymphoblastic leukemia; SE: standard error.
Table 1 shows the kinetics of MRD levels from TP1 to TP2 in 68 patients with IG/TR evaluation at both time points. Out of ten cases with low MRD at TP1, 7 (70%) became negative at TP2, while in patients with high MRD, only 7 out of 54 (13%) became negative.
Table 1.
Distribution of patients according to IG/TR MRD levels at TP1 and TP2.
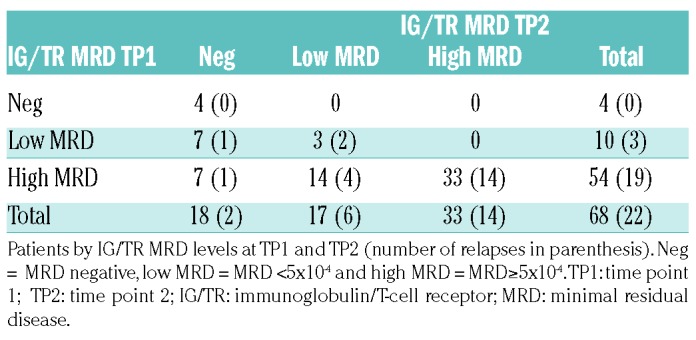
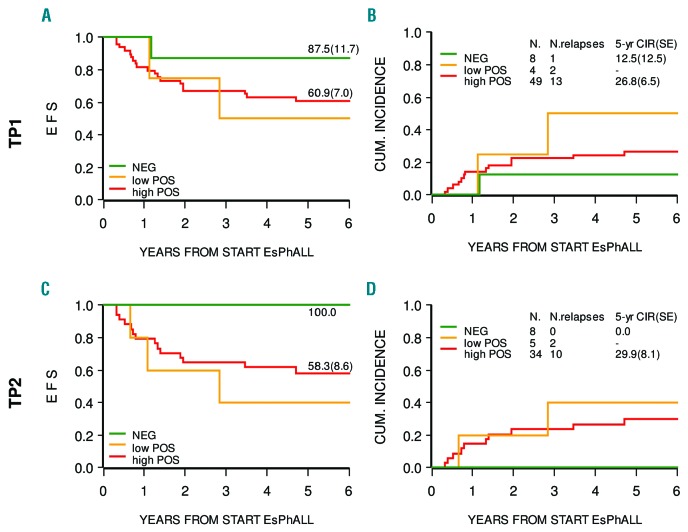
Figure 3 shows that BCR/ABL1 MRD negativity at TP1 or TP2, although based on small numbers, is reached less frequently when compared with IG/TR MRD, but is associated with a similar very low risk of relapse (only one relapse in eight MRD patients negative at TP1). Patients with low or high positivity have, however, a high risk of relapse, again similar to that observed for positive IG/TR MRD. At subsequent time points, the number of patients for which BCR/ABL1 MRD data are available is too small to allow us to draw any conclusions.
Figure 3.
Event-free survival and cumulative incidence of relapse according to BCR/ABL1 MRD levels. Event-free survival (EFS; panels A, C) and cumulative incidence of relapse (CIR; panels B, D) according to BCR/ABL1 MRD levels at time points 1 (TP1) and 2 (TP2). The patient who was negative at TP1 and relapsed is not represented at TP2 because their MRD at this time point was not available. At TP2 only three patients were ‘new negative’. CUM: cumulative; EsPhALL: European intergroup study of post-induction treatment of Philadelphia-chromosome-positive acute lymphoblastic leukemia; SE: standard error.
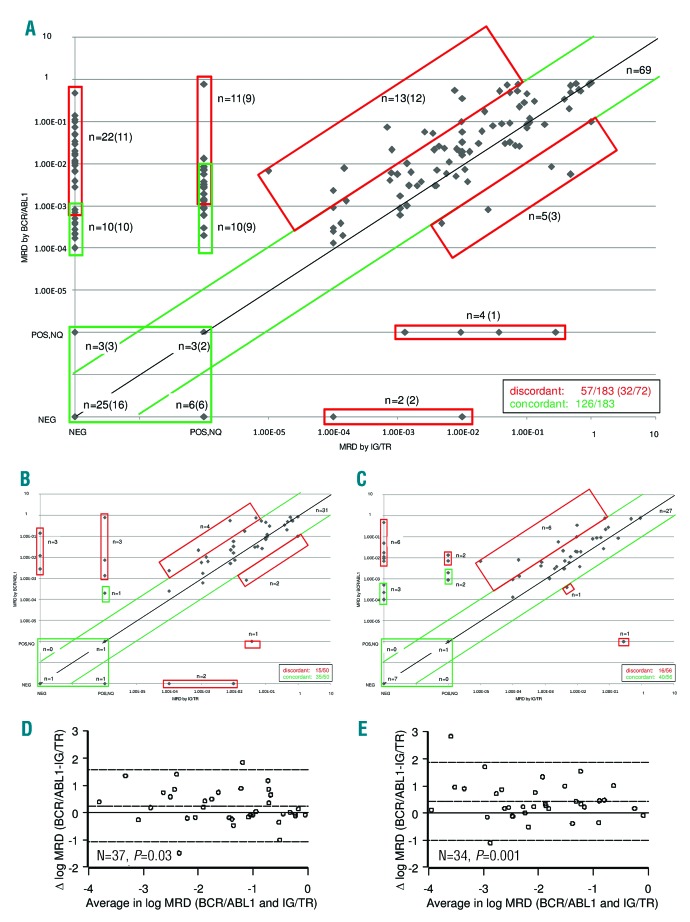
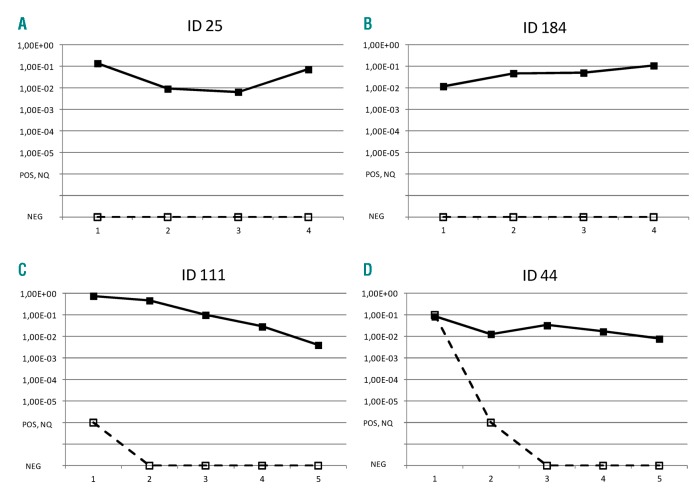
The comparison between MRD sample values obtained by IG/TR vs. BCR/ABL1 is shown in Table 2 and Figure 4. The overall level of concordance is 69% (Table 2 and Figure 4A). The concordance rate between sample values at each time point (see Figure 4B,C for TP1 and TP2, respectively) were similar, ranging from 65% at TP3 to 71% at TP2 (Table 2). For patients with positive MRD by both techniques, where an adequate number of samples were available, we closely examined the differences between the two methods using the Bland-Altman algorithm for TP1 and TP2 (Figure 4D,E). Following logarithmic transformation, the estimated mean differences of BCR/ABL1 versus IG/TR results were significantly greater than zero at both time points (P=0.03 and P=0.001 at TP1 and TP2, respectively), signifying that the BCR/ABL1 value tended to be higher than the IG/TR (the estimated average difference was 0.25 (SD 0.66) at TP1, and 0.43 (SD 0.73) at TP2). There were also four patients who were negative by IG/TR but positive at low or high level by BCR/ABL1, as shown by the individual patterns in Figure 5. Two of these patients were negative by IG/TR at TP1, TP2, TP3, and TP4 (Figure 5A,B), and the remaining two became negative either at TP2 (Figure 5C) or TP3 (Figure 5D), and remained negative thereafter. All received HSCT in CR1, and only the patient in panel C relapsed. No cases with persistently negative BCR/ABL1 and positive IG/TR were observed.
Table 2.
MRD detection by methodology at each time point.
Figure 4.
Overall concordance of IG/TR vs. BCR/ABL1 MRD. Scatterplot of IG/TR- and BCR/ABL1-based minimal residual disease (MRD) sample values on the logarithmic scale. Positive samples with MRD below the quantitative range (‘positive, not quantifiable’ – POS, NQ) were conventionally represented with 10−6; MRD negative samples are labeled with NEG. The black diagonal line represents the exact agreement; the area within the green lines includes concordant samples with acceptable agreement, defined as less than 1 log difference between the two measurements. Red boxes include discrepant cases, while green boxes include cases with either ‘POS,NQ’ or ‘NEG’ results via at least one of the two methods, for which assessment of concordance was based on sensitivity. n=number of samples; numbers of patients are indicated in parenthesis. Panel A includes all samples for all patients, while panels B–D and C–E show only samples at TP1 and TP2, respectively. Panel D and E show the comparison of MRD measurements by IG/TR and BCR/ABL1 according to Bland-Altman, with the continuous line representing zero difference, and the dashed line representing the estimated mean difference ±2 SD. Among ten IG/TR negative and BCR/ABL1 positive patients (who were concordant according to the definition above), seven carried the p190 fusion protein, one carried the p210 fusion protein and two did not have this information available. The fusion protein detected in nine IG/TR POS<QR and BCR/ABL1 positive patients (who were concordant according to the definition above) was p190 in eight patients, and not known in the remaining patient. IG/TR: immunoglobulin/T-cell receptor.
Figure 5.
MRD in discordant cases. MRD pattern from TP1 through TP4 (or TP5 if available) of four patients with persistently discordant results by IG/TR (dashed lines) and BCR/ABL1 (continuous lines). Patients identified with ID 184, ID 111 and ID 44 carried the p190 variant protein; for patient ID 25, this information was not available.
Discussion
Ph+ ALL in pediatric age is very rare, occurring in only 3% of cases, thus intergroup studies are needed to continue investigations into this ALL subtype.1 The predictive value of MRD response in children with Ph+ ALL treated with TKIs is still unknown. A recent study reporting on solely nine children with Ph+ ALL showed that TKIs added to chemotherapy allowed for a marked increase in the rate of patients with negative MRD and improved outcome as compared to patients treated with chemotherapy alone.16 In adult patients treated with TKIs it has been reported that MRD negativity before HSCT in CR1, and its persistence following HSCT, are associated with a significantly better outcome.17–22
EsPhALL was one of the first studies to introduce imatinib in childhood Ph+ ALL treated with a BFM-type therapy,7 and the results reported herein on MRD monitoring provide novel information on the relevance and prognostic impact of MRD response. An earlier study conducted by the Children’s Oncology Group (COG) analyzed the prognostic impact of MRD;8 their results suggested that a better MRD response was associated with a more favorable outcome, but the difference was not statistically significant, probably due to the small number of patients investigated.
In our study, data are available on a relatively large number of patients after induction (TP1) and consolidation (TP2) phases, as well as after the two blocks of intensification therapy (TP3 and TP4).
The probability of achieving MRD negativity at early time points was predominantly lower than in other populations of BCP-ALL, in keeping with previous reports.9 This probability was higher in EsPhALL patients who qualified as GR vs. PR: for instance, at TP2 after exposure to imatinib in consolidation phase IB, MRD negativity was 39% vs. 16% when measured by IG/TR (P=0.0533) and of 37% vs. 4% by BCR/ABL1 (P=0.0047). Of note, the definition of MRD negativity was herewith based on strict criteria, requiring a QR of at least 1×10⁻⁴. In a multivariate analysis, MRD negativity at TP2 was associated with a reduced risk of failure, yet was not considered statistically significant. Definitive conclusions on the role of MRD as an independent prognostic factor in this setting are difficult due to the limited sample size. These data suggest that traditional unfavorable prognostic criteria remain associated with less favorable MRD response and, as reported, with poorer final outcome.7 Without accounting for the kinetics of MRD levels across subsequent time points, MRD negativity at an early time point is associated with a low number of relapses, both in GR and PR patients (Online Supplementary Figure S1). In our experience, the 5-year CIR was very low for patients achieving MRD negativity subsequent to either induction or consolidation phases. When MRD negativity was obtained later (TP3 and TP4), CIR was instead quite high, and not different from that observed for positive MRD, suggesting that the earlier negative MRD is achieved, the lower the risk of relapse.
Taken together, our data suggest that BFM-type backbone chemotherapy defines two main subsets of children with Ph+ ALL, i.e., those who are capable of achieving molecular remission within TP2, and those who will achieve this result only at a later stage, or never, which will make little to no difference in terms of finding a possible cure and thus eradicating the disease.
MRD results based on BCR/ABL1 confirm that an early achievement of MRD negativity, i.e., at TP2, has a similar predictive value of MRD detected by IG/TR. However, no conclusions can be drawn on subsequent time points due to the small number of patients analyzed by BCR/ABL1. In this study, the IG/TR and BCR/ABL1 RT-PCR methodologies for MRD detection were compared for the first time in a relatively large and multicentric setting. We showed that BCR/ABL1 MRD levels tend to be higher than those based on IG/TR at any time point; as a consequence, the proportion of patients achieving MRD negativity by BCR/ABL1 is lower when compared to IG/TR (i.e., 30% vs. 57% at TP4). Moreover, there are several discrepant samples (31%) in the majority of cases which had a higher MRD level by BCR/ABL1 than that by IG/TR. This is in keeping with a previous single-center report on 17 childhood ALL patients,23 and a more recent report from the same group,24 wherein 20% and 23% of samples were BCR/ABL1-positive and IG/TR-negative, respectively. Interestingly, the testing of cell-sorted hematopoietic subpopulations at diagnosis of patients with discrepant MRD results revealed BCR-ABL1-positivity in non–ALL B lymphocytes, T cells, and/or myeloid cells. This indicates the multilineage involvement of the BCR-ABL1-positive clone in some patients diagnosed with BCR-ABL1-positive ALL, in which a multipotent hematopoietic progenitor might have been the target of the BCR-ABL1 translocation. These patients have a BCR-ABL1-positive clonal hematopoiesis resembling a chronic myeloid leukemia (CML) disease, although other features (i.e., lower white blood count (WBC) level at diagnosis and a lower proportion of non-B cells positive for BCR/ABL1 than in CML blast crisis) are different from typical CML, thus suggesting that those Ph+ ALL with discordant IG/TR vs. BCR/ABL1 MRD might represent a rare subgroup with a ‘CML-like’ feature.24
Whether this biological heterogeneity may have an impact on patient outcomes and optimal treatment (early stem cell transplantation SCT vs. continuous TKI therapy) as well as on MRD testing needs further prospective investigations in larger series. Of note, all of our four discordant patients with high BCR/ABL1 and negative IG/TR MRD levels (two of them with two IG/TR markers) at several consecutive time points received HSCT.
In addition, the evidence that t(9;22) is the primary, but not sufficient leukemogenic event, underlines the risk of monitoring pre-leukemic cells by BCR/ABL1 only.25 Thus, MRD monitoring by both methods may be functional for both measuring response and guiding biological studies aimed at investigating the causes of discrepancies; from our data IG/TR MRD monitoring appears to be more reliable.
In conclusion, the present study in a large multicenter series of children with Ph+ ALL indicates, for the first time, that MRD is also highly predictive of prognosis in the context of treatment with imatinib and HSCT, and in particular, that early negativity is strongly associated with good prognosis. On the contrary, clearance of MRD after TP2 did not show a prognostic impact on CIR, which is a useful indication for the design of future trials as it suggests that reliable clinical decisions, particularly regarding indications of individual treatment intensification, may be made in a timely and safe fashion based on the TP2 results of the patients.
It would be challenging to investigate whether these findings will be confirmed in the current protocols, where a lower proportion of patients is undergoing HSCT and imatinib is administered earlier and continuously. If so, MRD monitoring could be used to refine clinical decisions, including how to optimize the use of TKIs and whether to perform HSCT.
Supplementary Material
Acknowledgments
We thank Jacques Van Dongen as a Chair of the EuroMRD network and Heike Pfeifer as a leader of the Ph+ALL branch of EuroMRD, Jocelyne Vivent for data management of French patients, and all technicians from the referral laboratories, doctors from all Centers and all patients
Footnotes
Check the online version for the most updated information on this article, online supplements, and information on authorship & disclosures: www.haematologica.org/content/103/1/107
Funding
This project was partially funded by the following grants: Italian Association for Cancer Research (AIRC, to GC and AB), AIRC 2013-14634 (to MGV), grants from the Ministry of Health of the Czech Republic #16-30186A (Czech Health Research Council) and #00064203 (University Hospital Motol) (to JZ and JS), the “Programme Hospitalier de Recherche Clinique” (PHRC) and the association “Enfants et Santé” (to HC and VG). MRD was supported by Bloodwise and trial management by Cancer Research UK; VS is a Margdarshi Fellow of the Wellcome-DBT India Alliance.
References
- 1.Pui CH, Evans WE. Treatment of acute lymphoblastic leukemia. N Engl J Med. 2006;354(2):166–178. [DOI] [PubMed] [Google Scholar]
- 2.Schrappe M, Camitta B, Pui CH, et al. Long-term results of large prospective trials in childhood acute lymphoblastic leukemia. Leukemia. 2000;14(12):2193–2320. [DOI] [PubMed] [Google Scholar]
- 3.Aricò M, Schrappe M, Hunger SP, et al. Clinical outcome of children with newly diagnosed Philadelphia chromosome-positive acute lymphoblastic leukemia treated between 1995 and 2005. J Clin Oncol. 2010; 28(31):4755–4761. [DOI] [PMC free article] [PubMed] [Google Scholar]
- 4.Aricò M, Valsecchi MG, Camitta B, et al. Outcome of treatment in children with Philadelphia chromosome-positive acute lymphoblastic leukemia. N Engl J Med. 2000;342(14):998–1006. [DOI] [PubMed] [Google Scholar]
- 5.Schultz KR, Bowman WP, Aledo A, et al. Improved early event-free survival with imatinib in Philadelphia chromosome-positive acute lymphoblastic leukemia: a children’s oncology group study. J Clin Oncol. 2009;27(31):5175–5181. [DOI] [PMC free article] [PubMed] [Google Scholar]
- 6.Slayton WB, Schultz KR, Jones T, et al. Continuous dose dasatinib is safe and feasible in combination with intensive chemotherapy in pediatric Philadelphia chromosome positive acute lymphoblastic leukemia (Ph+ ALL): Children’s Oncology Group (COG) trial AALL0622. Blood. 2012; 120(21):137. [Google Scholar]
- 7.Biondi A, Schrappe M, De Lorenzo P, et al. Imatinib after induction for treatment of children and adolescents with Philadelphia-chromosome-positive acute lymphoblastic leukaemia (EsPhALL): a randomised, open-label, intergroup study. Lancet Oncol. 2012;13(9):936–945. [DOI] [PMC free article] [PubMed] [Google Scholar]
- 8.Schultz KR, Carroll A, Heerema NA, et al. Long-term follow-up of imatinib in pediatric Philadelphia chromosome-positive acute lymphoblastic leukemia: Children’s Oncology Group Study AALL0031. Leukemia. 2014;28(7):1467–1471. [DOI] [PMC free article] [PubMed] [Google Scholar]
- 9.Conter V, Bartram CR, Valsecchi MG, et al. Molecular response to treatment redefines all prognostic factors in children and adolescents with B-cell precursor acute lymphoblastic leukemia: results in 3184 patients of the AIEOP-BFM ALL 2000 study. Blood. 2010;115(16):3206–3214. [DOI] [PubMed] [Google Scholar]
- 10.Schrappe M, Valsecchi MG, Bartram CR, et al. Late MRD response determines relapse risk overall and in subsets of childhood T-cell ALL: results of the AIEOP-BFM-ALL 2000 study. Blood. 2011;118(8):2077–2084. [DOI] [PubMed] [Google Scholar]
- 11.Flohr T, Schrauder A, Cazzaniga G, et al. Minimal residual disease-directed risk stratification using real-time quantitative PCR analysis of immunoglobulin and T-cell receptor gene rearrangements in the international multicenter trial AIEOP-BFM ALL 2000 for childhood acute lymphoblastic leukemia. Leukemia. 2008;22(4):771–782. [DOI] [PubMed] [Google Scholar]
- 12.Van der Velden VH, Cazzaniga G, Schrauder A, et al. Analysis of minimal residual disease by Ig/TCR gene rearrangements: guidelines for interpretation of real-time quantitative PCR data. Leukemia. 2007;21(4):604–611. [DOI] [PubMed] [Google Scholar]
- 13.Gabert J, Beillard E, van der Velden VH, et al. Standardization and quality control studies of ‘real–time’ quantitative reverse transcriptase polymerase chain reaction of fusion gene transcripts for residual disease detection in leukemia - a Europe Against Cancer program. Leukemia. 2003;17(12): 2318–2357. [DOI] [PubMed] [Google Scholar]
- 14.Fine JP, Gray RJ. A proportional hazards model for the subdistribution of a competing risk. J Am Stat Assoc. 1999;94(446):496–509. [Google Scholar]
- 15.Bland JM, Altman DG. Statistical methods for assessing agreement between two methods of clinical measurement. Lancet. 1986;1(8476):307–310. [PubMed] [Google Scholar]
- 16.Jeha S, Coustan-Smith E, Pei D, et al. Impact of tyrosine kinase inhibitors on minimal residual disease and outcome in childhood Philadelphia chromosome-positive acute lymphoblastic leukemia. Cancer. 2014;120(10):1514–1519. [DOI] [PMC free article] [PubMed] [Google Scholar]
- 17.Nishiwaki S, Imai K, Mizuta S, et al. Impact of MRD and TKI on allogeneic hematopoietic cell transplantation for Ph+ALL: a study from the adult ALL WG of the JSHCT. Bone Marrow Transplant. 2016; 51(1):43–50. [DOI] [PubMed] [Google Scholar]
- 18.Lee S, Kim DW, Cho B, et al. Risk factors for adults with Philadelphia-chromosome-positive acute lymphoblastic leukaemia in remission treated with allogeneic bone marrow transplantation: the potential of real-time quantitative reverse-transcription polymerase chain reaction. Br J Haematol. 2003;120(1):145–153. [DOI] [PubMed] [Google Scholar]
- 19.Yanada M, Sugiura I, Takeuchi J, et al. Prospective monitoring of BCR-ABL1 transcript levels in patients with Philadelphia chromosome-positive acute lymphoblastic leukaemia undergoing imatinib-combined chemotherapy. Br J Haematol. 2008; 143(4):503–510. [DOI] [PubMed] [Google Scholar]
- 20.Ottmann OG, Wassmann B, Pfeifer H, et al. GMALL Study Group. Imatinib compared with chemotherapy as front-line treatment of elderly patients with Philadelphia chromosome-positive acute lymphoblastic leukemia (Ph+ALL). Cancer. 2007; 109(10):2068–2076. [DOI] [PubMed] [Google Scholar]
- 21.Radich JP, Gehly G, Gooley T, et al. Polymerase chain reaction detection of the BCR-ABL fusion transcript after allogeneic marrow transplantation for chronic myeloid leukemia: results and implications in 346 patients. Blood. 1995; 85(9):2632–2638. [PubMed] [Google Scholar]
- 22.Stirewalt DL, Guthrie KA, Beppu L, et al. Predictors of relapse and overall survival in Philadelphia chromosome-positive acute lymphoblastic leukemia after transplantation. Biol Blood Marrow Transplant. 2003;9(3):206–212. [DOI] [PubMed] [Google Scholar]
- 23.Zaliova M, Fronkova E, Krejcikova K, et al. Quantification of fusion transcript reveals a subgroup with distinct biological properties and predicts relapse in BCR/ABL-positive ALL: implications for residual disease monitoring. Leukemia. 2009;23(5):944–951. [DOI] [PubMed] [Google Scholar]
- 24.Hovorkova L, Zaliova M, Venn NC, et al. Monitoring of childhood ALL using BCR-ABL1 genomic breakpoints identifies a subgroup with CML-like biology. Blood. 2017;129(20):2771–2781. [DOI] [PubMed] [Google Scholar]
- 25.Cazzaniga G, van Delft FW, Lo Nigro L, et al. Developmental origins and impact of BCR-ABL1 fusion and IKZF1 deletions in monozygotic twins with Ph+ acute lymphoblastic leukemia. Blood. 2011;118(20): 5559–5564. [DOI] [PMC free article] [PubMed] [Google Scholar]
Associated Data
This section collects any data citations, data availability statements, or supplementary materials included in this article.


