

Abstract
Neuroscience has a long history of inferring brain function by examining the relationship between brain injury and subsequent behavioral impairments. The primary advantage of this method over correlative methods is that it can tell us if a certain brain region is necessary for a given cognitive function. In addition, lesion-based analyses provide unique insights into clinical deficits. In the last decade, statistical voxel-based lesion behavior mapping (VLBM) emerged as a powerful method for understanding the architecture of the human brain. This review illustrates how VLBM improves our knowledge of functional brain architecture, as well as how it is inherently limited by its mass-univariate approach. A wide array of recently developed methods appear to supplement traditional VLBM. This paper provides an overview of these new methods, including the use of specialized imaging modalities, the combination of structural imaging with normative connectome data, as well as multivariate analyses of structural imaging data. We see these new methods as complementing rather than replacing traditional VLBM, providing synergistic tools to answer related questions. Finally, we discuss the potential for these methods to become established in cognitive neuroscience and in clinical applications.
Keywords: Lesion analysis, voxel-based lesion symptom mapping, VLSM, VLBM, mass-univariate, non-parametric mapping, multivariate, network, machine learning, neuropsychology, cognitive neurology, neuroanatomy, stroke, human
Introduction
Studies of pathological behavior following brain injury are an important source of theoretical knowledge regarding the function and anatomy of the healthy brain, i.e. regarding fundamental neuroscientific research questions that are usually addressed by lesion-behavior mapping. In the last decade, voxel-based lesion behavior mapping (VLBM) has become a driving force in cognitive and clinical neuroscience and offered new insights into the neuroanatomy of neurological symptoms. In the article’s first section, we will show how, compared to previous (out-dated) simple overlap methods, VLBM improves our knowledge of functional brain architecture. We will also discuss several potential limitations of VLBM; limitations primarily due to its mass-univariate approach that independently tests each brain voxel. They are related to familywise error rates and to inherent spatial bias due to physiological effects of brain lesion anatomy. We will address these concerns and reflect how they are best dealt with.
Univariate voxelwise lesion analysis methods have recently been supplemented by several other analysis techniques or imaging modalities methods (e.g., Zopf et al., 2012; Smith et al., 2013; Zhang et al., 2014; Boes et al., 2015; Zavaglia et al., 2015; Kuceyeski et al., 2016; Siegel et al., 2016; Yourganov et al., 2016; Martin et al., 2016; Griffis et al., 2017; Pustina et al., in press). The article’s second section will provide the reader with an overview of these new applications and, critically, discuss their potential utility in cognitive neuroscience and clinical applications. Some of these new approaches appear to compensate for the limitations of mass-univariate lesion methods. They seem to provide further insights into the anatomy of pathological behavior after stroke, particularly for cases in which cognitive functions are organized in brain networks. Moreover, emerging methods complement mass-univariate lesion methods in that they allow us to study topics of profound clinical significance. For example, they can be used to provide diagnosis and long-term prognosis in order to guide personalized therapy, provide realistic and individualized expectations for recovery, and provide accurate counterbalancing of expected recovery for clinical trials.
1. Voxel-based lesion behavior mapping (VLBM)
Neurology has a long history of inferring brain function based on impairments observed following brain injury. In many respects this role has been superseded by recent noninvasive methods for measuring the functioning of the healthy brain. On the other hand, investigating brain disruption allows researchers to make stronger claims regarding brain function: identifying areas that are required rather than merely involved with a task (for review Rorden and Karnath, 2004). Much of the foundational works regarding the anatomy underlying human spanning emotions, episodic memory, language production, visual perception, planning, or attention rely on the observations from single patients or small group studies (Code et al., 1996, 2003). While early studies could only examine the location of injury following the death of the patient, more recent studies leveraged brain imaging to noninvasively visualize the lesion. Seminal work by, e.g., Hayward et al. (1977), Damasio and Damasio (1989), or Lamb et al. (1989) were among the first researchers to transform the location of an individual’s injury as observed on a CT scan to a standard template image. While initial studies required human experts to compute this ‘normalization’ through visual inspection of landmarks, this process is tricky, as each individual’s brain has a unique shape, and one must compensate for the angulation of the patients’ scan relative to the template scan. Modern scientists can leverage automated methods to accomplish this task. Normalizing and overlapping lesions from different individuals with a common behavioral impairment allowed scientists to visualize which regions were typically associated with a specific impairment (such as, e.g., Broca’s aphasia). One major problem with this ‘simple overlapping method’ is that it cannot distinguish between brain areas associated with an impairment and regions that are particularly vulnerable to injury (Rorden and Karnath, 2004).
A first solution to this problem, though still on a descriptive level, was subtraction analysis. This method constrasts normalized lesion data from patients with a specific deficit with data from matched control group of brain damaged patients. This approach reveals regions that are both frequently damaged in experimental patients and typically spared in control patients (for review Rorden and Karnath, 2004). The next revolution came with BrainVox (Frank et al., 1997) and with voxel-based lesion symptom mapping (VLSM; Bates et al., 2003), in particular. A range of new features became available, including digital templates with a common volume (composed of discrete voxels) for lesion overlay, the ability to show brain injury maps on the rendered surface of the patient’s own MRI scan, and the use of normalized lesion maps to draw statistical inference. The VLSM method made it possible to account for regional vulnerability, with the statistical test identifying voxels in which individuals with a lesion to a particular voxel significantly differ in the behavior of interest from individuals without a lesion of this voxel. VLSM is a mass-univariate analysis, where this statistical test is independently applied to every single voxel in the brain. Here we refer to this method in general as VLBM (whereas VLSM is the original but specific implementation of this method). The VLBM method has been extended over the years to model binomial impairments (Karnath et al., 2004), non-parametric statistics and thresholding (Rorden et al., 2007), retrospective statistical power maps (Rudrauf et al., 2008), and automated continuous measures of the lesion (Tyler et al., 2005). VLBM has become a very popular method of uncovering the neural correlate(s) of cognitive functions in humans and has examined a wide number of impairments at both the acute and chronic phases of stroke (see Table 1 in Karnath and Rennig [2017] for a comprehensive overview on VLBM studies published prior to 11/2015).
The present paper has two main objectives. First, it focusses on mapping human brain lesions to study the functional architecture of the healthy brain. As such, patients with stroke – in contrast to other forms of brain injury – are highly suitable for such studies (de Haan & Karnath, in press). Second, we are interested in how brain lesion analysis may be used to provide better measures for diagnosis and recovery following brain lesion specifically due to stroke. The following section thus will focus on the limitations of VLBM specific to stroke; we note that not all of these limitations apply to other forms of brain injury (e.g. traumatic brain injury, epilepsy, or neurosurgical resection). These latter domains face their own set of limitations (see Karnath and Steinbach, 2011; de Haan & Karnath, in press); its discussion, however, is beyond the scope of the present work. Nevertheless, the mapping and analysis techniques we review here can also be used to explore a broad range of further issues, such as evaluating brain tumor treatment (e.g, recurrence patterns of glioblastomas after radiochemotherapy versus radiotherapy [Wick et al., 2008]) or evaluating efficiency of surgical brain treatment (e.g., outcome of surgical resections in medial temporal lobe epilepsy [Bonilha et al., 2007]).
1.2. Potential limitations of the mass-univariate approach
Despite the popularity and success of VLBM, this method – like all modern neuroimaging techniques – has limitations. Understanding these shortcomings is critical to using this tool effectively. While some of these concerns can be ameliorated, other limitations reflect inherent weaknesses of this method. Here we briefly discuss fundamental issues, with later sections describing potential solutions and alternative approaches.
A fundamental concern with any mass-univariate voxelwise study (or any study that conducts a huge number of independent statistical tests) relates to familywise error. Simply put, when we conduct thousands of statistical tests, we have thousands of opportunities to make errors. Left uncontrolled, we are almost certain to report false effects: the so-called ‘familywise error rate’. For smaller numbers of comparisons, one might turn to Bonferroni Correction (Nichols & Hayasaka, 2003) which can robustly control for familywise error. A major concern is that this strict statistical measure necessarily results in extremely poor statistical power. Indeed, in the case of neuroimaging data, Bonferroni thresholding tends to be overly conservative because voxels are not independent from their neighbors either because the data is smoothed (in the case of fMRI studies) or because lesions tend to have large, contiguous spatial extent. Fortunately, we can directly control for the familywise error rate using voxelwise permutation thresholding (Nichols & Hayasaka, 2003). Permutation thresholding precisely controls familywise error rate, and (as expected) demonstrates that Bonferroni correction is overly conservative in the context of VLBM (Rorden et al., 2007). The primary weakness of permutation thresholding is that it is slow, particularly as the number of permutations increases. However, statistical lesion analysis software packages like ‘NPM’ (Rorden et al., 2007) and ‘NiiStat’ (https://github.com/neurolabusc/NiiStat) minimize the penalty for computing permutations by, e.g., identifying redundant tests or calculating reusable components only once.
While voxelwise permutation thresholding does robustly control familywise error rate, it is inherently conservative, and therefore most useful with larger studies and studies with good statistical power. One weakness of this approach is that it leverages only a single attribute of our predicted result: extreme statistical scores. In reality, we expect our observed data to differ from random noise based on two features: real effects should have extreme statistical scores as well as a large spatial extent. In other words, we do not expect functional modules to fit precisely in a single voxel, rather we expect a cluster of voxels to underly a given behavior or represent a given cognitive process. On the other hand, we do not expect this spatial pattern to occur randomly. While cluster-based thresholds have been common in neuroimaging, there is a recent emphasis on deriving these through permutation-based approaches, mainly due to potential problems with the classic assumptions (Eklund et al., 2016). Both the ‘NiiStat’ tool (https://github.com/neurolabusc/NiiStat) and a new version of VLSM (Wilson et al., 2010) provide an option to compute the cluster-based permutation threshold. Assuming a large module is critical for a task, one would expect this approach to provide more statistical power than voxelwise permutation thresholds. The one challenge with this approach is that one needs to determine an initial cluster threshold. It is hard to provide guidance on what this initial threshold should be (one suspects the optimal value is influenced by number of participants and typical lesion size). Furthermore, simulation studies suggest that while this method has a high sensitivity to detect true effects, the surviving clusters may often also include voxels that are not involved (Mirman et al., 2016).
False discovery rate (FDR) provides an alternative thresholding approach, which promises substantially more power in situations where a substantial portion of the comparisons has signal. Rather than control for overall familywise error, FDR attempts to control for the ratio of false alarms to all alarms (i.e. false alarms plus hits). In situations where a large module is involved with a task, FDR should provide substantially more power. As noted by Mirman and colleagues (2016), while FDR is commonly used in lesion studies the assumptions have not been carefully validated by simulations. While this is a principled approach to thresholding lesion maps, we have two comments. First of all, as noted earlier: lesion volume virtually always correlates with symptom presence/severity. This can be inferred from first principles: probabilistically a larger lesion is more likely to knock out a critical module and is also more likely to knock out a critical amount of a distributed network. We note that there can be exceptions to this, for example when a critical region is connected with blood vessels associated with small lesions (e.g. basal ganglia injury can be associated with lacunar infarction). However, as a rule of thumb there is a strong coupling between impairment and lesion size. Therefore, unless one explicitly controls for lesion volume, there may be a large amount of apparent signal detected by FDR. Therefore, it seems best to couple FDR with some method that regresses out the effect of lesion volume. More generally, FDR has an arguably unhelpful property: it is very stringent in cases where there are only a few voxels associated with a task whereas it is able to be very liberal when a large proportion of the voxels are involved. It seems like we would rather have sensitivity for rare signals and spatial specificity for diffuse signals (paraphrasing personal communication with Dr Gerard Ridgway).
The ‘partial injury problem’ is an additional reason why one should expect VLBM to have low statistical power (Rorden et al., 2009). Generally, a functional module of the brain may be quite large, spanning many voxels of the brain, yet behavioral impairments may be observed when only a portion of this module is damaged. Therefore, two neurological patients may exhibit identical impairments due to mutually exclusive injury to the same module. In each case, the injury appears to be a counter-example for statistically identifying the other region as critical for the task. An analogous issue arises if the same impairment is observed following damage to any one of multiple modules.
The use of naturally occurring strokes to infer lesion-behavior relationships is necessarily spatially biased. The reason for this is that the regions destroyed by stroke are driven by vasculature, and may not regard the boundaries of functional modules. Certain regions of the brain are more vulnerable than others, yielding little insight into regions of the brain that are rarely injured. This has clear implications on our ability to use these methods to infer healthy brain function (cf. Sperber and Karnath, 2017). The method may be ill-suited to dissociate functional modules within the same vascular neighborhood, and is inefficient for finding functional modules that are rarely injured.
However, there is also a subtler spatial bias inherent with lesion-behavior mapping. Two recent studies have assessed the localization accuracy of the VLBM method (Inoue et al., 2014; Mah et al., 2014). Both studies used a simulation approach based on large neurological patient samples with brain damage. By generating an artificial deficit that was directly driven by the damage observed in each scan, they were able to create a gold standard for the correct solution (where the precise location remains unknown for real impairments). They observed a bias within the lesion-deficit maps, displacing inferred critical regions from their true anatomical locations towards areas of greater general lesion affection. However, these two simulation studies computed the VLBM analyses without the proper use of two commonly used correction factors: ‘lesion size’ and ‘sufficient lesion affection’. In fact, for many behavioral deficits lesion size is the best predictor for severity of the behavioral deficit; larger lesions are usually more likely to affect critical anatomical structures (Karnath et al., 2004). If a sufficiently large dataset is available, VLBM studies of real data sets thus control this effect, typically by regressing out lesion size from the behavioral scores. Moreover, such studies typically restrict statistical analysis to voxels that are affected by a certain proportion of lesions. This restriction to only voxels with ‘sufficient lesion affection’ (and therefore reasonable statistical power) prevents that results are biased by brain regions that are only rarely affected by stroke and thus do not carry sufficient information. The criterion for ‘sufficient lesion affection’ is often arbitrarily chosen since no general gold standard exists at present. While in case of VLBM with the Brunner-Munzel test a minimal criterion for this factor has been described (Medina et al., 2010), a power analysis (Rudrauf et al., 2008) can be helpful in finding an appropriate cutoff in other cases. In simulation experiments on a large sample of real stroke patients, Sperber and Karnath (2017) found that the misplacement bias in VLBM results is much smaller by setting the criterion for this factor to ≥ 5 out of 100 lesions. Moreover, Sperber and Karnath (2017) observed that the combined use of correction factor ‘sufficient lesion affection’ with correction factor ‘lesion size’ reduced misplacement markedly and in an additive manner, compared to uncorrected VLBM. While there are several methods to covary lesion size, we note in passing that our own ‘NiiStat’ tool (https://github.com/neurolabusc/NiiStat) allows users to combine nuisance regressors with permutation-based voxelwise as well as cluster thresholding using the Freedman-Lane method (Winkler et al., 2014).
The misplacement of statistical VLBM maps is due to physiological effects of brain lesion anatomy. In a sample of real stroke lesions, Sperber and Karnath (2017) generated voxel-wise topographies of collateral damage. Collateral damage to individual voxels was not centered on the voxel itself, but was aligned towards the center of the vasculature of the brain (Fig. 1). Using only information on the collateral damage, the study was able to predict the spatial bias in VLBM. Thus, a spatially skewed distribution of collateral stroke damage indeed is the reason for spatial biases in VLBM.
Figure 1.
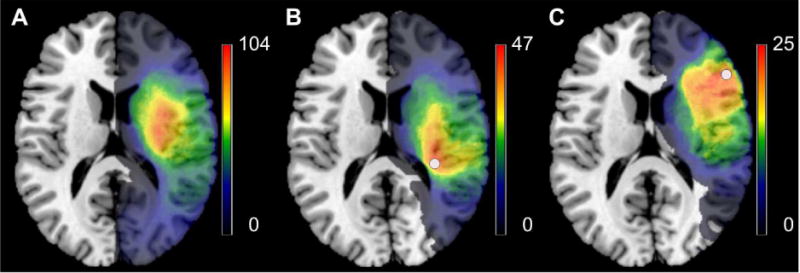
Spatial distribution of voxel-wise collateral damage in a large, unselected sample of stroke patients. (A) Overlay of 274 unselected, normalized lesions used by Sperber and Karnath (2017). (B) In these 274 patients, all patients with damage to a certain voxel (white circle; voxel 123/94/88 in MNI space) have been identified; an overlay of their lesions (n = 47) is shown. (C) Same as in the panel before, but for another voxel (white circle; voxel 143/154/88 in MNI space; n = 25). Note that collateral damage to both voxels is not centered on the voxel itself, but spatially oriented towards the center of the territory of the middle cerebral artery.
The lack of perfect solutions to controlling for multiple comparisons as well as the partial injury problem conspire to ensure that VLBM studies will have low statistical power. In addition, we will have particularly poor power in brain regions that are rarely injured (Kimberg et al., 2008). Furthermore, the corrections for the spatial biases encourage us to control for the effects of lesion volume, which is typically tightly coupled with the effect of interest (leaving a weaker residual signal to detect). All of these factors suggest that we will need to observe a large number of patients to reliably observe real effects. This can lead to expensive studies that require years of data. For many smaller studies, it may be worth considering sacrificing the spatial precision of voxelwise analyses in favor of a region of interest approach (cf. de Haan and Karnath, in press). Users have many atlases to choose from that define specific regions of interest. The ideal atlas is beyond the scope of the present work, though it may be worthwhile to consider an atlas that maps both cortical as well as subcortical regions (Yourganov et al., 2015).
2. New methods for understanding anatomo-behavioral consequences of brain lesions
As described in the previous section, the lesion method with its widely used mass-univariate approaches (Bates et al., 2003; Rorden et al., 2007) allows many insights into the anatomo-behavioral architecture of the human brain. However, several other analysis techniques or imaging modalities have been suggested to provide further insights into the anatomy of pathological behavior after stroke. Some of these methods can also be used to study the anatomy of neurologically disrupted brain networks and can account for stroke-induced alterations in the brain that go beyond the primary structural damage. These qualities can complement mass-univariate lesion methods. Across the literature, three methodological main strategies can be identified: i) the use of specialized imaging modalities, ii) the combination of structural imaging with normative connectome data, and iii) multivariate analyses of structural imaging data.
2.1. Multimodal imaging of brain damage
A main advantage of classical VLBM is its reliance on relatively easily and quickly acquired behavioral and brain imaging data. While a structural image is required, it is typically acquired as part of the standard clinical protocol carried out at admission by using either MR imaging (T2-FLAIR, diffusion-weighted imaging (DWI), T1) and/or computed tomography (CT). These data provide sufficient detail for normalization using age-matched MR or CT templates from the ‘Clinical Toolbox’ for SPM (Rorden et al., 2012). However, these structural modalities may not reveal the full functional extent of brain injury. Brain areas might be structurally intact but non-functional due to malperfusion or disconnection. These changes might be detected using perfusion-weighted imaging (PWI). Malperfused areas represent zones that are receiving enough oxygen to remain structurally intact, but not enough to function normally (Schlaug et al., 1999). Such areas might also contribute to the behavioral deficit and should be included in models that describe precise anatomo-behavioral relationships in the human brain. Lesion-behavior mapping studies frequently consider areas with abnormal perfusion in order to reveal precise structural-functional relationships (Hillis et al., 2001, 2002, 2005; Karnath et al., 2005; Ticini et al., 2009, 2010; Zopf et al., 2009, 2012; Shahid et al., 2017). In particular, PWI may reveal a mismatch with structural DWI immediately after injury, making it an important consideration in acute studies. It may play a particularly important role in acute prognosis (which we discuss later) as the mismatch between perfusion and structural imaging may help predict functions likely to recover. Beyond these popular clinical modalities for stroke, researchers have begun to explore several other promising methods. In particular, functional magnetic resonance imaging (fMRI), resting state functional magnetic resonance imaging (rsfMRI), diffusion tensor imaging (DTI), and arterial spin labeling (ASL) may help reveal the full consequences observed following stroke. We describe these in more detail below.
Several groups employed fMRI to study individuals who have suffered from brain injury. The aim was to explore the function of intact brain areas in the lesioned brain. Some studies observed abnormal BOLD signals in structurally intact tissue of the damaged hemisphere and concluded that the patients’ behavioral deficits do not depend just on the neuronal loss at the site of injury but rather were also causally connected to the abnormal BOLD signal (e.g., Corbetta et al., 2005; Saur et al., 2006; Fridriksson, 2010). Further, fMRI has been used in several studies aiming to study functional changes in post-stroke recovery (Rehme et al., 2011; Sun et al., 2013), or to identify markers to predict recovery (Rehme et al., 2015). Moreover, fMRI was employed to investigate how retained cognitive skills relate to brain activity after stroke (Martin et al., 2016; Griffis et al., 2017; Skipper-Kalal et al., 2017).
Also, rsfMRI has been used in stroke research. It provides information on functional connectivity, i.e. the correlation in spontaneous fluctuations in fMRI activity between a seed region of interest and the rest of the brain (e.g., Biswal et al., 1995; Fox and Raichle, 2007). While rsfMRI measures the same BOLD signal as fMRI, this method relies on spontaneous signal fluctuations while the subject is at rest. Multiple functional brain networks have been identified with this method (e.g., Beckmann et al., 2005; Damoiseaux et al., 2006; van den Heuvel et al., 2008). While rsfMRI is widely used in healthy subjects, several innovative scientific or clinical applications of rsfMRI in stroke patients have emerged (for review see Ovadia-Caro et al., 2014). Stroke-induced disruptions in rsfMRI networks are predictive of post-stroke cognitive and behavioral outcomes (e.g., Carter et al., 2010, 2012; Wang et al., 2010; Baldassare et al., 2016; Siegel et al., 2016). While these different findings emphasize the value of rsfMRI used in isolation to understand the physiology underlying neurological symptoms, a recent study has emphasized the complementary character of rsfMRI and the lesion method (Siegel et al., 2016): while both rsfMRI and structural lesion information can be used to predict post-stroke symptoms, they may provide synergistic benefits when used together.
However, a general concern for fMRI-based studies is that the local hemodynamics (i.e., the neurovascular coupling) might be abnormal in stroke patients. Both rsfMRI and fMRI rely on T2*-weighted signals to infer blood flow. This is referred to as a blood oxygenation level dependent (BOLD) measure. In healthy individuals, one can reliably expect stimuli to elicit an increased signal that peaks about five seconds after brain activity. The delay emphasizes that this is not a direct measure of brain activity (where one would expect metabolism to reduce local oxygen, and to do so much more rapidly), rather the increased metabolic demands trigger a dilation of the capillary beds which results in a net increase in local oxygen. From first principles, this relationship between brain activity and subsequent oxygen influx may be disrupted following brain injury. First of all, consider the case of misery perfusion, where the injury leaves a very constrained blood supply. In this case, the blood flow may not be able to increase following metabolic demands. On the other hand, consider luxury perfusion, where the destruction of neighboring regions may result in a blood supply that far exceeds the needs of the remaining tissue. In this case, neural activity might not require a change in blood flow. In both these cases, neurovascular coupling may not function as it does in a healthy brain. Indeed, data from several recent papers illustrates that the BOLD signal may be unusual following brain injury. For example, Fridriksson et al. (2006) noted very unusual perilesional hemodynamic responses in an individual with chronic stroke. Likewise, de Haan et al. (2013) explored the BOLD signal in three acute stroke patients and observed an abnormal interhemispheric balance consisting of reduced signal change in perilesional areas of the damaged hemisphere relative to homologous areas in neurologically healthy controls, unrelated to the patients’ behavior. While these findings would benefit from replication in larger groups, they suggest that neuroscientists need to exercise caution when interpreting BOLD data acquired in stroke patients, since abnormal BOLD responses could not only reflect functional disruption of these regions, but also a decoupling of the neurovascular response (without changes in neuronal functioning and/or in the individuals’ behavior), or a combination of these two effects.
As noted above, structural DWI is one of the most popular modalities in clinical stroke management. These data can be extended by acquiring diffusion scans sensitive to many spatial directions. This allows one to determine not only the speed of diffusion, but also the preferential direction of diffusion. Diffusion is anisotropic in the white matter fiber bundles (e.g. water molecules less constrained moving along a tract than radially), and therefore these sequences enable tractography. Typically, each voxel is modeled as a tensor (three orthogonal vectors, with the primary vector pointing in the direction of greatest diffusion), and hence this method is often referred to as ‘diffusion tensor imaging’. The resulting data can be used to identify the integrity of the brain’s white matter, for example the involvement of the arcuate fasciculus with language disorders (for review see Jang, 2013), the role of the corticospinal tract in motor performance (Fig. 2; Staudt, 2010; for review see Jang, 2011), or the pathways connecting right hemisphere cortical areas relevant for spatial orienting and exploration (Suchan et al., 2014; Thiebaut de Schotten et al., 2014). Tractography can help reveal disconnection syndromes which are thought by some authors to underlie many disorders (e.g., Catani and Mesulam, 2008; but see de Haan and Karnath [2017] for discussion).
Figure 2.
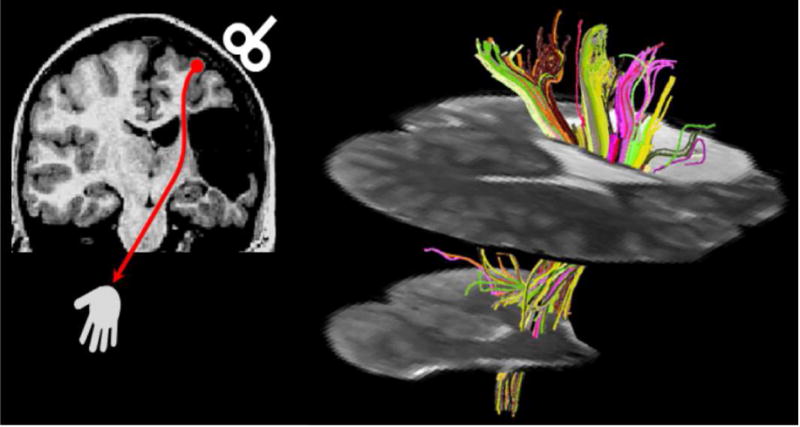
Diffusion tensor tractography in a patient with a cortico-subcortical infarction in the territory of the middle cerebral artery (modified from Staudt, 2010; reprinted with permission from John Wiley and Sons). Left: Coronal T1-weighted image depicting the lesion, leaving only a small bridge of preserved white matter between the lesion and the enlarged lateral ventricle. Transcranial magnetic stimulation (red) indicated preserved crossed cortico-spinal motor projections. Right: Diffusion tensor tractography visualizes the extensive connectivity mediated by this small bridge of preserved tissue (seed area for fiber tracking).
Recent advances in hardware, sequences, and post-processing have dramatically improved the potential quality of DTI data (Sotiropoulos et al., 2013). Nevertheless, adapting these tools to stroke populations can be challenging. Traditional methods of deterministic tractography infer fiber location using atlases generated in young healthy adults. However, these methods can fail in stroke patients, where dilated ventricles and mass effects can persist even after normalization generally corrects for the cortical features. Identifying major tracts by hand is laborious and often relies on subjective decisions. Yourganov and colleagues (2016) described a novel solution to this problem, which they refer to as ‘Connectome-Based Symptom Mapping’. In this method, a cortical atlas is back-projected to match the native resolution of an individual’s diffusion data, and then one generates a probabilistic map of the connections between all of the areas using FSL’s Probtrackx (Behrens et al., 2007). This method generates a connectome for each individual, which is suitable for graph theory analytics as well as multivariate analyses.
As noted earlier, perfusion weighted imaging (PWI) has proven to be an important tool for acute stroke management. In particular, the level of perfusion-diffusion mismatch can indicate the potential for revascularization. Traditionally, PWI has been accomplished with dynamic susceptibility contrast (DSC) imaging using a bolus of Gadolinium (Gd) as an exogenous contrast agent. Recent work has highlighted the ability for arterial spin labeling (ASL) to complement or replace DSC (for review see Zaharchuk, 2014). ASL tends to have low signal to noise (requiring long acquisition times) and is not well-suited for popular DSC measures such as time-to-peak. However, it does not require administration of a contrast agent and it appears to provide a marker for luxury perfusion which makes is clinically useful (Zaharchuk, 2014). This work has led to new recommendations for acquiring ASL (Alsop et al., 2015) which may increase its popularity in the future. Beyond the clinical significance, ASL has great promise for cognitive stroke research. It provides a more direct measure of blood flow than fMRI, and the interleaved acquisition of tagged and untagged images can attenuate low-frequency drift artifacts that contaminate fMRI. The lack of a contrast agent (and associated risks) is a major benefit relative to DSC research studies where the findings do not directly impact patient care. This method is already impacting our understanding of stroke. For example, recent work has demonstrated that chronic stroke survivors exhibit decreased perfusion in perilesional regions (Richardson et al., 2011; Thompson et al., 2017). This finding has implications for fMRI studies, suggesting that there may often be misery perfusion and poor BOLD signal near the location of the injury. Both of these studies examined individuals enrolled in aphasia treatment, and one could speculate that the perilesional regions may in fact be the most critical to recovery. Specifically, these individuals enrolled in the study due language impairments, and therefore had sustained damage to parts of language modules, and it seems likely that recovery will be modulated by the surviving portions of these modules.
In sum, we have described a number of promising methods that may refine our understanding of anatomo-behavioral consequences of stroke. However, given these numerous challenges, their usage will be limited until they can be proven to provide robust measures that improve on traditional structural MR or CT scans. First of all, since structural scans are required for standard care they are available (with appropriate consent) to scientist at low cost and without additional burdens on the patients, whereas alternative modalities require additional or longer scanning sessions that are unlikely to provide significant direct benefit to the participant. Second, subjects have to be MR-compatible, i.e., must not have any magnetic metal or electronic devices in the body, as well as have to be able to motionlessly lie in the scanner longer than for structural imaging. Third, for some modalities there are special demands, such as the patient’s ability to follow task instructions in fMRI. In addition, data acquisition and analyses in these methods are complex and require special training. Thus, these methods are both methodologically and ethically constrained in clinical subjects; and even if a method is generally feasible in a clinical population, study samples are often small. All of these limitations mean that any findings will be harder to generalize, to replicate and any benefits to clinical care more difficult to deploy.
2.2. Combination of structural imaging with normative connectome data
In order to avoid (part of) these problems, researchers have developed an approach that leverages structural brain imaging data from neurological patients and normative connectome data obtained from healthy controls to gain insights into brain networks disabled in neurological deficits (Boes et al., 2015). To do so, in a first step Boes and colleagues (2015) collected data from a sample of patients with a symptom of interest. Like in VLBM, they acquired lesion maps, i.e. binary normalized maps depicting the primary structural brain damage. Second, the study utilized a large sample of rsfMRI data from a healthy sample. The central idea to this method is to use the individual lesion maps as seed regions of interest for a resting state analysis in the healthy subjects (Fig. 3). In other words, this method identifies, for each individual patient, the structurally damaged brain area and looks at the same area and its functional network connections in a group of healthy subjects. The elegance of this approach is that it avoids the need of performing additional specialized imaging protocols on stroke patients.
Figure 3.
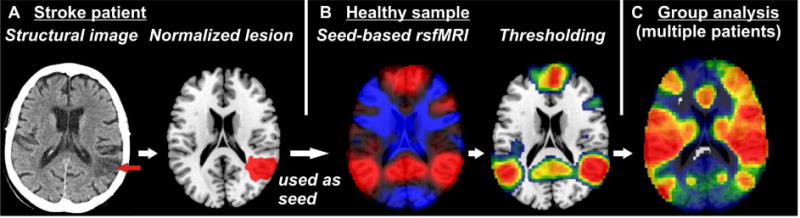
Basic principles of the use of normative resting state functional magnetic resonance imaging (rsfMRI) data in lesion analysis. (A) Individual structural imaging is used to obtain normalized binary lesion maps. (B) Each lesion map is used as a region of interest in a seed-based rsfMRI analysis in a sample of healthy subjects. The resulting topography identifies voxels in which brain activity correlates positively (red) or negatively (blue) with brain activity in the seed region. In the next step, a threshold is applied on this topography to create a binary map (here depicted for positive correlations). (C) Binarized rsfMRI maps obtained from multiple lesions are used in a group analysis of patients with a certain behavioral deficit of interest to identify networks affected by the lesions.
So far, this method has been used to investigate rare, stroke-induced neurological and behavioral deficits such as hemichorea-hemiballismus (Laganiere et al., 2016), delusional misidentification (Darby et al., 2017), freezing gait (Fasano et al., 2017), coma (Fischer et al., 2016), and others (Boes et al., 2015; Sutterer et al., 2016). For most of these symptoms, lesions were distributed all across the brain with hardly any overlap (Sutterer et al., 2016; Fasano et al., 2017; Laganiere et al., 2016), or were restricted to subcortical areas (Boes et al., 2015), or the brain stem (Fischer et al., 2016).
A clear benefit of this method is that publicly available large sample data of rsfMRI in healthy subjects (e.g., Buckner et al., 2014; Schultz et al., 2014) can be used, restricting the scientists’ data acquisition effort to the clinical data. However, there are issues with this new method that have not been properly solved yet. First, these studies binarized the rsfMRI maps to obtain a binary map of functional networks connected to the lesion site. To do so, a cutoff criterion of p = 0.00005 has been introduced (Boes et al., 2015), however there is no theoretical motivation for this specific cutoff, and results with the same cutoff may differ depending on the size of the healthy subject sample. Second, most studies did not use a control group of patients not showing the disorder of interest. This raises the same concerns that surround the simple lesion overlap method that preceded VLBM (cf. section “Voxel-based lesion behavior mapping (VLBM)” above; Rorden and Karnath, 2004). Specifically, by only examining individuals showing the symptom of interest, one cannot distinguish between the networks specifically associated with the disorder and those that are simply typically injured by stroke. Third, the problem of auto-correlation has not been properly addressed yet, which may be problematic especially with larger lesions (as seen in, e.g., Darby et al., 2017). Voxels inside the seed region of interest of course highly correlate with the seed region’s signal. This might lead researchers to misattribute findings to functional connectivity. It is worth noting the parallel work of Warren et al. (2014) where each stroke patient’s structural lesion mask was used to extract the network properties of the corresponding tissues in healthy subjects. Injury to hubs that had high system density and participation coefficient was associated with widespread cognitive deficits.
A similar approach, not focusing on functional, but on anatomical connectivity, was recently suggested (Kuceyeski et al., 2016) and utilized the ‘Network Modification Toolbox’ (Kuceyeski et al., 2013). This toolbox uses large samples of DTI connectome data from healthy subjects as well as the patients’ lesion data. For every patient, the lesion map is superimposed on the healthy group’s connectome and connection streamlines that lie in the area of the lesion map are identified. Based on this result, the toolbox calculates a metric that is thought to represent the structural connectivity at different global or region-wise levels. Using partial least squares regression with these connection metrics, Kuceyeski et al. (2016) successfully predicted cognitive and motor deficits six months post-stroke. Again, this approach only requires the patients’ structural imaging and behavioral data. The basic idea of comparing lesion maps and healthy subjects’ structural connectome maps is not novel (e.g., Zhu et al., 2010; Sterr et al., 2014). What is novel is the large scale approach with a large number of connections being assessed simultaneously and the opportunity to include these variables in a multivariate model to predict long-term outcome (Kuceyeski et al., 2016). Unfortunately, several of the concerns raised above with regards to the approach suggested by Boes et al. (2015) are also applicable to this method.
Nevertheless, we are clearly enthusiastic regarding the potential of these new methods that harness large normative datasets to understand brain function and disorders. One can imagine that these methods might provide prognostic value in identifying distributed effects such as acute diaschisis. Further, these methods can address the ‘partial injury problem’ that we noted can dramatically impact the statistical power of traditional methods for lesion-behavior mapping (cf. section “Potential limitations of the mass-univariate approach“ above; Rorden et al., 2009). On the other hand, we see these methods as extending rather than replacing traditional methods. A major inherent weakness with these new approaches is that they necessarily reduce the statistical inference: like fMRI they are liable to detect the entire network involved with a task rather than the specific areas required by the task.
2.3. Multivariate lesion analysis with machine learning algorithms
Unlike VLBM’s mass-univariate testing approach, machine learning based lesion analysis offers a multivariate approach to lesion analysis. Figure 4 demonstrates how a multivariate approach can out-perform a univariate approach in classifying patients. In this example, each brain area is independently a poor predictor of impairment (so univariate approaches are unlikely to identify either region as involved with the task). On the other hand, knowing about the damage to both areas together allows us to accurately discriminate most individuals, so there is a good multivariate solution. Several methods recently emerged that used supervised machine learning on structural imaging data for either classification, regression, or canonical correlation of neuropsychological behaviors (Smith et al., 2013; Mah et al., 2014; Zhang et al., 2014; Pustina et al., in press). These methods are able to model behavioral variables based on multiple variables such as the lesion status of multiple voxels or regions of interest. The validity of such a model can be inferred from its ability to predict data that have not been used in model generation (Smith et al., 2013; Karnath & Smith, 2014). This strategy is used in different cross-validation procedures: the data sample is divided into subsets and a multivariate model is trained to fit the behavioral target variables in one subset. For example, consider the data shown in Figure 4, where the model has been trained to predict whether a patient has spatial neglect based on the proportion of injury to a series of brain areas. The end of the training is a weighted classifier (in Figure 4, the dotted blue line). At this stage we test the model by introducing brain scans that the algorithm has not been exposed to and seeing whether the predicted classification (e.g., does the patient suffer from spatial neglect?) matches the patient’s true diagnosis. Next, the same model is applied on another subset of data and its behavioral variables are predicted. The better such model is, the smaller should be differences between predicted and real behavioral scores. This cross-validation method allows a straightforward method for thresholding multivariate analyses, as we train the classifier on one subset and then test its performance on a novel set. Consider a leave-one-out training with 100 subjects: we will train the classifier 100 times, and each time we can check the performance. If the behavior is binomial (such as the presence or absence of neglect, as shown in Fig. 4), we can determine the true positive (15) false positive (2), false negative (1) and true negative (14) classifications allowing us to estimate the sensitivity (93.75%), specificity (87.5) and statistical probability (via binomial probability). With continuous measures we can compute similar measures based on the correlation to the test values relative to the observed values. Since all the features are used to generate a single prediction, one does not face the previously described familywise error concerns that plague mass-univariate approaches.
Figure 4.
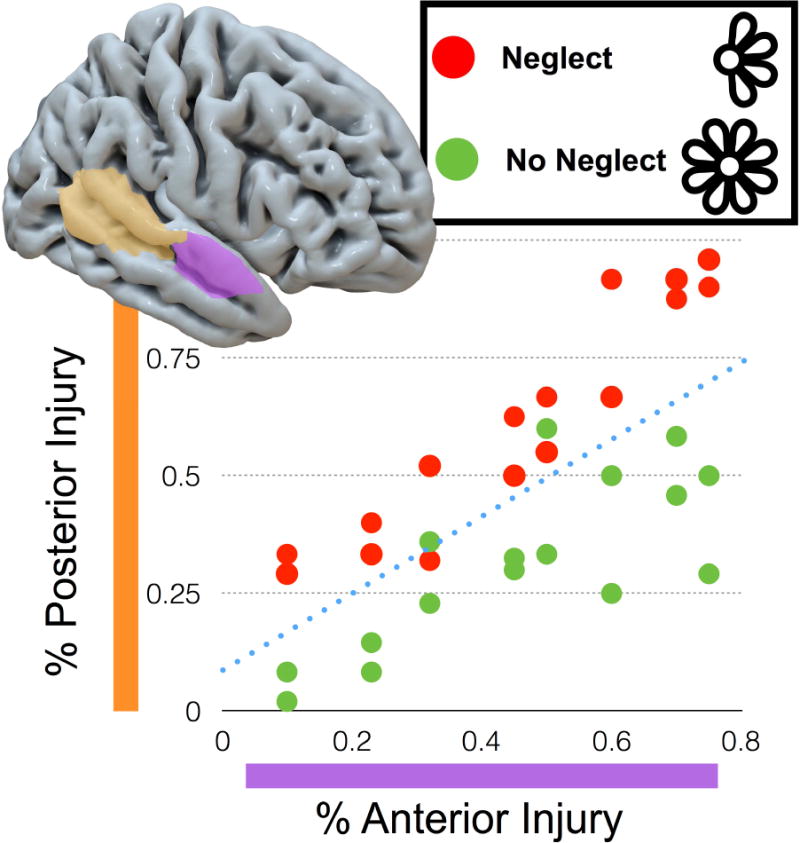
A cartoon illustrating machine learning, offering a multivariate approach to lesion analysis. Consider a study where a portion of the stroke patients have spatial neglect (for example neglecting the petals on the left side when asked to copy a drawing of a flower). Independently, neither the proportion injury to the posterior nor anterior parts of temporal cortex are able to reliably classify the patients’ disorder. This demonstrates the limitation of the mass-univariate approach, where none of the features (e.g., brain areas) are independently strong predictors. However, knowing the injury to both regions can accurately classify patients, as demonstrated by the dotted line (the ‘hyperplane’) which is weighted by damage to both areas in order to predict impairment. In this case, this line accurately classifies most individuals. In reality, these tools are able to use hundreds of features (in the case of region of interest analyses) or thousands of features (in the case of voxelwise analyses), but the resulting multi-dimensional ‘hyperplanes’ are more difficult to visualize graphically.
Multivariate analyses can be used to answer scientific questions on the anatomo-behavioral architecture of the human brain. Smith and colleagues (2013) aimed to uncover the representation of spatial neglect in the human brain by using a new multivariate approach. In a large sample of right hemispheric stroke patients, they found patterns of damage more predictive of spatial neglect than the best-performing single voxel. In addition, modeling multiple brain regions provided more predictive information than modeling single regions, which highlighted the utility of multivariate pattern analysis in lesion mapping. Zhang et al. (2014) used a multivariate approach to model continuous behavioral data in a single, voxelwise whole-brain model. By using permutation testing, the obtained parameter map was thresholded to obtain a statistical map that identified voxels that significantly contributed to the model. To assess feasibility and efficacy, they used synthetic data as well as previously published lesion data and behavioral measures from patients with aphasia, the latter addressing the processing of semantics vs. phonology. The authors observed that multivariate lesion-behaviour mapping is superior to its mass-univariate counterparts in brain networks, i.e., if a cognitive function is organized in multiple, separate brain regions. Sperber et al. (submitted) investigated apraxia of pantomime by using multivariate lesion behaviour mapping based on support vector regression in a large sample of left-hemisphere stroke patients. They identified a common network to underlie high-order motor control that integrated findings of different previous mass-univariate lesion studies.
Another main potential of machine learning based lesion analysis lies in the ability to make predictions on the clinical status of individual patients based on brain imaging (e.g., Yourganov et al., 2015; Rondina et al., 2016). For example, it can use acute behavior and acute structural imaging to predict chronic behavior, thus providing means to make long-term predictions on clinical outcome. At first glance, predicting long-term prognosis seems like a more challenging task than predicting current diagnosis (as famously quoted “it’s difficult to make predictions, especially about the future”). However, prognosis models can use not only the acute brain imaging data but also the acute behavioral data to predict outcome, whereas diagnosis can only leverage the brain imaging data. The acute behavioral data is a strong predictor of long term outcome: patients who are completely unimpaired acutely are unlikely to develop a chronic impairment, whereas the ‘proportional recovery rule’ (Krakauer and Marshall, 2015) is based on the strong predictive nature of acute impairment.
Several issues regarding multivariate lesion analyses still require attention. First, the choice of input variables (‘features’) can affect model performance. Two recent studies used multivariate modeling to predict behavioral variables and compared the impact of feature selection in different voxel- or region-of-interest-based models (Yourganov et al., 2015; Rondina et al., 2016). Both found the different approaches to lead to different prediction performance. It seems reasonable to suggest that some form of feature reduction is sensible for the noisy and redundant voxelwise data – either using explicit atlas based regions of interest (which typically yield recognizably named anatomy) or data driven approaches such as principle components analysis. However, at the moment there is no consensus on how this should be best accomplished. Another issue is present in the use of multivariate models in lesion-behavior mapping. Spatial biases have been reported to affect mass-univariate lesion-behavior mapping (Mah et al., 2014; Inuoe et al., 2014) and multivariate approaches have been proposed as a solution for this limitation (Mah et al., 2014; Xu et al., in press). While we concede that mass-univariate methods have limitations, above in section “Potential limitations of the mass-univariate approach“ we have described a number of solutions that address or attenuate these concerns (for further details see Sperber and Karnath, 2017 for further details see Sperber and Karnath, in press). Furthermore, previous studies compared the performance of multivariate vs. univariate lesion-behavior mapping (Mah et al., 2014; Zhang et al., 2014), but only recently a first study by Pustina et al. (in press) investigated if and how much multivariate methods are also susceptible to spatial biases that can be observed in mass-univariate method. Although it has been suggested that the “intervoxel correlations are intrinsically considered” in multivariate lesion-behaviour mapping using support vector regression (Zhang et al., 2014), it needs to be investigated how the method accounts for high or even perfect intervoxel correlations, i.e., very systematic patterns of collateral damage. Pustina et al. (in press) found that lesion-behavior mapping with multivariate sparse canonical correlations indeed performs better than mass-univariate non-parametric mapping (Rorden et al., 2007) in most (but not all) situations, including less spatial bias and better ability to identify cognitive modules consisting of multiple brain regions. However, multivariate results were far from being perfect; they suffered from a reduced, but still present spatial bias.
Beyond, multivariate approaches tend to be somewhat de-coupled from the spatial information. For example, while we can show feature loading maps (e.g., Yourganov et al., 2015) that hint at the anatomy involved with classification, for typically sized studies it is often useful to collapse across anatomy to deal with highly correlated features, which in some situations can be superior to multivariate methods (Yourganov et al., 2014). While the resulting models may be more robust, they do so by reducing the spatial fidelity. A more general issue is the selection of the regularization parameter used by support vector machine types (the C penalty parameter). This parameter trades off the accuracy of fitting against the robustness of the model, in other words how sensitive the model is to noise. As this setting becomes more robust, the resulting models can end up approximating traditional multiple regression, where multicollinearity between brain predictors leads to some regions being ignored. In these cases, the resulting load maps may fail to reveal regions that are genuinely (though not independently) predictive of behavior. While one can optimize this parameter for robust performance to avoid over-fitting (Yourganov et al., 2015), for lesion data (where the fact that lesions are large and spatially contiguous) one should expect multicollinearity of features.
In evaluating the use of multivariate models in lesion-behavior mapping, some have even suggested that the mass-univariate approach to lesion analysis should be abandoned, due to the intractable and inherent limitations. For example, according to Nachev (2015) “multivariate inference in the context of lesion-mapping is not an extension to the conventional voxel-wise mass-univariate method (i.e. voxel-based lesion-symptom mapping) […] but a necessity for anyone who uses vascular lesions to do any kind of anatomical inference in the brain”. Our own view is more nuanced, and we feel that both mass-univariate as well as multivariate methods serve in part different needs. The univariate approach addresses the theoretically important question regarding the brain anatomy (which is ultimately unknown, and the feature we are trying to discover) that is usually associated with a deficit across a population. This approach is meaningfully complemented by multivariate methods in particular if cognitive functions are organized in brain networks, but likely requires access to larger patient samples. A further use of multivariate approaches is to directly predict each individual’s behavior (which is a known variable) and to provide a gold standard to derive reliable conclusions regarding important clinical questions. For example, multivariate approaches can inform patients and clinicians regarding probable outcomes: are they likely to recover spontaneously, will they recover with a specific treatment, or are they unlikely to recover (and therefore focus should be on compensation, not rehabilitation). This information can also aid between-subject variability in treatment studies, matching individuals not only on their initial performance but also on their predicted recovery. Therefore, we do not see mass-univariate and multivariate approaches as competing methods, rather as complementary tools that can be used synergistically.
3. Conclusions
Clinical research with stroke patients has profoundly impacted our understanding of the human brain. Over the last few years researchers have developed and implemented a wide range of new tools for understanding the intact human brain. Specifically, methods such as fMRI, rsfMRI and DTI have become widely adopted. Similarly, connectome-centered measures and multivariate methods have proven useful in understanding the relationship between complex datasets from healthy individuals and datasets from clinical populations, including stroke. We see a virtuous cycle, with recent developments of neuroimaging protocols, advanced image processing and new statistical frameworks as having clear and largely untapped neuroscientific and clinical potential, in particular by providing new insights into the network-structure of the brain. However, there remain a number of specific challenges with adapting these tools to the lesioned brain. For example, deterministic tractography requires a quality of normalization which is currently unrealistic for stroke injury. Likewise, fMRI and rsfMRI can be dramatically compromised following stroke by decoupling of the neurovascular response which is the foundation of the BOLD signal response. Therefore, there is a need to use these tools judiciously. Moreover, while the validity of mass-univariate lesion analyses was critically tested by either mapping noncontroversial brain modules (Rorden & Karnath, 2004; Rorden et al., 2009; Karnath & Rennig, 2017) or by simulations with real lesion data (Inuoe et al., 2014, Mah et al., 2014; Zhang et al., 2014; Sperber & Karnath, 2017), an evaluation of the validity of the new methods reviewed above is only beginning; there is a clear need for additional cross-validation studies. While some have argued that mass-univariate methods should be replaced by multivariate approaches (cf. section “Multivariate lesion analysis with machine learning algorithms” above), we see these methods as being complementary, with each one offering unique and important insights into our understanding of the anatomo-behavioral consequences of brain lesions.
Acknowledgments
This work was supported by the Deutsche Forschungsgemeinschaft (KA 1258/23-1) and National Institutes of Health (P50DC014664). Christoph Sperber was supported by the Friedrich Naumann Foundation. We thank Grigori Yourganov and Ged Ridgway for their helpful comments on the manuscript.
Footnotes
Publisher's Disclaimer: This is a PDF file of an unedited manuscript that has been accepted for publication. As a service to our customers we are providing this early version of the manuscript. The manuscript will undergo copyediting, typesetting, and review of the resulting proof before it is published in its final citable form. Please note that during the production process errors may be discovered which could affect the content, and all legal disclaimers that apply to the journal pertain.
References
- Alsop DC, Detre JA, Golay X, Günther M, Hendrikse J, Hernandez-Garcia L, Lu H, MacIntosh BJ, Parkes LM, Smits M, van Osch MJ, Wang DJ, Wong EC, Zaharchuk G. Recommended implementation of arterial spin-labeled perfusion MRI for clinical applications: a consensus of the ISMRM perfusion study group and the European consortium for ASL in dementia. Magn Reson Med. 2015;73:102–116. doi: 10.1002/mrm.25197. [DOI] [PMC free article] [PubMed] [Google Scholar]
- Baldassarre A, Ramsey L, Rengachary J, Zinn K, Siegel JS, Metcalf NV, Strube MJ, Snyder AZ, Corbetta M, Shulman GL. Dissociated functional connectivity profiles for motor and attention deficits in acute right-hemisphere stroke. Brain. 2016;139:2024–2038. doi: 10.1093/brain/aww107. [DOI] [PMC free article] [PubMed] [Google Scholar]
- Bates E, Wilson SM, Saygin AP, Dick F, Sereno MI, Knight RT, Dronkers NF. Voxel-based lesion-symptom mapping. Nat Neurosci. 2003;6:448–450. doi: 10.1038/nn1050. [DOI] [PubMed] [Google Scholar]
- Beckmann CF, DeLuca M, Devlin JT, Smith SM. Investigations into resting-state connectivity using independent component analysis. Philos Trans R Soc Lond B Biol Sci. 2005;360:1001–1013. doi: 10.1098/rstb.2005.1634. [DOI] [PMC free article] [PubMed] [Google Scholar]
- Behrens TE, Berg HJ, Jbabdi S, Rushworth MF, Woolrich MW. Probabilistic diffusion tractography with multiple fibre orientations: What can we gain? Neuroimage. 2007;34:144–155. doi: 10.1016/j.neuroimage.2006.09.018. [DOI] [PMC free article] [PubMed] [Google Scholar]
- Biswal B, Yetkin FZ, Haughton VM, Hyde JS. Functional connectivity in the motor cortex of resting human brain using echo-planar MRI. Magn Reson Med. 1995;34:537–541. doi: 10.1002/mrm.1910340409. [DOI] [PubMed] [Google Scholar]
- Boes AD, Prasad S, Liu H, Liu Q, Pascual-Leone A, Caviness VS, Fox MD. Network localization of neurological symptoms from focal brain lesions. Brain. 2015;138:3061–3075. doi: 10.1093/brain/awv228. [DOI] [PMC free article] [PubMed] [Google Scholar]
- Bonilha L, Yasuda CL, Rorden C, Li LM, Tedeschi H, de Oliveira E, Cendes F. Does resection of the medial temporal lobe improve the outcome of temporal lobe epilepsy surgery? Epilepsia. 2007;48:571–578. doi: 10.1111/j.1528-1167.2006.00958.x. [DOI] [PubMed] [Google Scholar]
- Buckner RL, Roffman JL, Smoller JW. Brain Genomics Superstruct Project (GSP) Harvard Dataverse. 2014;10 [Google Scholar]
- Carter AR, Astafiev SV, Lang CE, Connor LT, Rengachary J, Strube MJ, Pope DLW, Shulman GL, Corbetta M. Resting interhemispheric functional magnetic resonance imaging connectivity predicts performance after stroke. Ann Neurol. 2010;67:365–375. doi: 10.1002/ana.21905. [DOI] [PMC free article] [PubMed] [Google Scholar]
- Carter AR, Patel KR, Astafiev SV, Snyder AZ, Rengachary J, Strube MJ, Pope A, Shimony JS, Lang CE, Shulman GL, Corbetta M. Upstream dysfunction of somatomotor functional connectivity after corticospinal damage in stroke. Neurorehabil Neural Repair. 2012;26:7–19. doi: 10.1177/1545968311411054. [DOI] [PMC free article] [PubMed] [Google Scholar]
- Catani M, Mesulam MM. The arcuate fasciculus and the disconnection theme in language and aphasia: history and current state. Cortex. 2008;44:953–961. doi: 10.1016/j.cortex.2008.04.002. [DOI] [PMC free article] [PubMed] [Google Scholar]
- Code C, Wallesch CW, Joanette Y, Lecours AR, editors. Classic Cases in Neuropsychology. Psychology Press; Hove, UK: 1996. [Google Scholar]
- Code C, Wallesch CW, Joanette Y, Lecours AR, editors. Classic Cases in Neuropsychology. II. Psychology Press; Hove, UK: 2003. [Google Scholar]
- Corbetta M, Kincade MJ, Lewis C, Snyder AZ, Sapir A. Neural basis and recovery of spatial attention deficits in spatial neglect. Nat Neurosci. 2005;8:1603–1610. doi: 10.1038/nn1574. [DOI] [PubMed] [Google Scholar]
- Damasio H, Damasio AR. Lesion analysis in neuropsychology. Oxford University Press; New York USA: 1989. [Google Scholar]
- Damoiseaux JS, Rombouts SARB, Barkhof F, Scheltens P, Stam CJ, Smith SM, Beckmann CF. Consistent resting-state networks across healthy subjects. Proc Natl Acad Sci U S A. 2006;103:13848–13853. doi: 10.1073/pnas.0601417103. [DOI] [PMC free article] [PubMed] [Google Scholar]
- Darby RR, Laganiere S, Pascual-Leone A, Prasad S, Fox MD. Finding the imposter: brain connectivity of lesions causing delusional misidentifications. Brain. 2017;140:497–507. doi: 10.1093/brain/aww288. [DOI] [PMC free article] [PubMed] [Google Scholar]
- de Haan B, Karnath HO. ‘Whose atlas I use, his song I sing?’ – the impact of anatomical atlases on fiber tract contributions to cognitive deficits. Neuroimage. 2017;163:301–309. doi: 10.1016/j.neuroimage.2017.09.051. [DOI] [PubMed] [Google Scholar]
- de Haan B, Karnath HO. A hitchhiker’s guide to lesion-behaviour mapping. Neuropsychologia. doi: 10.1016/j.neuropsychologia.2017.10.021. in press. [DOI] [PubMed] [Google Scholar]
- de Haan B, Rorden C, Karnath HO. Abnormal perilesional BOLD signal is not correlated with stroke patients’ behavior. Front Hum Neurosci. 2013;7:669. doi: 10.3389/fnhum.2013.00669. [DOI] [PMC free article] [PubMed] [Google Scholar]
- Eklund A, Nichols TE, Knutsson H. Cluster failure: why fMRI inferences for spatial extent have inflated false-positive rates. Proc Natl Acad Sci USA. 2016;113:7900–7905. doi: 10.1073/pnas.1602413113. [DOI] [PMC free article] [PubMed] [Google Scholar]
- Fasano A, Laganiere SE, Lam S, Michael D. Lesions causing freezing of gait localize to a cerebellar functional network. Ann Neurol. 2017;81:129–141. doi: 10.1002/ana.24845. [DOI] [PMC free article] [PubMed] [Google Scholar]
- Fischer DB, Boes AD, Demertzi A, Evrard HC, Laureys S, Edlow BL, Liu H, Saper CB, Pascual-Leone A, Fox MD, Geerling JC. A human brain network derived from coma-causing brainstem lesions. Neurology. 2016;87:2427–2434. doi: 10.1212/WNL.0000000000003404. [DOI] [PMC free article] [PubMed] [Google Scholar]
- Fox MD, Raichle ME. Spontaneous fluctuations in brain activity observed with functional magnetic resonance imaging. Nat Rev Neurosci. 2007;8:700–711. doi: 10.1038/nrn2201. [DOI] [PubMed] [Google Scholar]
- Frank RJ, Damasio H, Grabowski TJ. Brainvox: an interactive, multimodal visualization and analysis system for neuroanatomical imaging. Neuroimage. 1997;5:13–30. doi: 10.1006/nimg.1996.0250. [DOI] [PubMed] [Google Scholar]
- Fridriksson J. Preservation and modulation of specific left hemisphere regions is vital for treated recovery from anomia in stroke. J Neurosci. 2010;30:11558–11564. doi: 10.1523/JNEUROSCI.2227-10.2010. [DOI] [PMC free article] [PubMed] [Google Scholar]
- Fridriksson J, Rorden C, Morgan PS, Morrow KL, Baylis GC. Measuring the hemodynamic response in chronic hypoperfusion. Neurocase. 2006;12:146–150. doi: 10.1080/13554790600598816. [DOI] [PubMed] [Google Scholar]
- Griffis JC, Nenert R, Allendorfer JB, Vannest J, Holland S, Dietz A, Szaflarski JP. The canonical semantic network supports residual language function in chronic post-stroke aphasia. Hum Brain Mapp. 2017;38:1636–1658. doi: 10.1002/hbm.23476. [DOI] [PMC free article] [PubMed] [Google Scholar]
- Hayward RW, Naeser MA, Zatz LM. Cranial computed tomography in aphasia - correlation of anatomical lesions with functional deficits. Radiology. 1977;123:653–660. doi: 10.1148/123.3.653. [DOI] [PubMed] [Google Scholar]
- Hillis AE, Newhart M, Heidler J, Barker PB, Herskovits EH, Degaonkar M. Anatomy of spatial attention: insights from perfusion imaging and hemispatial neglect in acute stroke. J Neurosci. 2005;25:3161–3167. doi: 10.1523/JNEUROSCI.4468-04.2005. [DOI] [PMC free article] [PubMed] [Google Scholar]
- Hillis AE, Wityk RJ, Barker PB, Beauchamp NJ, Gailloud P, Murphy K, Cooper O, Metter EJ. Subcortical aphasia and neglect in acute stroke: the role of cortical hyperfusion. Brain. 2002;125:1094–1104. doi: 10.1093/brain/awf113. [DOI] [PubMed] [Google Scholar]
- Hillis AE, Wityk RJ, Tuffiash E, Beauchamp NJ, Jacobs MA, Barker PB, Selnes OA. Hypoperfusion of Wernicke’s area predicts severity of semantic deficit in acute stroke. Ann Neurol. 2001;50:561–566. doi: 10.1002/ana.1265. [DOI] [PubMed] [Google Scholar]
- Inoue K, Madhyastha T, Rudrauf D, Mehta S, Grabowski T. What affects detectability of lesion–deficit relationships in lesion studies? NeuroImage Clin. 2014;6:388–397. doi: 10.1016/j.nicl.2014.10.002. [DOI] [PMC free article] [PubMed] [Google Scholar]
- Jang SH. A review of diffusion tensor imaging studies on motor recovery mechanisms in stroke patients. NeuroRehabilitation. 2011;28:345–352. doi: 10.3233/NRE-2011-0662. [DOI] [PubMed] [Google Scholar]
- Jang SH. Diffusion Tensor Imaging Studies on Arcuate Fasciculus in Stroke Patients: A Review. Front Hum Neurosci. 2013;7:749. doi: 10.3389/fnhum.2013.00749. [DOI] [PMC free article] [PubMed] [Google Scholar]
- Karnath HO, Steinbach JP. Do brain tumours allow valid conclusions on the localisation of human brain functions?–Objections. Cortex. 2011;47:1004–1006. doi: 10.1016/j.cortex.2010.08.006. [DOI] [PubMed] [Google Scholar]
- Karnath HO, Smith DV. The next step in modern brain lesion analysis: multivariate pattern analysis. Brain. 2014;137:2405–2407. doi: 10.1093/brain/awu180. [DOI] [PubMed] [Google Scholar]
- Karnath HO, Rennig J. Investigating structure and function in the healthy human brain: validity of acute versus chronic lesion-symptom mapping. Brain Struct Funct. 2017;222:2059–2070. doi: 10.1007/s00429-016-1325-7. [DOI] [PubMed] [Google Scholar]
- Karnath HO, Fruhmann Berger M, Küker W, Rorden C. The anatomy of spatial neglect based on voxelwise statistical analysis: a study of 140 patients. Cereb Cortex. 2004;14:1164–1172. doi: 10.1093/cercor/bhh076. [DOI] [PubMed] [Google Scholar]
- Karnath HO, Zopf R, Johannsen L, Fruhmann Berger M, Nägele T, Klose U. Normalized perfusion MRI to identify common areas of dysfunction: patients with basal ganglia neglect. Brain. 2005;128:2462–2469. doi: 10.1093/brain/awh629. [DOI] [PubMed] [Google Scholar]
- Kimberg DY, Coslett HB, Schwartz MF. Power in Voxel-based lesion-symptom mapping. J Cogn Neurosci. 2007;19:1067–1080. doi: 10.1162/jocn.2007.19.7.1067. [DOI] [PubMed] [Google Scholar]
- Krakauer JW, Marshall RS. The proportional recovery rule for stroke revisited. Ann Neurol. 2015;78:845–847. doi: 10.1002/ana.24537. [DOI] [PubMed] [Google Scholar]
- Kuceyeski A, Maruta J, Relkin N, Raj A. The Network Modification (NeMo) Tool: elucidating the effect of white matter integrity changes on cortical and subcortical structural connectivity. Brain Connect. 2013;3:451–463. doi: 10.1089/brain.2013.0147. [DOI] [PMC free article] [PubMed] [Google Scholar]
- Kuceyeski A, Navi BB, Kamel H, Raj A, Relkin N, Toglia J, Iadecola C, O’Dell M. Structural connectome disruption at baseline predicts 6-months post-stroke outcome. Hum Brain Mapp. 2016;37:2587–2601. doi: 10.1002/hbm.23198. [DOI] [PMC free article] [PubMed] [Google Scholar]
- Laganiere S, Boes AD, Fox MD. Network localization of hemichorea-hemiballismus. Neurology. 2016;86:2187–2195. doi: 10.1212/WNL.0000000000002741. [DOI] [PMC free article] [PubMed] [Google Scholar]
- Lamb MR, Robertson LC, Knight RT. Attention and interference in the processing of global and local information: effects of unilateral temporal-parietal junction lesions. Neuropsychologia. 1989;27:471–483. doi: 10.1016/0028-3932(89)90052-3. [DOI] [PubMed] [Google Scholar]
- Mah YH, Husain M, Rees G, Nachev P. Human brain lesion-deficit inference remapped. Brain. 2014;137:2522–2531. doi: 10.1093/brain/awu164. [DOI] [PMC free article] [PubMed] [Google Scholar]
- Martin M, Nitschke K, Beume L, Dressing A, Bühler LE, Ludwig VM, Mader I, Rijntjes M, Kaller CP, Weiller C. Brain activity underlying tool-related and imitative skills after major left hemisphere stroke. Brain. 2016;139:1497–1516. doi: 10.1093/brain/aww035. [DOI] [PubMed] [Google Scholar]
- Medina J, Kimberg DY, Chatterjee A, Coslett HB. Inappropriate usage of the Brunner-Munzel test in recent voxel-based lesion-symptom mapping studies. Neuropsychologia. 2009;48:341–343. doi: 10.1016/j.neuropsychologia.2009.09.016. [DOI] [PMC free article] [PubMed] [Google Scholar]
- Mirman D, Landrigan JF, Kokolis S, Verillo S, Ferrara C. Permutation-based cluster size correction for voxel-based lesion-symptom mapping. 2016 doi: 10.1016/j.neuropsychologia.2017.08.025. https://arxiv.org/pdf/1606.00475.pdf. [DOI] [PMC free article] [PubMed]
- Nachev P. The first step in modern lesion-deficit analysis. Brain. 2015;138:e354. doi: 10.1093/brain/awu275. [DOI] [PMC free article] [PubMed] [Google Scholar]
- Nichols T, Hayasaka S. Controlling the familywise error rate in functional neuroimaging: a comparative review. Statistical Methods in Medical Research. 2003;12:419–446. doi: 10.1191/0962280203sm341ra. [DOI] [PubMed] [Google Scholar]
- Pustina D, Avants B, Faseyitan O, Medaglia J, Coslett HB. Improved accuracy of lesion to symptom mapping with multivariate sparse canonical correlations. Neuropsychologia. doi: 10.1016/j.neuropsychologia.2017.08.027. in press. http://dx.doi.org/10.1016/j.neuropsychologia.2017.08.027. [DOI] [PubMed]
- Ovadia-Caro S, Margulies DS, Villringer A. The value of resting-state functional magnetic resonance imaging in stroke. Stroke. 2014;45:2818–2824. doi: 10.1161/STROKEAHA.114.003689. [DOI] [PubMed] [Google Scholar]
- Rehme AK, Fink GR, von Cramon DY, Grefkes C. The role of the contralesional motor cortex for motor recovery in the early days after stroke assessed with longitudinal FMRI. Cereb Cortex. 2011;21:756–768. doi: 10.1093/cercor/bhq140. [DOI] [PubMed] [Google Scholar]
- Rehme AK, Volz LJ, Feis DL, Eickhoff SB, Fink GR, Grefkes C. Individual prediction of chronic motor outcome in the acute post-stroke stage: behavioral parameters versus functional imaging. Hum Brain Mapp. 2015;36:4553–4565. doi: 10.1002/hbm.22936. [DOI] [PMC free article] [PubMed] [Google Scholar]
- Richardson JD, Baker JM, Morgan PS, Rorden C, Bonilha L, Fridriksson J. Cerebral perfusion in chronic stroke: implications for lesion-symptom mapping and functional MRI. Behav Neurol. 2011;24:117–122. doi: 10.3233/BEN-2011-0283. [DOI] [PMC free article] [PubMed] [Google Scholar]
- Rondina JM, Filippone M, Girolami M, Ward NS. Decoding post-stroke motor function from structural brain imaging. NeuroImage Clin. 2016;12:372–380. doi: 10.1016/j.nicl.2016.07.014. [DOI] [PMC free article] [PubMed] [Google Scholar]
- Rorden C, Karnath HO. Using human brain lesions to infer function: a relic from a past era in the fMRI age? Nat Rev Neurosci. 2004;5:813–819. doi: 10.1038/nrn1521. [DOI] [PubMed] [Google Scholar]
- Rorden C, Karnath HO, Bonilha L. Improving lesion-symptom mapping. J Cogn Neurosci. 2007;19:1081–1088. doi: 10.1162/jocn.2007.19.7.1081. [DOI] [PubMed] [Google Scholar]
- Rorden C, Fridriksson J, Karnath HO. An evaluation of traditional and novel tools for lesion behavior mapping. Neuroimage. 2009;44:1355–1362. doi: 10.1016/j.neuroimage.2008.09.031. [DOI] [PMC free article] [PubMed] [Google Scholar]
- Rorden C, Bonilha L, Fridriksson J, Bender B, Karnath HO. Age-specific CT and MRI templates for spatial normalization. Neuroimage. 2012;61:957–965. doi: 10.1016/j.neuroimage.2012.03.020. [DOI] [PMC free article] [PubMed] [Google Scholar]
- Rudrauf D, Mehta S, Bruss J, Tranel D, Damasio H, Grabowski TJ. Thresholding lesion overlap difference maps: application to category-related naming and recognition deficits. Neuroimage. 2008;41:970–984. doi: 10.1016/j.neuroimage.2007.12.033. [DOI] [PMC free article] [PubMed] [Google Scholar]
- Saur D, Lange R, Baumgaertner A, Schraknepper V, Willmes K, Rijntjes M, Weiller C. Dynamics of language reorganization after stroke. Brain. 2006;129:1371–1384. doi: 10.1093/brain/awl090. [DOI] [PubMed] [Google Scholar]
- Schlaug G, Benfield A, Baird AE, Siewert B, Lövblad KO, Parker RA, Edelman RR, Warach S. The ischemic penumbra. Operationally defined by diffusion and perfusion MRI. Neurology. 1999;53:1528–1537. doi: 10.1212/wnl.53.7.1528. [DOI] [PubMed] [Google Scholar]
- Schultz AP, Chhatwal JP, Huijbers W, Hedden T, van Dijk KRA, McLaren DG, Ward AM, Wigman S, Sperling RA. Template based rotation: a method for functional connectivity analysis with a priori templates. Neuroimage. 2014;102:620–636. doi: 10.1016/j.neuroimage.2014.08.022. [DOI] [PMC free article] [PubMed] [Google Scholar]
- Shahid H, Sebastian R, Schnur TT, Hanayik T, Wright A, Tippett DC, Fridriksson J, Rorden C, Hillis AE. Important considerations in lesion-symptom mapping: Illustrations from studies of word comprehension. Hum Brain Mapp. 2017;38:2990–3000. doi: 10.1002/hbm.23567. [DOI] [PMC free article] [PubMed] [Google Scholar]
- Siegel JS, Ramsey LE, Snyder AZ, Metcalf NV, Chacko RV, Weinberger K, Baldassarre A, Hacker CD, Shulman GL, Corbetta M. Disruptions of network connectivity predict impairment in multiple behavioral domains after stroke. Proc Natl Acad Sci USA. 2016;113:E4367–4376. doi: 10.1073/pnas.1521083113. [DOI] [PMC free article] [PubMed] [Google Scholar]
- Skipper-Kallal LM, Lacey EH, Xing S, Turkeltaub PE. Functional activation independently contributes to naming ability and relates to lesion site in post-stroke aphasia. Hum Brain Mapp. 2017;38:2051–2066. doi: 10.1002/hbm.23504. [DOI] [PMC free article] [PubMed] [Google Scholar]
- Smith DV, Clithero JA, Rorden C, Karnath HO. Decoding the anatomical network of spatial attention. Proc Natl Acad Sci. 2013;110:1518–1523. doi: 10.1073/pnas.1210126110. [DOI] [PMC free article] [PubMed] [Google Scholar]
- Sotiropoulos SN, Jbabdi S, Xu J, Andersson JL, Moeller S, Auerbach EJ, Glasser MF, Hernandez M, Sapiro G, Jenkinson M, Feinberg DA, Yacoub E, Lenglet C, Van Essen DC, Ugurbil K, Behrens TE. Advances in diffusion MRI acquisition and processing in the Human Connectome Project. Neuroimage. 2013;80:125–143. doi: 10.1016/j.neuroimage.2013.05.057. [DOI] [PMC free article] [PubMed] [Google Scholar]
- Sperber C, Karnath HO. Impact of correction factors in human brain lesion-behavior inference. Hum Brain Mapp. 2017;38:1692–1701. doi: 10.1002/hbm.23490. [DOI] [PMC free article] [PubMed] [Google Scholar]
- Sperber C, Karnath HO. On the validity of lesion-behaviour mapping methods. Neuropsychologia. doi: 10.1016/j.neuropsychologia.2017.07.035. in press. https://doi.org/10.1016/j.neuropsychologia.2017.07.035. [DOI] [PubMed]
- Sperber C, Wiesen D, Goldenberg G, Karnath HO. The network underlying human higher-order motor control: insights from machine learning-based lesion-behaviour mapping. doi: 10.1016/j.cortex.2019.08.023. submitted. [DOI] [PubMed] [Google Scholar]
- Staudt M. Reorganization after pre- and perinatal brain lesions. J Anat. 2010;217:469–474. doi: 10.1111/j.1469-7580.2010.01262.x. [DOI] [PMC free article] [PubMed] [Google Scholar]
- Sterr A, Dean PJ, Szameitat AJ, Conforto AB, Shen S. Corticospinal tract integrity and lesion volume play different roles in chronic hemiparesis and its improvement through motor practice. Neurorehabil Neural Repair. 2014;28:335–343. doi: 10.1177/1545968313510972. [DOI] [PubMed] [Google Scholar]
- Suchan J, Umarova R, Schnell S, Himmelbach M, Weiller C, Karnath HO, Saur D. Fiber pathways connecting cortical areas relevant for spatial orienting and exploration. Hum Brain Mapp. 2014;35:1031–1043. doi: 10.1002/hbm.22232. [DOI] [PMC free article] [PubMed] [Google Scholar]
- Sun L, Yin D, Zhu Y, Fan M, Zang L, Wu Y, Jia J, Bai Y, Zhu B, Hu Y. Cortical reorganization after motor imagery training in chronic stroke patients with severe motor impairment: A longitudinal fMRI study. Neuroradiology. 2013;55:913–925. doi: 10.1007/s00234-013-1188-z. [DOI] [PubMed] [Google Scholar]
- Sutterer MJ, Bruss J, Boes AD, Voss MW, Bechara A, Tranel D. Canceled connections: Lesion-derived network mapping helps explain differences in performance on a complex decision-making task. Cortex. 2016;78:31–43. doi: 10.1016/j.cortex.2016.02.002. [DOI] [PMC free article] [PubMed] [Google Scholar]
- Thiebaut de Schotten M, Tomaiuolo F, Aiello M, Merola S, Silvetti M, Lecce F, Bartolomeo P, Doricchi F. Damage to white matter pathways in subacute and chronic spatial neglect: a group study and 2 single-case studies with complete virtual “in vivo” tractography dissection. Cereb Cortex. 2014;24:691–706. doi: 10.1093/cercor/bhs351. [DOI] [PubMed] [Google Scholar]
- Thompson CK, Walenski M, Chen Y, Caplan D, Kiran S, Rapp B, Grunewald K, Nunez M, Zinbarg R, Parrish TB. Intrahemispheric perfusion in chronic stroke-induced aphasia. Neural Plast. 2017;2017:2361691. doi: 10.1155/2017/2361691. [DOI] [PMC free article] [PubMed] [Google Scholar]
- Ticini LF, de Haan B, Klose U, Nagele T, Karnath HO. The role of temporo-parietal cortex in subcortical visual extinction. J Cogn Neurosci. 2010;22:2141–2150. doi: 10.1162/jocn.2009.21315. [DOI] [PubMed] [Google Scholar]
- Ticini LF, Klose U, Nagele T, Karnath HO. Perfusion imaging in Pusher syndrome to investigate the neural substrates involved in controlling upright body position. PLoS One. 2009;4:e5737. doi: 10.1371/journal.pone.0005737. [DOI] [PMC free article] [PubMed] [Google Scholar]
- Tyler LK, Marslen-Wilson W, Stamatakis EA. Dissociating neuro-cognitive component processes: voxel-based correlational methodology. Neuropsychologia. 2005;43:771–778. doi: 10.1016/j.neuropsychologia.2004.07.020. [DOI] [PubMed] [Google Scholar]
- van den Heuvel M, Mandl R, Hulshoff Pol H. Normalized cut group clustering of resting-state FMRI data. PLoS One. 2008;3:e2001. doi: 10.1371/journal.pone.0002001. [DOI] [PMC free article] [PubMed] [Google Scholar]
- Wang L, Yu C, Chen H, Qin W, He Y, Fan F, Zhang Y, Wang M, Li K, Zang Y, Woodward TS, Zhu C. Dynamic functional reorganization of the motor execution network after stroke. Brain. 2010;133:1224–1238. doi: 10.1093/brain/awq043. [DOI] [PubMed] [Google Scholar]
- Warren DE, Power JD, Bruss J, Denburg NL, Waldron EJ, Sun H, Petersen SE, Tranel D. Network measures predict neuropsychological outcome after brain injury. Proc Natl Acad Sci USA. 2014;111:14247–14252. doi: 10.1073/pnas.1322173111. [DOI] [PMC free article] [PubMed] [Google Scholar]
- Wick W, Stupp R, Beule AC, Bromberg J, Wick A, Ernemann U, Platten M, Marosi C, Mason WP, van den Bent M, Weller M, Rorden C, Karnath HO, The European Organisation for Research and Treatment of Cancer and the National Cancer Institute of Canada Clinical Trails Group A novel tool to analyse MRI recurrence patterns in glioblastoma. Neuro-Oncology. 2008;10:1019–1024. doi: 10.1215/15228517-2008-058. [DOI] [PMC free article] [PubMed] [Google Scholar]
- Wilson SM, Henry ML, Besbris M, Ogar JM, Dronkers NF, Jarrold W, Miller BL, Gorno-Tempini ML. Connected speech production in three variants of primary progressive aphasia. Brain. 2010;133:2069–2088. doi: 10.1093/brain/awq129. [DOI] [PMC free article] [PubMed] [Google Scholar]
- Winkler AM, Ridgway GR, Webster MA, Smith SM, Nichols TE. Permutation inference for the general linear model. Neuroimage. 2014;92:381–397. doi: 10.1016/j.neuroimage.2014.01.060. [DOI] [PMC free article] [PubMed] [Google Scholar]
- Xu T, Jha A, Nachev P. The dimensionalities of lesion-deficit mapping. Neuropsychologia. doi: 10.1016/j.neuropsychologia.2017.09.007. in press. http://dx.doi.org/10.1016/j.neuropsychologia.2017.09.007. [DOI] [PMC free article] [PubMed]
- Yourganov G, Schmah T, Churchill NW, Berman MG, Grady CL, Strother SC. Pattern classification of fMRI data: applications for analysis of spatially distributed cortical networks. Neuroimage. 2014;96:117–132. doi: 10.1016/j.neuroimage.2014.03.074. [DOI] [PubMed] [Google Scholar]
- Yourganov G, Smith KG, Fridriksson J, Rorden C. Predicting aphasia type from brain damage measured with structural MRI. Cortex. 2015;73:203–215. doi: 10.1016/j.cortex.2015.09.005. [DOI] [PMC free article] [PubMed] [Google Scholar]
- Yourganov G, Fridriksson J, Rorden C, Gleichgerrcht E, Bonilha L. Multivariate connectome-based symptom mapping in post-stroke patients: networks supporting language and speech. J Neurosci. 2016;36:6668–6679. doi: 10.1523/JNEUROSCI.4396-15.2016. [DOI] [PMC free article] [PubMed] [Google Scholar]
- Zaharchuk G. Arterial spin-labeled perfusion imaging in acute ischemic stroke. Stroke. 2014;45:1202–1207. doi: 10.1161/STROKEAHA.113.003612. [DOI] [PMC free article] [PubMed] [Google Scholar]
- Zavaglia M, Forkert ND, Cheng B, Gerloff C, Thomalla G, Hilgetag CC. Mapping causal functional contributions derived from the clinical assessment of brain damage after stroke. Neuroimage Clin. 2015;9:83–94. doi: 10.1016/j.nicl.2015.07.009. [DOI] [PMC free article] [PubMed] [Google Scholar]
- Zhang Y, Kimberg DY, Coslett HB, Schwartz MF, Wang Z. Multivariate lesion-symptom mapping using support vector regression. Hum Brain Mapp. 2014;35:5861–5876. doi: 10.1002/hbm.22590. [DOI] [PMC free article] [PubMed] [Google Scholar]
- Zhu LL, Lindenberg R, Alexander MP, Schlaug G. Lesion load of the corticospinal tract predicts motor impairment in chronic stroke. Stroke. 2010;41:910–915. doi: 10.1161/STROKEAHA.109.577023. [DOI] [PMC free article] [PubMed] [Google Scholar]
- Zopf R, Fruhmann Berger M, Klose U, Karnath HO. Perfusion imaging of the right perisylvian neural network in acute spatial neglect. Front Hum Neurosci. 2009;3:15. doi: 10.3389/neuro.09.015.2009. [DOI] [PMC free article] [PubMed] [Google Scholar]
- Zopf R, Klose U, Karnath HO. Evaluation of methods for detecting perfusion abnormalities after stroke in dysfunctional brain regions. Brain Struct Funct. 2012;217:667–675. doi: 10.1007/s00429-011-0363-4. [DOI] [PubMed] [Google Scholar]