


Abstract
A significant challenge and potential high-value application of computer-aided drug design is the accurate prediction of protein–ligand binding affinities. Free energy perturbation (FEP) using molecular dynamics (MD) sampling is among the most suitable approaches to achieve accurate binding free energy predictions, due to the rigorous statistical framework of the methodology, correct representation of the energetics, and thorough treatment of the important degrees of freedom in the system (including explicit waters). Recent advances in sampling methods and force fields coupled with vast increases in computational resources have made FEP a viable technology to drive hit-to-lead and lead optimization, allowing for more efficient cycles of medicinal chemistry and the possibility to explore much larger chemical spaces. However, previous FEP applications have focused on systems with high-resolution crystal structures of the target as starting points—something that is not always available in drug discovery projects. As such, the ability to apply FEP on homology models would greatly expand the domain of applicability of FEP in drug discovery. In this work we apply a particular implementation of FEP, called FEP+, on congeneric ligand series binding to four diverse targets: a kinase (Tyk2), an epigenetic bromodomain (BRD4), a transmembrane GPCR (A2A), and a protein–protein interaction interface (BCL-2 family protein MCL-1). We apply FEP+ using both crystal structures and homology models as starting points and find that the performance using homology models is generally on a par with the results when using crystal structures. The robustness of the calculations to structural variations in the input models can likely be attributed to the conformational sampling in the molecular dynamics simulations, which allows the modeled receptor to adapt to the “real” conformation for each ligand in the series. This work exemplifies the advantages of using all-atom simulation methods with full system flexibility and offers promise for the general application of FEP to homology models, although additional validation studies should be performed to further understand the limitations of the method and the scenarios where FEP will work best.
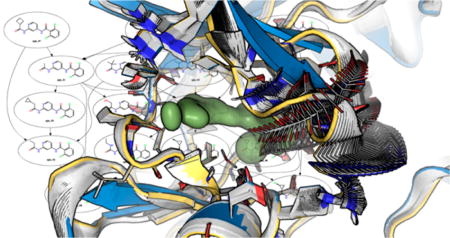
Graphical abstract
INTRODUCTION
Reliable prediction of protein–ligand binding energies is one of the grand challenges in the field of computer-aided drug design, and accurate predictions could help accelerate drug discovery efforts. Over the past few decades a multitude of methods have been developed1,2 to predict the free energy of binding, or properties that correlate with it. These methods range from computational inexpensive approaches like QSAR modeling and docking to more computationally intensive ones like quantum mechanics (QM) and molecular dynamics (MD) calculations. Alchemical free energy calculations, for which many excellent overview articles have been published over the years,3–8 are among the computationally intensive methods with the promise of robust and accurate results. One of these approaches, free energy perturbation (FEP) is based on the theoretical framework first introduced by Zwanzig9 in 1954 and has played a prominent role in the field. FEP offers a rigorous framework for computing free energies (relative or absolute) and is only limited in accuracy by the completeness of conformational sampling and the accuracy of the underlying force field used to model the interactions between all of the atoms in the system, including solvent. FEP can be used to calculate relative differences in binding affinity for a congeneric series of ligands, which reduces the amount of sampling needed to get converged results as compared with computing absolute binding energies for each ligand separately. In drug discovery lead optimization, predicting relative energy differences between similar ligands in order to prioritize molecules for synthesis and explore new chemical spaces is often a primary objective.
The FEP approach is based on sampling of the protein–ligand system (typically using either molecular dynamics or Monte Carlo) to obtain energies of the full conformational ensemble of the system while the ligand is “perturbed” over a number of steps from one molecule to another, typically through an alchemical transformation. The total free energy of the transformation is obtained by analysis of changes in potential energy in the alchemical pathway between the initial and final molecules. The method explicitly considers the conformational flexibility of the entire system (receptor, ligand, and solvent) at a specified temperature, thus accounting for the enthalpy and entropy of binding, and therefore is an attractive approach for computing free energies. However, due to limited computational resources, questionable force fields, unavailability of enhanced sampling algorithms (for instance, replica exchange or other implementations10–13), and technical challenges associated with setting up and running FEP jobs, only anecdotal reports6,14–20 of alchemical free energy calculations applications have been published for a limited number of target classes with very few ligands over the last decades. Fortunately, sampling has improved considerably in recent years with the availability of molecular dynamics codes that run on general-purpose graphics processing units (GPGPUs), which can offer more than hundredfold speedup over a CPU. In addition, scientific and technical advantages (described below) have enabled FEP to be applied in real-world drug discovery projects with a high enough throughput and accuracy to improve the efficiency of projects.
Recently, researchers from Boehringer Ingelheim21 reported an application of thermodynamic integration (TI), which is conceptually similar to FEP, in drug design on 5 targets with a total of 92 ligands. This study demonstrated the applicability of a rigorous free energy approach in an automated fashion for industrial applications. A slightly larger test set of 107 ligands was published by Mikulskis22 using free energy simulations. Furthermore, a very potent inhibitor for the macrophage migration inhibitory factor (MIF or MMIF) was developed with the help of FEP calculations.23
Wang et al.24 then described the FEP+ method, which we use in this work, that combines the classical FEP approach with an accurate modern force field (OPLS2.1 and OPLS325,26), an efficient GPU-enabled parallel molecular dynamics engine (Desmond), REST27,28 enhanced sampling, cycle-closure correction28,29 to incorporate information from multiple alchemical pathways, and the FEP Mapper to automate setup and analysis of the calculations. The FEP+ approach has recently been applied24 on a variety of protein targets and ligand structures. For example, Steinbrecher et al.30 applied FEP+ to fragment-based optimization and shown success, which is promising given the importance and challenges in the fragment-based drug design field. Recently, Lenselink et al.31 reported the application to GPCRs in a retrospective as well as prospective fashion, where a novel and highly potent A2A inhibitor was discovered. While the above studies reported relative binding free energy predictions, which is usually sufficient in a drug design context, recent progress in absolute binding free energy calculations32 as well as conformational transition pathways33 has also been reported.
Common to all of these previous FEP and TI studies using free energy simulations are the specific starting conditions for the systems. Namely, all simulations noted above were started from high quality X-ray structures of the protein receptor that were cocrystallized with one of the ligands from the congeneric series or a similar analogon. While free energy approaches can still provide significant value to the drug discovery process when limited to systems where a high quality crystal structure exists, the value would increase considerably if the approach could be successfully applied to homology models. Indeed, in drug discovery a significant portion of projects do not have high-resolution crystal structures of the target, which is especially true for new drug targets where novel lead matter is sought. In such cases, structure-based drug design (SBDD) approaches must rely on homology models of the target. Given the sensitivity of most structure-based approaches (e.g., docking34) to the protein model, it is logical to question whether free energy calculations have the same degree of sensitivity to the input geometry of the protein, and more generally, if free energy calculations are applicable to homology models at all.
In theory, free energy calculations should be less sensitive to the exact coordinates of the input structures than traditional SBDD approaches (e.g., docking), since the molecular dynamics sampling allows for adjustments and relaxation of the system. However, only anecdotal evidence has been published to support or refute this claim. Boukharta et al. used a homology model in conjunction with free energy calculations for Ala scanning.35 Genheden et al. reported a comparison study36 of free energy simulations on homology models in 2012, although only 2 targets and a handful of ligand pairs were explored in that study. In the work by Genheden, predictions were performed on factor Xa and dihydrofolate reductase for 14 ligands in total using TI and the MD engine in Amber11 and were compared between crystal structure and homology models. The author concluded that MD-based free energy calculations could yield accurate results using homology models if a sufficiently good template exists. In addition, Park and Lee37 used free energy calculations on a homology model of histone deacetylase to rationalize activities of 12 small molecule inhibitors. The authors determined that ligand solvation is important and the balance between interactions/desolvation is critical in accurately predicting binding free energies and finding more potent molecules. However, both of these studies were limited in scope due to the low number of targets (1–2) studied and small number of ligands. Thus, here we design a more extensive experiment to study free energy methods applied to homology models using a larger number of targets (4) and ligands (more than 60 in total across the 4 targets) than has previously been explored in any single study.
We first validate the robustness of FEP+ to differences in input coordinates of the protein–ligand system by studying an engineered binding pocket in the model system T4 lysozyme and compare FEP+ results for the same ligand series starting from different crystal structures to determine the sensitivity of FEP+ to crystal structure variations. Upon observing robust results with respect to variations in input structures for T4 lysozyme, we then turn to the homology modeling study by selecting four different protein systems originating from different target classes (a protein kinase, an epigenetic bromodomain target, a transmembrane GPCR, and BCL-2 family protein–protein interaction interface) from which we had previously verified that FEP+ can be successfully applied on the crystal structures using the data sets presented here.24,30,31 For each of these targets, we build homology models using templates with varying degrees of similarity (from 87% down to 22%) and predict binding free energies using FEP+ using several ligand series. We find that homology models can indeed be used in lieu of crystal structures for the cases studied here with little to no degradation in results. While more work is needed to fully assess the applicability of free energy approaches to homology models, this work significantly expands upon the existing literature and supports the previous findings that binding free energy calculations have the promise of working robustly on homology models.
MATERIALS AND METHODS
All calculations were conducted using the Schrödinger molecular modeling suite (version 2015-2). All protein structures were obtained from the Protein Data Bank (PDB)38 and prepared using the Protein Preparation Wizard.39 In this step, force field atom types and bond orders are assigned, missing atoms are added, tautomer/ionization states are assigned, water orientations are sampled, Asn, Gln, and His residues are flipped to optimize the hydrogen bond network, and a constrained energy minimization is performed. All resolved crystal water molecules were retained. For the A2A structure (PDB code 4eiy) the b(562)RIL part (a thermo-stabilized apocytochrome used to stabilize the GPCR for crystallization) was removed and the missing third intracellular loop added using Prime.
Ligand structures as well as affinity measurement data were obtained from literature. For BRD4, data from Vidler et al.40 and Filippakopoulos et al.41 were combined with affinity data for a series of unpublished compounds. Ligand and binding data for MCL-1 were obtained from Friberg et al.42 Tyk2 data were derived from Liang et al.43,44 GPCR data were collected from literature from Minetti et al.45 Finally, data for the T4 lysozyme model binding site were described by Mobley et al.46
The structures were prepared with LigPrep47 including a minimization with the OPLS3 force field.25,26 All chiral centers were retained as specified in the literature. One low energy ring conformation per compound was generated. Ionization states and tautomer forms were enumerated at pH 7.0 ± 2.0 with Epik.48–50 The Force Field Builder (FFBuilder) tool, which is part of the FEP+ package, was used to automatically generate accurate force field torsional parameters derived from quantum mechanics for all ligands containing substructures not fully covered by the standard OPLS3 parameters. FEP+ is available for commercial, governmental, nonprofit, and academic institutions from Schrödinger.
Homology models were prepared based on the sequence of the reference crystal structure for each target. PDB template structures for the models were identified using BLAST with different level of sequence similarity. Only template structures from the same protein family were used. For instance, we did not attempt to build a kinase model using a protease structure simply to explore the effects of moving toward very low sequence identity. In a real-world situation where no crystal structure for a target protein is available, such a strategy (i.e., using an unrelated protein for a template) would likely not be pursued. Models were built using the program Prime51–53 and using the alignment from GPCRdb for A2A.54,55 The hydrogen bond network of the obtained structures was afterward optimized using the Protein Preparation Wizard.
For the reference crystal structures, ligands were docked into the binding site of each target using Glide SP56–58 with core constraints to achieve a good alignment. For the homology models, we aimed to use a reasonable protocol to generate good initial poses. We first performed a Glide SP docking without constraints but found that good poses could not be generated in all cases, as might be expected for docking to homology models.59 As the intention of this study was to determine the sensitivity of FEP+ calculations to homology models, we concluded that it was not sensible to perform calculations on obviously incorrect ligand binding modes, so we conducted additional docking calculations using H-bond constraints and/or receptor flexibility to generate good initial poses. In the cases of BRD4 and Tyk2, H-bond constraints were added to ensure that the core made similar interactions for all ligands in the series (without constraints some ligands did not dock properly). For MCL-1 (hm-2nl9) and A2A (hm-4amj), Induced Fit Docking (IFD),60 which involves conformational sampling of binding site side chains and backbone flexibility through minimization, was required to obtain good input poses. IFD was also used in the case of the Tyk2 X-ray structure 3nyx. For each target, the docked pose of the reference ligand closest to the cocrystallized structure (lowest heavy-atom RMSD) was used, followed by Glide SP docking of the other ligands with core constraints to the aforementioned docked reference pose. This protocol was followed to ensure a reasonable input pose for FEP+ while still using a realistic docking protocol that could be implemented in a prospective drug discovery project. Employing a fully automated and consistent protocol for all ligands and targets is outside the scope of the current study, although recent advances in docking pose prediction using molecular dynamics refinement offer promise that an automated protocol could be possible to implement in the future.61 Nonetheless, in many pharmaceutical lead optimization projects some knowledge of the ligand binding mode is generally available (e.g., from protein mutation studies and/or ligand SAR), so the use of constraints and nondefault docking settings would be routine.
Using the aforementioned ligand binding modes, binding affinities were predicted using the FEP+ methodology, which has been described elsewhere.24 In short, FEP+ combines free energy perturbation (FEP) as initially described by Zwanzig9 with an accurate modern force field (OPLS3), efficient GPU-enabled parallel molecular dynamics with Desmond, REST62 enhanced sampling, cycle-closure correction28,29 to incorporate redundant information into free energy estimates, and the FEP Mapper to automate setup and analysis of the calculations. For a mutation from ligand A to ligand B, the functional groups involved directly in the perturbation are included in the REST region. The REST region encompasses the perturbed ligand atoms plus the adjacent rotatable bond. Analogous to the work of Lenselink et al.31 for the A2A system, we pre-equilibrated the lipid bilayer water box using a 2.4 ns simulation protocol before starting the FEP+ simulations. As such, the automatic solvent box setup step of the FEP Mapper tool was omitted. Positioning of the receptor structures in the lipid membrane was done with help of the respective template available in the OPM database.63
All calculations were run on Nvidia Geforce GTX-780 and GTX Titan Black GPUs. The mutation graph, which was generated for the crystal structure reference system, was used for all other structural models of that target to ensure consistency in results. Calculations took approximately 1 day per ligand perturbation per GPU for the soluble proteins (BRD4, Mcl1, and Tyk2), although exact simulation times varied based on system size and GPU type. The A2A GPCR simulations took approximately two times longer due to a much larger number of atoms resulting from the inclusion of the explicit lipid bilayer.
The MM-GBSA calculations were performed as implemented in Prime with the VSGB264 solvation model and the OPLS3 force field. The protein binding site was kept rigid in one run and conformations of the binding site were sampled according to the hierarchical procedure described by Borrelli et al.65 in a second run.
RESULTS AND DISCUSSION
Sensitivity to Crystal Structure Variations with T4 Lysozyme
Before performing the homology modeling studies, we conducted an initial study to investigate the sensitivity of FEP+ binding free energy predictions to the coordinates of the starting receptor structure. For this part of the study, we chose the L99A mutant of T4 lysozyme, which contains an engineered, buried, nonpolar cavity and has been subject of several computational studies.46,66–69 For our FEP+ simulations we used three different structures obtained from the PDB (codes: 181l, 2oty, and 184l) which all have high-resolution crystals (1.8 Å). The overall structural differences, and particularly the differences in the binding site, are minimal but still significant enough to explore the sensitivity of FEP+ to small structural variations in the input structure (see Table 1 for details). This is a necessary test before proceeding to the more challenging case of running FEP on homology models. In short, if the FEP results differ significantly for such similar receptor structures, then there would be little need to investigate the more challenging homology model cases until the crystal structure sampling problems have been addressed.
Table 1.
Comparison of Receptor Models Used for FEP+ Calculationsa
| target | input protein structure for FEP+ |
resolution (Å) | whole protein identity (%) |
binding site identity (%) |
binding site RMSD (Å) backbone/side chains |
|---|---|---|---|---|---|
| T4 lysozyme L99A | 181l | 1.80 | |||
| 184l | 1.80 | 100 | 100 | 0.29/0.42 | |
| 2oty | 1.83 | 100 | 100 | 1.62/2.00 | |
| BRD4 | 3mxf | 1.60 | |||
| hm-3s91 (BRD3) | 2.06 | 80 | 91 | 1.65/1.83 | |
| hm-3oni (BRD2) | 1.61 | 38 | 60 | 1.68/1.69 | |
| MCL-1 human | 4hw3 | 2.40 | |||
| hm-2nl9 (MCL-1 rat) | 1.55 | 87 | 63 | 2.11/2.67 | |
| hm-4lvt (Bcl-xL) | 2.05 | 22 | 35 | 2.67/3.28 | |
| Tyk2 | 4gih | 2.00 | |||
| hm-3eyg (JAK1) | 1.90 | 58 | 79 | 0.89/1.57 | |
| hm-3eqr (ACK1) | 2.00 | 38 | 36 | 1.11/2.04 | |
| hm-1byg (CSK) | 2.40 | 31 | 21 | 1.84/3.28 | |
| 3nyx | 2.50 | 100 | 100 | 2.61/3.03 | |
| A2A | 4eiy | 1.80 | 100 | ||
| hm-4amj (β1-AR) | 2.30 | 28 | 28 | 5.79/7.38 |
The second column either shows the PDB code of the crystal structure or the PDB structure used as template for building a homology model (with prefix “hm”). The target name is specified in parentheses if not identical to the original target. The “binding site” is defined as all residues within 5 Å of the cocrystallized ligand. Identity and RMSD measurements are relative to the first structure listed for each target.
For the three T4 lysozyme receptor structures, we used a data set of 13 ligands with known experimental binding free energies obtained from the literature.46 The ligands were prepared and placed into the binding cavity as outlined in the Materials and Methods section. An FEP+ mutation graph was generated to connect all of the ligands through perturbation pathways and subsequently the calculations were run. The results for all three systems were highly predictive (high correlation between experimental and computed binding free energies, slope close to unity, and low error) for this data series (see Table 2). The higher root-mean-squared error (RMSE) for the 184l receptor arises from three poor predictions (all involving n-methylaniline); all other perturbations are of same accuracy as for the other receptor structures. The Predictive Index (PI) as initially described by Pearlman and Charifson70 was also calculated for all predictions presented in this work. The PI function includes a weighting term that depends on the difference between the experimental values of two molecules (A and B), which reflects the fact that a good function should be able to differentiate between changes that result in large differences in binding. Such a metric is better suited to measure the ability of a method to accurately predict better and worse binders, which highly relevant in a drug design scenario. For the T4 lysosyme cases, the PI is essentially equal for all three receptor models studied here. These results for T4 lysozyme demonstrate that similar results can be obtained when running FEP+ on different input structures. Based on these encouraging results, we set forth on the primary aim of this study—to investigate the performance of FEP+ on homology models.
Table 2.
Statistics for FEP+ Results of T4 Lysozyme L99A Data Set
| protein structure |
R2 | slope | MUE (kcal/mol) |
RMSE (kcal/mol) |
PI |
|---|---|---|---|---|---|
| 181l | 0.85 | 1.30 | 0.71 | 0.86 | 0.86 |
| 184l | 0.78 | 1.47 | 0.96 | 1.21 | 0.81 |
| 2oty | 0.78 | 1.23 | 0.73 | 0.89 | 0.82 |
In order to directly study the influence of only the receptor structure on the FEP+ results we began with systems where FEP+ performed well using the X-ray crystal structures as input. To mimic a real-world scenario, we generated multiple docking poses using various approaches and chose a pose most similar to the known X-ray pose as a reference, which was used to perform core-constrained Glide docking of all other ligands in the series. While the protocol does introduce an element of human bias, we concluded that it is the only way to isolate the influences of the FEP+ results on the receptor structure only (i.e., decouple the sensitivity to the receptor structure from the pose prediction). In addition, this approach serves to emulate a common workflow that takes place in drug discovery projects, where a significant effort is given to generate a reasonable pose for at least one ligand in a series (for example, analyzing SAR, comparing to other crystal structures with similar ligands, using experimental constraints like NMR, and performing additional pose refinement with more computational expensive methods like molecular dynamics). A more extensive study on pose prediction in homology models is not the aim of this work and has been for instance for the case of GPCRs discussed elsewhere.59
The pharmaceutically relevant protein systems we choose were the bromodomain containing protein 4 (BRD4), the induced myeloid leukemia cell differentiation protein (MCL-1), the tyrosine kinase 2 (Tyk2), and the GPCR–adenosine A2A receptor. Information on the data sets for each target can be found in Table 3. Binding free energies for each ligand were obtained from the affinity data reported in literature. In general measurements indicated with a “>” where not converted to a ΔGbind due to the inaccuracy. For the MCL-1 and A2A data set the Ki was converted to ΔGbind using the appropriate equation. The same was done for the experimental data for the Tyk2 data set although only IC50 values are reported in the literature. Here approximate identity between Ki ≈ IC50 was assumed. The same approximation was used for the BRD4 data set, however for three compounds the concentration of the reported percent inhibition (which is not too far from 50%) was assumed to be the IC50 value. For three others no conversion to ΔGbind was calculated (for details see the Supporting Information). While we are aware that the above-mentioned approximations do introduce some errors in the experimental binding free energies, the error introduced with this is negligible. In this context it is important to highlight that the evaluation of FEP+ itself is not the scope of this work; rather, we are focused on the comparison between the different receptor models to determine how much, if at all, the FEP+ results degrade when moving from a crystal structure to a homology model.
Table 3.
Statistics on Data Sets Used for FEP+ Calculations
| protein system | |||||
|---|---|---|---|---|---|
|
|
|||||
| T4 lysozyme L99A | BRD4 | MCL-1 | Tyk2 | A2A | |
| no. ligands | 13 | 21 | 15 | 16 | 9 |
| experimental binding affinity range (kcal/mol) | 2.10 | 5.60 | 2.27 | 4.28 | 2.97 |
| ligand series reference | 46 | 40, 41 | 42 | 43, 44 | 45 |
| expected FEP+ R2-valuea | 0.33 ± 0.21 | 0.70 ± 0.10 | 0.13 ± 0.15 | 0.48 ± 0.16 | 0.39 ± 0.22 |
| expected expt. R2-valuea | 0.59 ± 0.17 | 0.88 ± 0.04 | 0.24 ± 0.18 | 0.74 ± 0.09 | 0.66 ± 0.16 |
Calculated according to Brown et al.71 We assume an RMSE of 1.1 kcal/mol for FEP+ calculations and 0.4 kcal/mol for experimental binding energies.
Each initial PDB crystal structure was prepared using the Protein Preparation Wizard in Maestro. We built several homology models using Prime with different templates of decreasing similarity to our target sequence. For the kinase Tyk2 we also included a second crystal structure in our experiment that shows an alternative DLG loop conformation compared to our reference receptor. Details on the target and template structures (whole protein and binding site sequence similarity) are summarized in Table 1. Ligands were placed ensuring a consistent binding mode using the procedure described above. FEP+ calculations were set up and executed based on these prepared structures, as described in the Materials and Methods section. Statistics of the results from the FEP+ predictions are reported in Table 4. Individual binding free energy (ΔG) predictions for each ligand as well as the mutation graphs are shown in the Supporting Information. Plots showing the correlation between experimental and predicted binding affinity are shown in Figure 1. Below, we describe the results for each target in more detail.
Table 4.
Statistics for FEP+ Results
| protein system | protein structure | RMSD series ligand core (Å)a | R2b | slopeb | MUE (kcal/mol) | RMSE (kcal/mol)b | PI |
|---|---|---|---|---|---|---|---|
| BRD4 | 3mxf | 0.2 ± 0.4/0.6 ± 0.6/0.6 ± 0.9 | 0.61 [0.24,0.84] | 0.65 [±0.72] | 1.39 | 1.62 [0.93,1.83] | 0.86 |
| hm-3s91 | 0.4 ± 0.0/2.2 ± 0.1/0.5 ± 0.0 | 0.61 [0.24,0.84] | 0.65 [±0.72] | 1.18 | 1.44 [0.88,1.72] | 0.82 | |
| hm-3oni | 0.5 ± 0.3/2.4 ± 0.1/0.6 ± 0.0 | 0.68 [0.33,0.87] | 0.65 [±0.66] | 1.37 | 1.60 [0.93,1.82] | 0.86 | |
| MCL-1 | 4hw3 | 0.2 ± 0.3 | 0.19 [0.04,0.66] | 0.92 [±1.55] | 0.83 | 1.03 [0.70,1.60] | 0.71 |
| hm-2nl9 | 2.9 ± 0.2 | 0.21 [0.03,0.68] | 0.68 [±1.30] | 0.56 | 0.77 [0.60,1.39] | 0.71 | |
| hm-4lvt | 3.7 ± 0.1 | 0.27 [0.01,0.72] | 0.88 [±1.36] | 0.76 | 0.86 [0.64,1.47] | 0.84 | |
| Tyk2 | 4gih | 1.1 ± 0.2 | 0.66 [0.26,0.88] | 0.51 [±0.63] | 0.64 | 0.79 [0.63,1.33] | 0.88 |
| hm-3eyg | 1.7 ± 0.0 | 0.71 [0.33,0.90] | 0.54 [±0.63] | 0.65 | 0.83 [0.65,1.36] | 0.93 | |
| hm-3eqr | 1.7 ± 0.0 | 0.92 [0.77,0.97] | 0.65 [±0.45] | 0.39 | 0.53 [0.52,1.09] | 0.99 | |
| hm-1byg | 2.4 ± 0.0 | 0.69 [0.30,0.89] | 0.54 [±0.63] | 0.63 | 0.81 [0.64,1.35] | 0.88 | |
| 3nyx | 1.3 ± 0.0 | 0.80 [0.49,0.93] | 0.57 [±0.57] | 0.49 | 0.66 [0.58,1.21] | 0.93 | |
| A2A | 4eiy | 2.2 ± 0.1 | 0.39 [0.01,0.83] | 0.74 [±1.18] | 0.81 | 0.93 [0.63,1.66] | 0.83 |
| hm-4amj | 5.6 ± 0.0 | 0.47 [0.00,0.86] | 1.25 [±1.41] | 1.50 | 1.87 [0.89,2.35] | 0.83 |
Average RMSD between ligand poses used for FEP+ calculations and the cocrystallized ligand of the reference crystal structure. RMSD values were only calculated for heavy atoms of the central ring scaffold. In the case of BRD4 three different subseries were treated independent and thus individual RMSD values are reported.
Error intervals at a 95% confidence limit are calculated according to the work of Nicholls.72
Figure 1.

Correlation plots between experimentally observed and predicted binding free energy using different receptor structures (crystal and homology models). Predicted uncertainties are also shown. The ±1 and ±2 kcal/mol ranges around the diagonal are highlighted in light and dark gray to easier spot outliers. Overlay of respective receptor model structures are shown to the right of the correlation plots. Carbon atoms are colored as in the correlation plot. Hydrogen atoms and water molecules are hidden for clarity. The original crystal structure ligand is shown in gray.
BRD4
For BRD4, in total three different receptor models were examined using FEP+. These protein models are relative similar to each other (see overlay in Figure 1) due to the high similarity of the homology model templates (BRD2 and BRD3). Although those have different level of overall sequence identity, the sequence identity of the binding site as well as the atom RMSD is relatively high. No other template structure with different characteristics was available in this series (considering only bromodomains) to construct an entirely different model. The correlation coefficient and slope vary minimally among the different models, with little to no degradation moving from the crystal structure to homology models. The error metrics (MUE and RMSE) fluctuate slightly higher but still show good numerical accuracy overall.
MCL-1
The data set used for MCL-1 shows a relatively small dynamic range in terms of the experimentally measured binding affinity. Therefore, the correlation coefficient is expected to be smaller than for the BRD4 data set given the same RMSE (see Table 3). Also, the templates used for homology modeling have lower sequence similarity to the target structure than in the case of BRD4. Here, we used a rat structure of MCL-1 and human Bcl-xL as the templates for homology modeling, the latter having only 35% binding site identity to human MCL-1 (see Figure 1 for a comparison of the models). Despite these differences, the correlation coefficients, Predictive Indices, and RMSEs for the three starting structures (MCL-1 crystal structure and the two homology models) are all similar, and quite good, demonstrating the ability of the molecular dynamics in FEP+ to resolve fairly significant initial structural variations. Interestingly, the errors (RMSE) are lower for the homology models than for the crystal structure, although the differences are within the statistical uncertainty in the calculations (see errors in Table 4). Three inactive compounds (ligands 1, 6, and 12) do not have a dedicated ΔGexp and therefore are not included in statistical measurements, but they are all predicted to be inactive by FEP+ in all studied receptor models.
To understand the origins of the respectable performance of this challenging case, we calculated the RMSF for each amino acid during the course of the MD simulation for the two perturbation end points (λ = 0 and λ = 1) and compared with the RMSD for each amino acid between the crystal structure and the respective homology model. If an amino acid has a rather different conformation in the homology model (high RMSD), then we would expect also a higher mobility (high RMSF) during the MD simulation as the receptor adjusts toward the “right” structure. As some regions of the protein have an intrinsically higher mobility we also plotted the RMSF values for the crystal structure simulation for reasons of comparison. The plots for MCL-1 resulting from this analysis are shown in Figure 2 (similar plots for all other targets studied here are provided in the Supporting Information).
Figure 2.

Overlay of RMS fluctuations obtained from MCL-1 MD trajectories with λ = 0 and 1. The values are overlaid for each receptor structure and shown as line. For comparison the RMS deviation calculated for all atoms of each amino acid between the starting receptor structure for each FEP+ run with respect to the X-ray reference receptor structure are plotted as bars. Amino acids within 5 Å of the reference X-ray receptor structure cocrystallized ligand are highlighted by a vertical line.
To exclude the possibility that the observed fluctuation is just a variation around the high RMSD conformation, we performed an additional analysis for all amino acids where the RMSD to the crystal structure reference is higher than the average plus half of the standard deviation of the values for all residues. For these amino acid residues we calculated the time evolution of the RMSD values with respect to the crystal structure reference for all λ = 0 and 1 trajectories of all permutations in the data set. We then monitored the minimum RMSD value and compared with the initial RMSD to see if the residue was in fact getting closer to the crystal structure conformation.
Indeed, we see that the more mobile regions for the homology models correspond to the regions with higher initial RMSD to the X-ray crystal structure. Also, the structure with greater deviation from the X-ray crystal structure shows higher RMSF values across the whole structure. For the residues mentioned above, 96% from hm-2nl9 and 100% from hm-4lvt, results showed that the average of the minima of the different trajectories is lower than the initial RMSD value. The observations on RMSF show that the MD simulations moved the nonoptimal geometry of the lower sequence identity homology models more than the one with higher sequence identity and more than the X-ray crystal structure. In addition, the RMSD time series analysis indicates that this movement is at times bringing the conformations of the homology models closer to the X-ray structure model. This type of MD analysis is intrinsically complicated, as one has to draw conclusions for multiple transformations and many degrees of freedom in the system, with each transformation consisting of multiple trajectories, which consist of states exchanging from different replicas. While it is hard to judge what are the “right” states of the ensemble for each ligand, our analysis suggests that the simulations are in fact sampling important conformational states of the homology model needed to reproduce the correct structure. The binding site amino acids, highlighted in the plots using vertical lines, mostly have lower RMSD values compared to other parts of the protein structure, suggesting that the Induced Fit Docking procedure, which accounts for flexibility of the protein binding site, did a good job at accurately modeling the binding site. Both aspects are likely, to some degree, the reason for the high quality performance of the homology models, which are on par with the X-ray crystal structure.
Tyk2
Given the many available homologues of Tyk2, we were able to span a broad range of sequence identities for this target, ranging from 58% down to 31% for the entire protein and from 79% down to 21% for the binding site. As in the other cases, we obtain consistent FEP+ predictions across the range of homology models (see Figure 1). In certain cases, the statistics for the homology models are better than for the X-ray crystal structure but reported error intervals as well as Student’s t-test shows that this is not statistically significant (test data not shown). Indeed, for both the crystal structure and homology models, the errors are close to the expected accuracy limit of the FEP+ method. Looking at the RMSD and RMSF plots in the Supporting Information, we see the same general trends as for BRD4 and MCL-1, supporting our hypothesis to explain the similar performance between the crystal structure and homology models. In short, models that have greater initial differences show higher fluctuations during the MD and move toward the correct conformation in some of the MD snapshots. Binding site residues are to a large degree already structurally similar in the homology models to the crystal structures.
A2A
For the adenosine A2A receptor, a homology model was created from the β1 adrenergic receptor structure (another class A GPCR; PDB ID 4amj), with 28% sequence identity across the entire protein and in the binding site. The FEP+ results using the homology model as receptor structure degrade slightly as compared with the X-ray structure, although the results are still respectable. The correlation (R2) between both runs is within the expected range of values given the composition of the data set. Both values differ only slightly from each other, which is within the normal range of fluctuation for different simulation runs. However, the error (represented by MUE or RMSE) clearly shows that the simulation using the homology model is less accurate.
As in the case of the other protein systems studied here, the RMSF analysis for this GPCR target reveals an analogous trend. Regions with larger deviations in the starting structure result in higher fluctuations during the MD simulations. However, several amino acids with larger RMSD than the average, including several residues of the binding site, do not show increased mobility in the simulation. This suggests that the necessary adaption of the binding site to the ligand does not fully takes place, which is in line with the higher observed error for the FEP+ predictions on the homology model of this target. Potentially the membrane surrounding is the reason for the slower equilibration. Here, an additionally optimized homology model with refined loops between the transmembrane helices as basis for the FEP+ simulations could be beneficial. Additional refinement steps are typically in practical application of homology models in drug design projects but this was outside the scope of the experiment we design for this work here. Our model is in line with several others submitted during the GPCR Dock 2008 competition.73 One key binding motif (the interaction with Asn253) is present in the homology model and partly retained in the MD simulations. The second key motif (the interaction with Phe168) is missing but could potentially be established after a loop refinement near the binding site.
MM-GB/SA
As FEP+ calculations are a rather computationally expensive approach to computing binding free energies, it is of interest to explore faster methods, such as MM-GB/SA, which has been shown previously to have good predictive capabilities for several systems.2,74,75 The MM-GB/SA approach applied here uses a molecular mechanics force field (similar to FEP+), but the solvent is treated implicitly with a continuum model (as opposed to explicit solvent in FEP+) and the protein is sampled only through minimization or conformational sampling of the binding site residues (not full molecular dynamics as in FEP+). In addition, MM-GB/SA as applied in this work is an end point method, analyzing only the initial and final states of the perturbation (i.e., the ligands of interest) and not integrating over the perturbation pathway to obtain a true free energy estimate.
The statistical characterization for the MM-GB/SA results is summarized in Table 5 and details for each compound are given in the Supporting Information. While MM-GB/SA does have some predictive power when using a crystal structure, correlations with experiment are not as strong as FEP+ also values for the Predictive Index is significantly lower. In addition, the slope is generally far from 1, thus not allowing comparison of energies between different systems. In the case of BRD4, statistical parameters suggest that the performance using the homology model is good and does not degrade relative to the X-ray crystal structure, However, looking at the individual predictions (see the Supporting Information) the weakest binding compounds or rather inactive ligands are not predicted to be inactive using MM-GB/SA in several cases quite contrary to FEP+. For MCL-1, the MM-GB/SA performance degrades considerably (if no receptor sampling is applied) when the hm-2nl9 homology model is used and still degrades notably with receptor sampling, indicating that conformational search used in MM-GB/SA is not appropriately adjusting the structures like the MD simulations in FEP+. In the case of Tyk2, we also observe degradation in the results for the homology models. However, at least for the homology model based on PDB structure 3eyg (JAK1; the template with the highest homology to Tyk2) the conformational search in MM-GB/SA does minimally improve the results and maintains a reasonable Predictive Index. Finally, in the case of the A2A receptor, MM-GB/SA also gives good correlation between predictions and experimental data. Results for the crystal structure are better than data reported previously.76 However, as in almost all calculations it massively overestimates the binding free energy. Also R2 is a bit misleading again as the individual predictions show that for instance the least active compounds are not predicted to have the worst affinity. In addition, the increased conformational sampling result in no improvement for the homology model as the result was already reasonable. In general it is clear that MM-GB/SA could be useful in some cases to predict binding free energies, but the results are poorer on average and less consistent than FEP+. As one cannot know in a prospective drug design project when MM-GB/SA might perform well, the additional computational effort for FEP+ is likely justified by the superior accuracy and robustness of the predictions.
Table 5.
Statistics for MM-GB/SA Resultsa
| rigid receptor | 5 Å sampling | ||||||
|---|---|---|---|---|---|---|---|
|
|
|
||||||
| protein system | protein structure | R2b | slopeb | PI | R2b | slope | PI |
| RD4 | 3mxf | 0.44 [0.08,0.75] | 6.50 [±2.72] | 0.61 | 0.48 [0.11,0.77] | 5.69 [±2.44] | 0.63 |
| hm-3s91 | 0.42 [0.06,0.74] | 5.22 [±2.47] | 0.58 | 0.48 [0.11,0.77] | 4.95 [±2.51] | 0.56 | |
| hm-3oni | 0.43 [0.07,0.74] | 5.44 [±2.27] | 0.64 | 0.43 [0.07,0.74] | 6.55 [±2.75] | 0.56 | |
| MCL-1 | 4hw3 | 0.30 [0.00,0.73] | 10.13 [±4.40] | 0.59 | 0.27 [0.01,0.72] | 8.96 [±4.31] | 0.57 |
| hm-2nl9 | 0.00 [0.00,0.34] | −0.86 [±4.53] | −0.03 | 0.10 [0.11,0.58] | 3.40 [±3.73] | 0.46 | |
| hm-4lvt | 0.25 [0.01,0.70] | 3.84 [±2.91] | 0.61 | 0.41 [0.01,0.79] | 9.49 [±3.81] | 0.67 | |
| Tyk2 | 4gih | 0.49 [0.08,0.80] | 2.77 [±1.78] | 0.70 | 0.32 [0.00,0.70] | 1.72 [±1.67] | 0.55 |
| hm-3eyg | 0.10 [0.06,0.52] | 1.05 [±1.84] | 0.34 | 0.13 [0.04,0.55] | 1.24 [±1.87] | 0.55 | |
| hm-3eqr | 0.12 [0.05,0.54] | 1.20 [±1.91] | 0.33 | 0.01 [0.20,0.35] | 0.26 [±1.64] | 0.16 | |
| hm-1byg | 0.02 [0.17,0.38] | 0.49 [±1.91] | 0.25 | 0.06 [0.10,0.46] | 0.79 [±1.90] | 0.28 | |
| 3nyx | 0.65 [0.24,0.87] | 3.18 [±1.65] | 0.84 | 0.22 [0.00,0.63] | 1.06 [±1.51] | 0.51 | |
| A2A | 4eiy | 0.48 [0.00,0.87] | 6.06 [±3.10] | 0.55 | 0.30 [0.04,0.80] | 5.48 [±3.54] | 0.37 |
| hm-4amj | 0.49 [0.00,0.87] | 8.29 [±3.56] | 0.58 | 0.63 [0.07,0.91] | 16.01 [±4.30] | 0.73 | |
CONCLUSIONS
In this work we have demonstrated the successful application of relative binding free energy calculations, as implemented in the FEP+ package, to homology models using a single simulation protocol on several small molecule series and diverse protein targets. Using the FEP+ method, we find a high level of predictability—in fact, in most cases studied here we do not observe significant degradation in the results when moving from a crystal structure to a homology model. The homology of the templates to the targets ranged from high (80% whole protein, 91% in the binding site) to low (22% whole protein, 21% in the binding site), suggesting a broad target space that could potentially be addressed with approaches like FEP+, as opposed to only using relying on crystal structures. Indeed, if targets without crystal structures and a reasonably close homologue could still be viable for FEP+ calculations it would expand the accessible targets space significantly. This is in line with the findings of Genheden36 on two different targets using a different free energy simulation protocol, which supports the hypothesis that free energy methods can be highly predictive on homology models. Given the broad range of target classes covered here and in previous works, one gains confidence that this conclusion will hold true for protein systems not yet studied with FEP+. However, not all systems will work and special care must be taken to build accurate homology models. For example, Genheden found that an incorrect loop conformation for one of the models resulted in significant degradation of the results. Analogously, we observe much larger errors in the predictions for the GPCR system studied here, where not all loops close to the binding site sampled the correct conformation.
While the results presented here are encouraging, there are a few important points to consider that likely resulted in the surprisingly robust binding free energy predictions that we observed. First, a good binding mode was used as a starting point for all FEP+ calculations. In some cases, the poses were obtained directly from docking as the top rank, meaning they could have been selected in a real project without any user bias. However, in the cases where the top ranked pose was not correct we did not pursue running FEP+ on incorrect poses because the simulation time for our calculations is likely insufficient to sample significantly different binding modes with high energetic transition barriers between the states. As such, we used multiple docking protocols, some of which included constraints and protein flexibility, and chose the top-scoring pose that was within 2.0 Å of the crystal structure as a starting point for the FEP+ calculations. We feel that this is a reasonable decision, and in fact most drug discovery projects in the hit-to-lead or lead optimization stages contain SAR and/or mutagenesis data that allows for a more informed selection of the best pose from an ensemble of docking poses. Indeed, in all cases here the pose selected was within the top five scoring poses. Clark et al.61 recently reported an improved pose prediction method that combines traditional docking (Glide) and Induced Fit Docking (IFD) with metadynamics to select the top pose. Approaches like this, which include molecular dynamics sampling of the system in explicit water, should reduce the need for biasing the pose selection and will be explored in conjunction with FEP+ applied to homology models in future works.
In addition to the pose selection matter discussed above, we also chose systems where FEP+ worked well on the crystal structure and where good homology modeling templates existed. Even in the case of low homology, the templates all had good resolution and electron density for all residues around the binding site. In some projects it may be necessary to perform additional refinement of the homology model before docking and FEP+ calculations. Such refinement may involve adding residues with missing density, modeling insertions/deletions, predicting conformations of flexible loops, identifying the location of ions/cofactors, and placing buried waters. The high quality of the homology models likely contributes to the successful predictions from some of the MM-GB/SA calculations performed in this work.
Finally, even with good crystal structures, FEP+ can still fail to yield accurate results in some cases. For the cases chosen in this work we had validated FEP+ on the crystal structure before moving to the homology models. It can be safely assumed that if FEP+ performs poorly on a good crystal structure then a homology model would not do better (unless by chance or if there are problems with the crystal structure that are overcome in the homology model). Poor results with FEP+ on crystal structures can typically be attributed three sources: (1) force field, (2) sampling, and (3) system setup. For 1, we used a robust force field (OPLS3) with an automated mechanism to generate any missing parameters before running FEP+.77 Nonetheless, it is still possible that force field issues can lead to poor results, for example, if polarization or other effects not captured by the fixed point charge model cannot adequately describe the underlying physics of the molecules of interest. Regarding 2 (sampling), we have performed all calculations with 5 ns simulation time per lambda using enhanced REST sampling on the ligand atoms being changed. This protocol allows for sufficient local sampling within an energy basin and rearrangement of the ligand atoms being modified, but not larger scale movements of the system. To achieve such movements would require longer simulation times and/or adding more atoms into the REST region. As for 3 (setup), there are many issues that must be considered and were not detailed in this work. For example, it is essential to start with the correct tautomer/ionization state for the ligand and protein residues. This can be challenging, especially if there is a chance for changes upon binding, but can be addressed in most cases with careful consideration. Other important system setup issues include water placement (especially for buried waters), inclusion of ions and cofactors to emulate the relevant assay conditions, proper atom typing/mapping, and anything else that cannot be sampled during the MD simulations.
In summary, we have demonstrated that FEP+ has the potential to be successfully applied to homology models without significant degradation in the performance relative to calculations performed on crystal structures. This might be considered a surprising finding, as we often expect at least some degree of degradation when working with homology models, but the molecular dynamics sampling in FEP+ appears to adequately sample the relevant states of the protein around the ligands, which is not possible with scoring approaches that do not allow for protein flexibility. What we have presented here is encouraging for the field of relative binding free energy calculations applied to pharmaceutically relevant targets, but significantly more validation work is needed, which we are pursuing through additional retrospective validation and, importantly, through prospective applications in real-world drug discovery projects.
Acknowledgments
The authors gratefully acknowledge Sarah Boyce for her suggestions on composing the T4 lysozyme dataset. We also want to thank Lingle Wang for his comments and remarks on the manuscript and Thomas Steinbrecher for helpful discussions during setting up calculations and writing the manuscript.
ABBREVIATIONS
- A2A
adenosine A2A receptor
- ACK1
activated CDC42 kinase 1
- Bcl-xL
B-cell lymphoma-extra large
- β1-AR
β1 adrenergic receptor
- BRD2/3/4
bromodomain-containing protein 2, 3, or 4
- CSK
tyrosine-protein kinase CSK
- FEP
free energy perturbation
- JAK1
Janus kinase 1
- MCL-1
induced myeloid leukemia cell differentiation protein
- MUE
mean unsigned error
- OPLS
optimized potential for liquid simulations
- PI
predictive index
- REST
replica exchange with solute tempering
- RMSD
root mean square deviation
- RMSE
root mean square error
- RMSF
root mean square fluctuation
- SBDD
structure-based drug design
- TI
thermodynamic integration
- Tyk2
tyrosine kinase 2
Footnotes
ASSOCIATED CONTENT
Supporting Information
- Experimental and predicted binding free energies, FEP mutation graphs, and RMSF analysis plots of MD trajectories; in addition, a link to all input files for running the docking, FEP+, and MM-GBSA calculations (PDF)
The authors declare no competing financial interest.
References
- 1.Gohlke H, Klebe G. Approaches to the Description and Prediction of the Binding Affinity of Small-Molecule Ligands to Macromolecular Receptors. Angew. Chem., Int. Ed. 2002;41:2644–76. doi: 10.1002/1521-3773(20020802)41:15<2644::AID-ANIE2644>3.0.CO;2-O. [DOI] [PubMed] [Google Scholar]
- 2.Sotriffer C, Matter H. Virtual Screening. Wiley-VCH Verlag GmbH & Co. KGaA; 2011. The Challenge of Affinity Prediction: Scoring Functions for Structure-Based Virtual Screening; pp. 177–221. [Google Scholar]
- 3.Jorgensen WL. Free Energy Calculations: A Breakthrough for Modeling Organic Chemistry in Solution. Acc. Chem. Res. 1989;22:184–189. [Google Scholar]
- 4.Shirts MR, Mobley DL, Chodera JD, Spellmeyer DC, Wheeler R. Chapter 4 Alchemical Free Energy Calculations: Ready for Prime Time? Annu. Rep. Comput. Chem. 2007;3:41–59. [Google Scholar]
- 5.Michel J, Essex JW. Prediction of Protein-Ligand Binding Affinity by Free Energy Simulations: Assumptions, Pitfalls and Expectations. J. Comput-Aided Mol. Des. 2010;24:639–58. doi: 10.1007/s10822-010-9363-3. [DOI] [PubMed] [Google Scholar]
- 6.Chodera JD, Mobley DL, Shirts MR, Dixon RW, Branson K, Pande VS. Alchemical Free Energy Methods for Drug Discovery: Progress and Challenges. Curr. Opin. Struct. Biol. 2011;21:150–60. doi: 10.1016/j.sbi.2011.01.011. [DOI] [PMC free article] [PubMed] [Google Scholar]
- 7.Shirts MR, Mobley DL. An Introduction to Best Practices in Free Energy Calculations. In: Monticelli L, Salonen E, editors. Biomolecular Simulations: Methods and Protocols. Humana Press; Totowa, NJ: 2013. pp. 271–311. [DOI] [PubMed] [Google Scholar]
- 8.Klimovich PV, Shirts MR, Mobley DL. Guidelines for the Analysis of Free Energy Calculations. J. Comput-Aided Mol. Des. 2015;29:397–411. doi: 10.1007/s10822-015-9840-9. [DOI] [PMC free article] [PubMed] [Google Scholar]
- 9.Zwanzig RW. High-Temperature Equation of State by a Perturbation Method. I. Nonpolar Gases. J. Chem. Phys. 1954;22:1420. [Google Scholar]
- 10.Woods CJ, Essex JW, King MA. Enhanced Configurational Sampling in Binding Free-Energy Calculations. J. Phys. Chem. B. 2003;107:13711–13718. [Google Scholar]
- 11.Steinbrecher T, Mobley DL, Case DA. Nonlinear Scaling Schemes for Lennard-Jones Interactions in Free Energy Calculations. J. Chem. Phys. 2007;127:214108. doi: 10.1063/1.2799191. [DOI] [PubMed] [Google Scholar]
- 12.Steinbrecher T, Joung I, Case DA. Soft-Core Potentials in Thermodynamic Integration: Comparing One- and Two-Step Transformations. J. Comput. Chem. 2011;32:3253–63. doi: 10.1002/jcc.21909. [DOI] [PMC free article] [PubMed] [Google Scholar]
- 13.Kaus JW, Pierce LT, Walker RC, McCammon JA. Improving the Efficiency of Free Energy Calculations in the Amber Molecular Dynamics Package. J. Chem. Theory Comput. 2013;9:4131–4139. doi: 10.1021/ct400340s. [DOI] [PMC free article] [PubMed] [Google Scholar]
- 14.Essex JW, Severance DL, Tirado-Rives J, Jorgensen WL. Monte Carlo Simulations for Proteins: Binding Affinities for Trypsin–Benzamidine Complexes Via Free-Energy Perturbations. J. Phys. Chem. B. 1997;101:9663–9669. [Google Scholar]
- 15.Helms V, Wade RC. Computational Alchemy to Calculate Absolute Protein–Ligand Binding Free Energy. J. Am. Chem. Soc. 1998;120:2710–2713. [Google Scholar]
- 16.Jorgensen WL, Ruiz-Caro J, Tirado-Rives J, Basavapathruni A, Anderson KS, Hamilton AD. Computer-Aided Design of Non-Nucleoside Inhibitors of HIV-1 Reverse Transcriptase. Bioorg. Med. Chem. Lett. 2006;16:663–7. doi: 10.1016/j.bmcl.2005.10.038. [DOI] [PubMed] [Google Scholar]
- 17.Kim JT, Hamilton AD, Bailey CM, Domoal RA, Wang L, Anderson KS, Jorgensen WL. FEP-Guided Selection of Bicyclic Heterocycles in Lead Optimization for Non-Nucleoside Inhibitors of HIV-1 Reverse Transcriptase. J. Am. Chem. Soc. 2006;128:15372–3. doi: 10.1021/ja066472g. [DOI] [PubMed] [Google Scholar]
- 18.Boyce SE, Mobley DL, Rocklin GJ, Graves AP, Dill KA, Shoichet BK. Predicting Ligand Binding Affinity with Alchemical Free Energy Methods in a Polar Model Binding Site. J. Mol. Biol. 2009;394:747–63. doi: 10.1016/j.jmb.2009.09.049. [DOI] [PMC free article] [PubMed] [Google Scholar]
- 19.Jorgensen WL. Efficient Drug Lead Discovery and Optimization. Acc. Chem. Res. 2009;42:724–33. doi: 10.1021/ar800236t. [DOI] [PMC free article] [PubMed] [Google Scholar]
- 20.Steinbrecher T, Labahn A. Towards Accurate Free Energy Calculations in Ligand Protein-Binding Studies. Curr. Med. Chem. 2010;17:767–85. doi: 10.2174/092986710790514453. [DOI] [PubMed] [Google Scholar]
- 21.Christ CD, Fox T. Accuracy Assessment and Automation of Free Energy Calculations for Drug Design. J. Chem. Inf. Model. 2014;54:108–20. doi: 10.1021/ci4004199. [DOI] [PubMed] [Google Scholar]
- 22.Mikulskis P, Genheden S, Ryde U. A Large-Scale Test of Free-Energy Simulation Estimates of Protein–Ligand Binding Affinities. J. Chem. Inf. Model. 2014;54:2794–2806. doi: 10.1021/ci5004027. [DOI] [PubMed] [Google Scholar]
- 23.Dziedzic P, Cisneros JA, Robertson MJ, Hare AA, Danford NE, Baxter RH, Jorgensen WL. Design, Synthesis, and Protein Crystallography of Biaryltriazoles as Potent Tautomerase Inhibitors of Macrophage Migration Inhibitory Factor. J. Am. Chem. Soc. 2015;137:2996–3003. doi: 10.1021/ja512112j. [DOI] [PMC free article] [PubMed] [Google Scholar]
- 24.Wang L, Wu Y, Deng Y, Kim B, Pierce L, Krilov G, Lupyan D, Robinson S, Dahlgren MK, Greenwood J, Romero DL, Masse C, Knight JL, Steinbrecher T, Beuming T, Damm W, Harder E, Sherman W, Brewer M, Wester R, Murcko M, Frye L, Farid R, Lin T, Mobley DL, Jorgensen WL, Berne BJ, Friesner RA, Abel R. Accurate and Reliable Prediction of Relative Ligand Binding Potency in Prospective Drug Discovery by Way of a Modern Free-Energy Calculation Protocol and Force Field. J. Am. Chem. Soc. 2015;137:2695–703. doi: 10.1021/ja512751q. [DOI] [PubMed] [Google Scholar]
- 25.Shivakumar D, Harder E, Damm W, Friesner RA, Sherman W. Improving the Prediction of Absolute Solvation Free Energies Using the Next Generation Opls Force Field. J. Chem. Theory Comput. 2012;8:2553–8. doi: 10.1021/ct300203w. [DOI] [PubMed] [Google Scholar]
- 26.Harder E, Damm W, Maple J, Wu C, Reboul M, Xiang JY, Wang L, Lupyan D, Dahlgren MK, Knight JL, Kaus JW, Cerutti DS, Krilov G, Jorgensen WL, Abel R, Friesner RA. Opls3: A Force Field Providing Broad Coverage of Drug-Like Small Molecules and Proteins. J. Chem. Theory Comput. 2016;12:281–96. doi: 10.1021/acs.jctc.5b00864. [DOI] [PubMed] [Google Scholar]
- 27.Wang L, Friesner RA, Berne BJ. Replica Exchange with Solute Scaling: A More Efficient Version of Replica Exchange with Solute Tempering (REST2) J. Phys. Chem. B. 2011;115:9431–8. doi: 10.1021/jp204407d. [DOI] [PMC free article] [PubMed] [Google Scholar]
- 28.Wang L, Deng Y, Knight JL, Wu Y, Kim B, Sherman W, Shelley JC, Lin T, Abel R. Modeling Local Structural Rearrangements Using FEP/REST: Application to Relative Binding Affinity Predictions of Cdk2 Inhibitors. J. Chem. Theory Comput. 2013;9:1282–93. doi: 10.1021/ct300911a. [DOI] [PubMed] [Google Scholar]
- 29.Wang LLT, Abel R. Cycle Closure Estimation of Relative Binding Affinities and Errors. 20140278295. [03/15/2013];U.S. Patent Appl. 2013
- 30.Steinbrecher TB, Dahlgren M, Cappel D, Lin T, Wang L, Krilov G, Abel R, Friesner R, Sherman W. Accurate Binding Free Energy Predictions in Fragment Optimization. J. Chem. Inf. Model. 2015;55:2411–20. doi: 10.1021/acs.jcim.5b00538. [DOI] [PubMed] [Google Scholar]
- 31.Lenselink EB, Louvel J, Forti AF, van Veldhoven JPD, de Vries H, Mulder-Krieger T, McRobb FM, Negri A, Goose J, Abel R, van Vlijmen HWT, Wang L, Harder E, Sherman W, Ijzerman AP, Beuming T. Predicting Binding Affinities for GPCR Ligands Using Free-Energy Perturbation. ACS Omega. 2016;1:293–304. doi: 10.1021/acsomega.6b00086. [DOI] [PMC free article] [PubMed] [Google Scholar]
- 32.Aldeghi M, Heifetz A, Bodkin MJ, Knapp S, Biggin PC. Accurate Calculation of the Absolute Free Energy of Binding for Drug Molecules. Chem. Sci. 2016;7:207–218. doi: 10.1039/c5sc02678d. [DOI] [PMC free article] [PubMed] [Google Scholar]
- 33.Meng Y, Lin Y-l, Roux B. Computational Study of the “DFG-Flip” Conformational Transition in C-Abl and C-Src Tyrosine Kinases. J. Phys. Chem. B. 2015;119:1443–1456. doi: 10.1021/jp511792a. [DOI] [PMC free article] [PubMed] [Google Scholar]
- 34.Cavasotto CN. Virtual Screening. Wiley-VCH Verlag GmbH & Co. KGaA; Weinheim: 2011. Handling Protein Flexibility in Docking and High-Throughput Docking: From Algorithms to Applications. In; pp. 245–262. [Google Scholar]
- 35.Boukharta L, Gutiérrez-de-Terán H, Åqvist J. Computational Prediction of Alanine Scanning and Ligand Binding Energetics in G-Protein Coupled Receptors. PLoS Comput. Biol. 2014;10:e1003585. doi: 10.1371/journal.pcbi.1003585. [DOI] [PMC free article] [PubMed] [Google Scholar]
- 36.Genheden S. Are Homology Models Sufficiently Good for Free-Energy Simulations? J. Chem. Inf. Model. 2012;52:3013–3021. doi: 10.1021/ci300349s. [DOI] [PubMed] [Google Scholar]
- 37.Park H, Lee S. Homology Modeling, Force Field Design, and Free Energy Simulation Studies to Optimize the Activities of Histone Deacetylase Inhibitors. J. Comput-Aided Mol. Des. 2004;18:375–88. doi: 10.1007/s10822-004-2283-3. [DOI] [PubMed] [Google Scholar]
- 38.Berman HM, Westbrook J, Feng Z, Gilliland G, Bhat TN, Weissig H, Shindyalov IN, Bourne PE. The Protein Data Bank. Nucleic Acids Res. 2000;28:235–242. doi: 10.1093/nar/28.1.235. [DOI] [PMC free article] [PubMed] [Google Scholar]
- 39.Sastry GM, Adzhigirey M, Day T, Annabhimoju R, Sherman W. Protein and Ligand Preparation: Parameters, Protocols, and Influence on Virtual Screening Enrichments. J. Comput-Aided Mol. Des. 2013;27:221–34. doi: 10.1007/s10822-013-9644-8. [DOI] [PubMed] [Google Scholar]
- 40.Vidler LR, Filippakopoulos P, Fedorov O, Picaud S, Martin S, Tomsett M, Woodward H, Brown N, Knapp S, Hoelder S. Discovery of Novel Small-Molecule Inhibitors of BRD4 Using Structure-Based Virtual Screening. J. Med. Chem. 2013;56:8073–88. doi: 10.1021/jm4011302. [DOI] [PMC free article] [PubMed] [Google Scholar]
- 41.Filippakopoulos P, Qi J, Picaud S, Shen Y, Smith WB, Fedorov O, Morse EM, Keates T, Hickman TT, Felletar I, Philpott M, Munro S, McKeown MR, Wang Y, Christie AL, West N, Cameron MJ, Schwartz B, Heightman TD, La Thangue N, French CA, Wiest O, Kung AL, Knapp S, Bradner JE. Selective Inhibition of BET Bromodomains. Nature. 2010;468:1067–73. doi: 10.1038/nature09504. [DOI] [PMC free article] [PubMed] [Google Scholar]
- 42.Friberg A, Vigil D, Zhao B, Daniels RN, Burke JP, Garcia-Barrantes PM, Camper D, Chauder BA, Lee T, Olejniczak ET, Fesik SW. Discovery of Potent Myeloid Cell Leukemia 1 (Mcl-1) Inhibitors Using Fragment-Based Methods and Structure-Based Design. J. Med. Chem. 2013;56:15–30. doi: 10.1021/jm301448p. [DOI] [PMC free article] [PubMed] [Google Scholar]
- 43.Liang J, Tsui V, Van Abbema A, Bao L, Barrett K, Beresini M, Berezhkovskiy L, Blair WS, Chang C, Driscoll J, Eigenbrot C, Ghilardi N, Gibbons P, Halladay J, Johnson A, Kohli PB, Lai Y, Liimatta M, Mantik P, Menghrajani K, Murray J, Sambrone A, Xiao Y, Shia S, Shin Y, Smith J, Sohn S, Stanley M, Ultsch M, Zhang B, Wu LC, Magnuson S. Lead Identification of Novel and Selective Tyk2 Inhibitors. Eur. J. Med. Chem. 2013;67:175–87. doi: 10.1016/j.ejmech.2013.03.070. [DOI] [PubMed] [Google Scholar]
- 44.Liang J, van Abbema A, Balazs M, Barrett K, Berezhkovsky L, Blair W, Chang C, Delarosa D, DeVoss J, Driscoll J, Eigenbrot C, Ghilardi N, Gibbons P, Halladay J, Johnson A, Kohli PB, Lai Y, Liu Y, Lyssikatos J, Mantik P, Menghrajani K, Murray J, Peng I, Sambrone A, Shia S, Shin Y, Smith J, Sohn S, Tsui V, Ultsch M, Wu LC, Xiao Y, Yang W, Young J, Zhang B, Zhu BY, Magnuson S. Lead Optimization of a 4-Aminopyridine Benzamide Scaffold to Identify Potent, Selective, and Orally Bioavailable Tyk2 Inhibitors. J. Med. Chem. 2013;56:4521–36. doi: 10.1021/jm400266t. [DOI] [PubMed] [Google Scholar]
- 45.Minetti P, Tinti MO, Carminati P, Castorina M, Di Cesare MA, Di Serio S, Gallo G, Ghirardi O, Giorgi F, Giorgi L, Piersanti G, Bartoccini F, Tarzia G. 2-N-Butyl-9-Methyl-8-[1,2,3]Triazol-2-Yl-9h-Purin-6-Ylamine and Analogues as A2a Adenosine Receptor Antagonists. Design, Synthesis, and Pharmacological Characterization. J. Med. Chem. 2005;48:6887–96. doi: 10.1021/jm058018d. [DOI] [PubMed] [Google Scholar]
- 46.Mobley DL, Graves AP, Chodera JD, McReynolds AC, Shoichet BK, Dill KA. Predicting Absolute Ligand Binding Free Energies to a Simple Model Site. J. Mol. Biol. 2007;371:1118–34. doi: 10.1016/j.jmb.2007.06.002. [DOI] [PMC free article] [PubMed] [Google Scholar]
- 47.Schrödinger Release 2015-2: Ligprep, 3.4. Schrödinger LLC; New York, NY: 2015. [Google Scholar]
- 48.Shelley JC, Cholleti A, Frye LL, Greenwood JR, Timlin MR, Uchimaya M. Epik: A Software Program for Pk(a) Prediction and Protonation State Generation for Drug-Like Molecules. J. Comput-Aided Mol. Des. 2007;21:681–91. doi: 10.1007/s10822-007-9133-z. [DOI] [PubMed] [Google Scholar]
- 49.Greenwood JR, Calkins D, Sullivan AP, Shelley JC. Towards the Comprehensive, Rapid, and Accurate Prediction of the Favorable Tautomeric States of Drug-Like Molecules in Aqueous Solution. J. Comput-Aided Mol. Des. 2010;24:591–604. doi: 10.1007/s10822-010-9349-1. [DOI] [PubMed] [Google Scholar]
- 50.Schrödinger Release 2015-2: Epik. Schrödinger LLC; New York, NY: 2015. 3.2. [Google Scholar]
- 51.Jacobson MP, Friesner RA, Xiang Z, Honig B. On the Role of the Crystal Environment in Determining Protein Side-Chain Conformations. J. Mol. Biol. 2002;320:597–608. doi: 10.1016/s0022-2836(02)00470-9. [DOI] [PubMed] [Google Scholar]
- 52.Jacobson MP, Pincus DL, Rapp CS, Day TJ, Honig B, Shaw DE, Friesner RA. A Hierarchical Approach to All-Atom Protein Loop Prediction. Proteins: Struct., Genet. 2004;55:351–67. doi: 10.1002/prot.10613. [DOI] [PubMed] [Google Scholar]
- 53.Schrödinger Release 2015-2: Prime, 4.0. Schrödinger LLC; New York, NY: 2015. [Google Scholar]
- 54.Munk C, Isberg V, Mordalski S, Harpsøe K, Rataj K, Hauser AS, Kolb P, Bojarski AJ, Vriend G, Gloriam DE. GPCRdb: the G protein-coupled receptor database – an introduction. Br. J. Pharmacol. 2016;173:2195–2207. doi: 10.1111/bph.13509. [DOI] [PMC free article] [PubMed] [Google Scholar]
- 55.Isberg V, Mordalski S, Munk C, Rataj K, Harpsøe K, Hauser AS, Vroling B, Bojarski AJ, Vriend G, Gloriam DE. GPCRdb: an information system for G protein-coupled receptors. Nucleic Acids Res. 2016;44:D356–D364. doi: 10.1093/nar/gkv1178. [DOI] [PMC free article] [PubMed] [Google Scholar]
- 56.Halgren TA, Murphy RB, Friesner RA, Beard HS, Frye LL, Pollard WT, Banks JL. Glide: A New Approach for Rapid, Accurate Docking and Scoring. 2. Enrichment Factors in Database Screening. J. Med. Chem. 2004;47:1750–9. doi: 10.1021/jm030644s. [DOI] [PubMed] [Google Scholar]
- 57.Friesner RA, Banks JL, Murphy RB, Halgren TA, Klicic JJ, Mainz DT, Repasky MP, Knoll EH, Shelley M, Perry JK, Shaw DE, Francis P, Shenkin PS. Glide: A New Approach for Rapid, Accurate Docking and Scoring. 1. Method and Assessment of Docking Accuracy. J. Med. Chem. 2004;47:1739–49. doi: 10.1021/jm0306430. [DOI] [PubMed] [Google Scholar]
- 58.Small-Molecule Drug Discovery Suite 2015-2: Glide, 6.7. Schrödinger LLC; New York, NY: 2015. [Google Scholar]
- 59.Beuming T, Sherman W. Current Assessment of Docking into GPCR Crystal Structures and Homology Models: Successes, Challenges, and Guidelines. J. Chem. Inf. Model. 2012;52:3263–77. doi: 10.1021/ci300411b. [DOI] [PubMed] [Google Scholar]
- 60.Sherman W, Day T, Jacobson MP, Friesner RA, Farid R. Novel Procedure for Modeling Ligand/Receptor Induced Fit Effects. J. Med. Chem. 2006;49:534–53. doi: 10.1021/jm050540c. [DOI] [PubMed] [Google Scholar]
- 61.Clark AJ, Tiwary P, Borrelli K, Feng S, Miller EB, Abel R, Friesner RA, Berne BJ. Prediction of Protein–Ligand Binding Poses Via a Combination of Induced Fit Docking and Metadynamics Simulations. J. Chem. Theory Comput. 2016;12:2990–2998. doi: 10.1021/acs.jctc.6b00201. [DOI] [PubMed] [Google Scholar]
- 62.Liu P, Kim B, Friesner RA, Berne BJ. Replica Exchange with Solute Tempering: A Method for Sampling Biological Systems in Explicit Water. Proc. Natl. Acad. Sci. U. S. A. 2005;102:13749–54. doi: 10.1073/pnas.0506346102. [DOI] [PMC free article] [PubMed] [Google Scholar]
- 63.Lomize MA, Lomize AL, Pogozheva ID, Mosberg HI. Opm: Orientations of Proteins in Membranes Database. Bioinformatics. 2006;22:623–5. doi: 10.1093/bioinformatics/btk023. [DOI] [PubMed] [Google Scholar]
- 64.Li J, Abel R, Zhu K, Cao Y, Zhao S, Friesner RA. The Vsgb 2.0 Model: A Next Generation Energy Model for High Resolution Protein Structure Modeling. Proteins: Struct., Funct. Genet. 2011;79:2794–812. doi: 10.1002/prot.23106. [DOI] [PMC free article] [PubMed] [Google Scholar]
- 65.Borrelli KW, Cossins B, Guallar V. Exploring Hierarchical Refinement Techniques for Induced Fit Docking with Protein and Ligand Flexibility. J. Comput. Chem. 2010;31:1224–35. doi: 10.1002/jcc.21409. [DOI] [PubMed] [Google Scholar]
- 66.Wei BQ, Baase WA, Weaver LH, Matthews BW, Shoichet BK. A Model Binding Site for Testing Scoring Functions in Molecular Docking. J. Mol. Biol. 2002;322:339–55. doi: 10.1016/s0022-2836(02)00777-5. [DOI] [PubMed] [Google Scholar]
- 67.Ferrari AM, Wei BQ, Costantino L, Shoichet BK. Soft Docking and Multiple Receptor Conformations in Virtual Screening. J. Med. Chem. 2004;47:5076–84. doi: 10.1021/jm049756p. [DOI] [PMC free article] [PubMed] [Google Scholar]
- 68.Wei BQ, Weaver LH, Ferrari AM, Matthews BW, Shoichet BK. Testing a Flexible-Receptor Docking Algorithm in a Model Binding Site. J. Mol. Biol. 2004;337:1161–82. doi: 10.1016/j.jmb.2004.02.015. [DOI] [PubMed] [Google Scholar]
- 69.Graves AP, Brenk R, Shoichet BK. Decoys for Docking. J. Med. Chem. 2005;48:3714–28. doi: 10.1021/jm0491187. [DOI] [PMC free article] [PubMed] [Google Scholar]
- 70.Pearlman DA, Charifson PS. Are Free Energy Calculations Useful in Practice? A Comparison with Rapid Scoring Functions for the P38 Map Kinase Protein System. J. Med. Chem. 2001;44:3417–23. doi: 10.1021/jm0100279. [DOI] [PubMed] [Google Scholar]
- 71.Brown SP, Muchmore SW, Hajduk PJ. Healthy Skepticism: Assessing Realistic Model Performance. Drug Discovery Today. 2009;14:420–7. doi: 10.1016/j.drudis.2009.01.012. [DOI] [PubMed] [Google Scholar]
- 72.Nicholls A. Confidence Limits, Error Bars and Method Comparison in Molecular Modeling. Part 1: The Calculation of Confidence Intervals. J. Comput-Aided Mol. Des. 2014;28:887–918. doi: 10.1007/s10822-014-9753-z. [DOI] [PMC free article] [PubMed] [Google Scholar]
- 73.Michino M, Abola E, Brooks CL, 3rd, Dixon JS, Moult J, Stevens RC. Community-Wide Assessment of GPCR Structure Modelling and Ligand Docking: GPCR Dock 2008. Nat. Rev. Drug Discovery. 2009;8:455–63. doi: 10.1038/nrd2877. [DOI] [PMC free article] [PubMed] [Google Scholar]
- 74.Huang N, Kalyanaraman C, Irwin JJ, Jacobson MP. Physics-Based Scoring of Protein-Ligand Complexes: Enrichment of Known Inhibitors in Large-Scale Virtual Screening. J. Chem. Inf. Model. 2006;46:243–53. doi: 10.1021/ci0502855. [DOI] [PubMed] [Google Scholar]
- 75.Guimaraes CR, Cardozo M. MM-GB/SA Rescoring of Docking Poses in Structure-Based Lead Optimization. J. Chem. Inf. Model. 2008;48:958–70. doi: 10.1021/ci800004w. [DOI] [PubMed] [Google Scholar]
- 76.Higgs C, Beuming T, Sherman W. Hydration Site Thermodynamics Explain Sars for Triazolylpurines Analogues Binding to the A2a Receptor. ACS Med. Chem. Lett. 2010;1:160–4. doi: 10.1021/ml100008s. [DOI] [PMC free article] [PubMed] [Google Scholar]
- 77.Wang L, Wu Y, Deng Y, Kim B, Pierce L, Krilov G, Lupyan D, Robinson S, Dahlgren MK, Greenwood J, Romero DL, Masse C, Knight JL, Steinbrecher T, Beuming T, Damm W, Harder E, Sherman W, Brewer M, Wester R, Murcko M, Frye L, Farid R, Lin T, Mobley DL, Jorgensen WL, Berne BJ, Friesner RA, Abel R. Accurate and Reliable Prediction of Relative Ligand Binding Potency in Prospective Drug Discovery by Way of a Modern Free-Energy Calculation Protocol and Force Field. J. Am. Chem. Soc. 2015;137:2695–2703. doi: 10.1021/ja512751q. [DOI] [PubMed] [Google Scholar]