

Summary
Preservation of a balance between synaptic excitation and inhibition is critical for normal brain function. A number of homeostatic cellular mechanisms have been suggested to play a role in maintaining this balance, including long-term plasticity of GABAergic inhibitory synapses. Many previous studies have demonstrated a coupling of postsynaptic spiking with modification of perisomatic inhibition. Here, we demonstrate that activation of NMDA-type glutamate receptors leads to input-specific long-term potentiation of dendritic inhibition mediated by somatostatin-expressing interneurons. This form of plasticity is expressed postsynaptically and requires both CaMKIIα and the β2-subunit of the GABA-A receptor. Importantly, this process may function to preserve dendritic inhibition, as genetic deletion of NMDAR signaling results in a selective weakening of dendritic inhibition. Overall, our results reveal a new mechanism for linking excitatory and inhibitory input in neuronal dendrites and provide novel insight into the homeostatic regulation of synaptic transmission in cortical circuits.
In Brief Blurb
Using electrophysiology and optogenetics, Chiu et al. show that activation of NMDA-type glutamate receptors selectively potentiates inhibition from somatostatin-expressing interneurons onto cortical pyramidal cells. This work suggests a mechanism for regulating the balance of excitation and inhibition in neuronal dendrites.
Introduction
The balance of synaptic excitation and inhibition is central to normal brain function and is disrupted in a variety of neurodevelopmental disorders (Gogolla et al., 2009; Isaacson and Scanziani, 2011; Lewis and Hashimoto, 2007). In the neocortex, this balance is hypothesized to be maintained via an array of mechanisms that regulate synaptic strength and excitability (Kullmann et al., 2012; Malenka and Bear, 2004; Turrigiano, 2011). Mechanistic studies of synaptic plasticity have largely focused on potentiation and depression of excitatory glutamatergic connections. More recently, plasticity of inhibitory GABAergic synapses has also begun to receive attention, although the underlying cellular targets and molecular mechanisms are less well understood (Castillo et al., 2011; Kullmann et al., 2012).
A major challenge to understanding the contribution of inhibitory plasticity to brain development and function is the diversity of cortical GABAergic interneurons (INs)(Ascoli et al., 2008). Recent work suggests three principal groups: cells co-expressing either the calcium (Ca2+) binding protein parvalbumin (PV), the peptide transmitter somatostatin (SOM), or the serotonin 5HT3a receptor (Rudy et al., 2011). The latter class includes the vasoactive intestinal peptide (VIP)-expressing cells. PV-INs make inhibitory contacts onto the perisomatic and proximal dendritic regions of excitatory pyramidal neurons (PNs) and exert well-documented control over the magnitude and timing of PN spike output (Cardin et al., 2009; Pouille and Scanziani, 2001). SOM-INs contact dendritic arbors where they regulate Ca2+ signaling, synaptic integration, and dendritic spikes (Chiu et al., 2013; Murayama et al., 2009). VIP-INs largely, though not exclusively, target other INs and may drive state-dependent disinhibition of PNs (Fu et al., 2014; Pfeffer et al., 2013).
Recent evidence using 2-photon imaging of fluorescently tagged inhibitory synapses in vivo suggests distinct learning rules for different populations of GABAergic inputs (Chen et al., 2012; Villa et al., 2016). In particular, inhibitory synapses onto dendritic spines, potentially formed by SOM-INs (Chiu et al., 2013), appear to be particularly plastic, as their basal turnover and response to sensory deprivation is significantly more dynamic than those onto dendritic shafts (Chen et al., 2012; van Versendaal et al., 2012). These findings suggest the intriguing possibility of GABAergic circuit-specific plasticity.
Notably, most studies of GABAergic plasticity have implicated perisomatic inhibition as a key locus for regulation. For example, synapses formed by PV-INs in primary visual cortex selectively exhibit long-term potentiation (iLTP) in response to activity-dependent release of nitric oxide by postsynaptic PNs (Lourenco et al., 2014), and inputs from fast-spiking, putative PV-INs, onto layer 4 PNs are selectively modified by visual experience (Maffei et al., 2006). Similarly, cholecystokinin (CCK)-expressing basket cells targeting proximal somatodendritic regions in the hippocampus are particularly sensitive to retrograde endocannabinoid signaling (Lee et al., 2010). Finally, Purkinje cell-targeting basket cells in the cerebellum exhibit iLTP in response to postsynaptic Ca2+ signaling (He et al., 2015). It is less clear whether GABAergic inputs to neuronal dendrites are regulated by similar mechanisms. Because excitatory and inhibitory synapses are in close proximity within dendritic compartments, glutamatergic activity may intimately shape dendritic inhibition. Indeed, previous studies in cultured hippocampal neurons, where circuit architecture is not preserved, suggested links between Ca2+ influx through NMDA-type glutamate receptors (NMDARs) and GABAergic synaptic function (Marsden et al., 2007; Petrini et al., 2014).
To determine whether glutamatergic signaling can directly influence inhibitory synaptic potency in intact cortical circuits, we utilized optogenetic stimulation of targeted GABAergic IN populations paired with either pharmacological or optogenetic activation of postsynaptic NMDARs. Our results show the remarkable finding that Ca2+ influx through NMDARs selectively drives iLTP of SOM-IN synapses, while inputs from PV-INs and VIP-INs are unaffected. Indeed, activation of the Type 2α Ca2+ and calmodulin-dependent kinase (CaMKIIα) selectively induces potentiation of SOM-IN but not PV-IN synapses. This form of plasticity is expressed postsynaptically and requires the β2 subunit of the GABAA receptor, which we show functions preferentially at SOM-IN synapses. Finally, we show that genetic disruption of NMDAR activity leads to distinct consequences for perisomatic and dendritic inhibition. These results suggest functional heterogeneity of GABAergic synapses in different somatodendritic compartments which may have direct consequences for activity-dependent, homeostatic balancing of excitatory and inhibitory circuits.
Results
To examine the impact of glutamatergic signaling on specific subsets of GABAergic synapses, we used a viral vector to conditionally express EYFP-fused channelrhodopsin-2 (ChR2) in three populations of GABAergic interneurons (SOM-, PV-, or VIP-INs) within the mouse medial prefrontal cortex (Figure 1A–C, left). We selectively activated ChR2-expressing cells in acute slices with brief pulses of 473-nm light while monitoring the corresponding inhibitory postsynaptic currents (IPSCs) in nearby L2/3 PNs (Figure 1A–C, middle). In these experiments, PNs were loaded with chloride through the patch pipette to obtain detectable inward IPSCs at a holding potential of −70 mV. After obtaining a stable baseline, 20 μM NMDA was bath applied for 2 minutes and rapidly washed out (Figure 1A–C, right). In all experiments, inhibitory currents disappeared during NMDA wash-in and reappeared in the first 2 minutes after NMDA cessation, presumably due to NMDA-induced depolarization block of presynaptic neurons. Experiments using SOM-INs revealed that chemical activation of NMDARs produced a significant potentiation of optically evoked IPSCs (SOM-IPSCs), reaching a plateau ~20 min after NMDA washout (171 ± 18%, n = 8 cells, p=0.02; Figure 1A, E). This rise was not correlated with changes in series or membrane resistance (Figure 1D). Surprisingly, inhibitory responses mediated by either PV- (PV-IPSCs) or VIP-interneurons (VIP-IPSCs) did not exhibit potentiation following NMDAR activation, only recovering back to baseline (PV: 105 ± 5%, n = 7 cells, p=0.78; VIP: 91 ± 8%, n = 8 cells, p=0.20). Thus, our results demonstrate that glutamatergic signaling can drive iLTP in the neocortex, but this phenomenon is specific to a subpopulation of GABAergic synapses.
Figure 1. NMDA selectively potentiates GABAergic inhibition mediated by SOM-INs.

(A–C, left) Epifluorescence images of ChR2-EYFP (green) expression and DAPI (blue) in the prefrontal cortex of the three different IN-Cre driver lines. (A–C, middle) Schematic of the recording and stimulation conditions. (A–C, right) Time-course of inhibitory postsynaptic currents in L2/3 pyramidal cells evoked by photo-activation of the specific interneuron types before and after brief application of 20μM NMDA. Average IPSC traces obtained before (black) and after (red) NMDA exposure from a single experiment at time points indicated are shown in the insets. (D) Series (top) and membrane resistance (bottom) are unchanged after brief NMDA exposure for all three groups. (E) Summary plot of the involvement of different Ca2+ sources and receptors on iLTP of SOM-IN inputs. Data are represented as mean ± SEM. Asterisks denote p-value of <0.05, Mann-Whitney Test.
Bath-application of NMDA may increase neuronal activity in the slice, leading to release of unspecified transmitters that might mediate iLTP. Therefore, we determined the requirement for postsynaptic NMDAR signaling in the recorded PN by loading cells with the NMDAR blocker MK-801 through the patch pipette. This manipulation abolished iLTP of SOM-IPSCs (109 ± 8%, n = 7 cells, p=0.005 compared to control; Figure 1E). In particular, NMDARs containing GluN2B-subunits are required for iLTP, as bath-application of the specific antagonist ifenprodil also blocked plasticity (74 ± 11%, n = 5 cells, p=0.02 compared to control; Figure 1E). Moreover, chelating postsynaptic Ca2+ by including BAPTA in the patch pipette also blocked iLTP (83 ± 10%, n = 4 cells, p=0.001 compared to control; Figure 1E). These results strongly indicate that iLTP is induced cell-autonomously by the activation of postsynaptic NMDARs and subsequent Ca2+ influx.
Additional pharmacological assays revealed that blockade of either GABAB receptors (CGP-55845: 177 ± 33%, n = 3 cells, p=0.84) or L-type voltage-gated Ca2+ channels, (nimodipine: 171 ± 23%, n = 4 cells, p=0.60) did not reduce the magnitude of iLTP compared to controls. In addition, we confirmed that iLTP is also observed when monitoring outward currents at +10 mV in cells containing a physiological chloride concentration (low chloride: 165 ± 14%, n = 6 cells, p=0.89 compared to high chloride control), arguing that plasticity is not due to a change in the GABAA reversal potential and is not an artifact of chloride-loading (Figure 1E). Notably, we cannot rule out a direct contribution of GABAAR-mediated signaling to the induction of iLTP, though the lack of detectable IPSCs during NMDA exposure suggests small, if any, GABA release during the induction period.
NMDAR-dependent plasticity is often linked to Ca2+-dependent activation of CaMKIIα. Therefore, we tested the role of this kinase in iLTP. Both extracellular blockade with the antagonist KN-62 and intracellular blockade by cell-loading with autocamtide-2-related inhibitory peptide (AIP) abolished iLTP of SOM-IPSCs (control: 156 ± 16%, n = 8 cells; KN-62: 91 ± 5%, n = 7 cells, p=0.0003; AIP: 100 ± 5%, n = 8 cells, p=0.0002; Figure 2A, B).
Figure 2. CaMKIIα activity mediates iLTP of dendritic GABAergic inhibition.

(A) Time-course of inhibitory postsynaptic currents evoked by photo-activation of SOM-INs before and after NMDA application using control internal solution or patch solution loaded with AIP. Average IPSC traces obtained before (black) and after (red) NMDA exposure from a single experiment at time points indicated are shown in the insets. (B) Summary plot of the effect of blocking CaMKIIα on iLTP with bath applied KN-62 or cell loaded AIP. (C) Time-course of inhibitory postsynaptic currents evoked by photo-activation of SOM or PV-INs immediately after whole-cell break-in using an internal patch solution that contains calcium and calmodulin. To isolate the effect of CaMKIIα, the calcium-sensitive phosphatase, calcineurin, was blocked with bath application of cyclosporin A (CyA) throughout the experiment. Average IPSC traces obtained in the first minute (black) and after twenty minutes (red) of whole cell patch recording from a single experiment are shown in the insets. (D) Summary plot of the effect of loading calcium and calmodulin on the amplitude of inhibitory responses elicited by optogenetic activation of SOM- and PV-INs. The IPSC increase observed for SOM-IN inputs is abolished by KN-62. Data are represented as mean ± SEM. Asterisks denote p-value of <0.05, Mann-Whitney Test.
The lack of CaMKIIα-dependent iLTP at PV-IN synapses might reflect either absence of kinase at these perisomatic inputs or insensitivity to its actions. To distinguish between these possibilities, we examined whether direct activation of CaMKIIα is sufficient to potentiate IPSCs. In initial experiments, cells were loaded with Ca2+ and calmodulin through the patch pipette in the presence of the calcineurin antagonist cyclosporine A (Wang and Kelly, 1995). We began by recording IPSCs evoked by optical stimulation of SOM-INs immediately after breaking into the cell and observed a steady augmentation of response amplitude (213 ± 16%, n = 10, p=0.002), which was not observed in cells loaded with control pipette solution (122 ± 10%, n = 7, p=0.22; Figure 2C, D). KN-62 abolished the effect of loading Ca2+/calmodulin (103 ± 11%, n = 6, p=0.0005; Figure 2D), suggesting that direct activation of CaMKIIα is sufficient to potentiate inputs from SOM-INs. In striking contrast, loading the cell with Ca2+ and calmodulin had no effect on IPSCs evoked by stimulating PV-INs (Ca2+calmodulin: 120 ± 9%, n = 8, p=0.20; control: 112 ± 15%, n = 8, p=0.31, Fig. 2C, D). We confirmed the specificity of these findings by repeating similar experiments, but this time loading the PN with a constitutively active CaMKIIα (10 nM CaMKII*)(Tavalin and Colbran, 2017). Again, the amplitude of IPSCs mediated by SOM-INs but not PV-INs increased 20 min after whole-cell break-in (SOM: 146 ± 10%, n = 5 cells, p=0.02; PV: 108 ± 12%, n = 5 cells, p=0.58; Supplemental Figure 1). As active CaMKIIα loaded from the pipette fails to potentiate synapses formed by PV-INs, where its concentration is likely highest, but does strengthen inputs from more distal SOM-INs, our results support the hypothesis that the inherent sensitivity to CaMKIIα signaling differs across these distinct GABAergic synaptic populations.
Our results suggest that iLTP induction requires postsynaptic NMDARs, Ca2+ influx, and CaMKIIα activation. However, the site of expression remains unclear. Therefore, we first estimated the number and conductance of GABAA receptors activated by optical stimulation of SOM-INs using non-stationary fluctuation analysis (Clements, 2003) before and after NMDA application (Figure 3A). This approach indicated that NMDAR activation produces an increase in GABAA receptor number (before: 182 ± 49; after: 370 ± 87, n = 8, p=0.01) but not conductance (before: 41 ± 9 pS; after: 34 ± 6 pS, n = 8, p=0.32), suggesting that iLTP involves the addition of GABAA receptors in the postsynaptic membrane. To test this hypothesis, we pharmacologically blocked SNARE-dependent insertion of receptors by including botulinum toxin type A (BoNT-A) in the patch pipette and found that this manipulation completely abolished iLTP (Figure 3B). Indeed, IPSCs were slightly reduced following NMDA application in cells loaded with BoNT-A (86 ± 4%, n = 8, p=0.01) while cells loaded with heat-inactivated BoNT-A (HI-BoNT) still exhibited iLTP (126 ± 3%, n = 7, p=0.02). These results are consistent with iLTP being mediated by insertion of receptors either at existing or newly formed connections, possibly reflecting the return of recurrent inhibitory synapses (Villa et al., 2016).
Figure 3. Dendritic iLTP is expressed postsynaptically.

(A) Non-stationary fluctuation analysis of inhibitory responses evoked by photo-stimulation of SOM-INs in a representative experiment. Top, Example peak-scaled IPSC traces (gray) and average IPSC (black) during the baseline period. Bottom, Plot of the variance against the mean IPSC amplitude before (black) and after (red) NMDA application. Right, Summary plot of the estimated channel number (top) and conductance (bottom) before and after NMDA application. Asterisks denote p-value of <0.05, Paired T-test. (B) Time-course of inhibitory responses evoked by photostimulation of SOM-INs showing that botulinum type A (BoNT-A) abolishes iLTP (gray circles) while the heat-inactivated BoNT-A (black circles) does not. Right, Average IPSC traces obtained before (black) and after (red) NMDA exposure from single experiments are shown. (C) Time-course of IPSCs evoked by photolysis of RuBi-GABA at dendritic regions of L2/3 pyramidal cells. Under control conditions, IPSCs elicited by direct stimulation of postsynaptic receptors potentiate following NMDA application (black circles), and iLTP is blocked by KN-62 (gray circles). Right, Average IPSC traces obtained before (black) and after (red) NMDA exposure from single experiments are shown. Data are represented as mean ± SEM.
Finally, to further test the hypothesis that iLTP is expressed postsynaptically, we bypassed GABA release from presynaptic interneurons entirely and directly activated postsynaptic GABAA receptors with photolysis of caged GABA targeting distal PN dendrites (Figure 3C). Consistent with postsynaptic iLTP expression, IPSCs evoked by GABA uncaging also increased following 2 minutes of NMDA exposure (161 ± 29%, n = 10, p=0.0009), and this result was blocked by bath-application of KN-62 (99 ± 3%, n = 5, p=0.03 compared to control). In combination, these results strongly indicate that iLTP is both induced and expressed postsynaptically and is restricted to subsets of GABAergic synapses.
We next tested whether glutamatergic synaptic activity can also trigger NMDAR-dependent iLTP by taking advantage of a dual wavelength optogenetic approach (Figure 4A). Red-shifted tdTomato-tagged ChrimsonR was conditionally expressed in prefrontal SOM-INs, enabling these interneurons to be activated by 594 nm light (Klapoetke et al., 2014). We also expressed YFP-tagged ChR2 in the medial dorsal thalamus (MD), the primary source of thalamocortical afferents to the PFC. In initial experiments, we found that 594 nm stimulation reliably evoked IPSCs when the cell was voltage clamped at +10 mV, while no excitatory postsynaptic currents (EPSCs) were observed at a holding potential of −60 mV, demonstrating lack of ChR2 activation by the red light. In contrast, 473 nm stimulation reliably evoked EPSCs, but also IPSCs that were largely disynaptic in origin (Supplemental Figure 2).
Figure 4. Excitatory synaptic stimulation induces iLTP of SOM-INs.
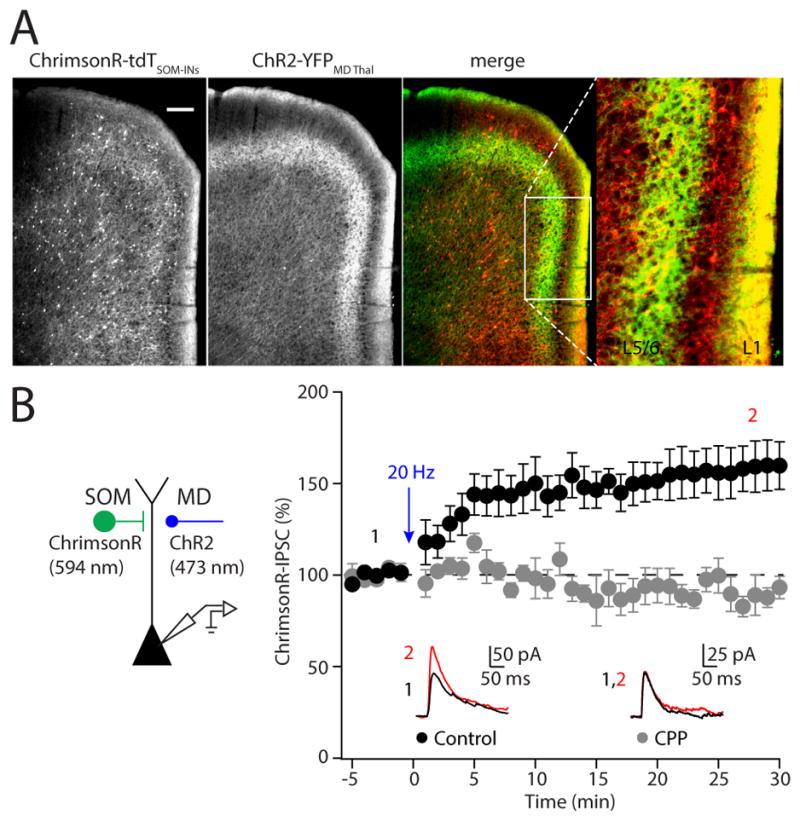
(A) Viral vectors were used to express the red-shifted opsin ChrimsonR-tdTomato in SOM-INs and ChR2-YFP in MD thalamic afferents, which each target layer 1 in the PFC. (B, left) Schematic of the experimental paradigm. (B, right) Time-course of evoked responses. Blue light (473 nm) 20 Hz stimulation of thalamocortical fibers triggers potentiation of IPSCs evoked by red light (594 nm) stimulation of SOM-INs. Average IPSC traces are shown for representative experiments before (black) and after (red) thalamocortical stimulation in the inset. Note that iLTP is blocked in the presence of the NMDAR antagonist CPP. Data are represented as mean ± SEM.
Recent work demonstrated coherent ~20 Hz activity between MD and the PFC during a working memory task (Bolkan et al., 2017). Based on this model, we found that a brief 2-minute train of thalamic stimulation at 20 Hz triggered iLTP of SOM-IPSCs comparable to that seen with bath application of NMDA (158 ± 13%, n=7, p=0.002, Figure 4). We confirmed that iLTP triggered by thalamocortical input also requires NMDARs, as it was abolished by bath-application of the NMDAR-antagonist CPP (90 ± 7%, n =6, p=0.005 compared to control; Figure 4). Thus, synaptic activation of NMDARs is sufficient to induce potentiation of SOM-IN-mediated IPSCs.
Our results suggest that the molecular constituency of synapses formed by SOM-INs may differ from those formed by other interneurons, resulting in differential sensitivity to plasticity induction. Indeed, previous studies have linked both β2 and β3 subunits of the GABAA receptor to iLTP induction in the cerebellum and hippocampal cultures, respectively (He et al., 2015; Petrini et al., 2014). Therefore, we first asked whether functional expression of these subunits might distinguish synapses formed by SOM- versus PV-INs (Figure 5A). Bath application of etomidate, a β2/β3-selective positive allosteric modulator, slightly reduced the amplitude of IPSCs arising from both SOM- and PV-INs (SOM: −26 ± 6%, n = 7, p=0.02; PV: −17 ± 4%, n = 7, p=0.02). However, etomidate substantially slowed the decay of IPSCs evoked by optical stimulation of SOM-INs (baseline: 59 ± 9 ms; etomidate: 308 ± 102 ms, n = 7, p=0.02) but had no impact on the decay of PV-IN-evoked currents (baseline: 27 ± 1 ms; etomidate: 35 ± 4 ms, n = 7, p=0.16). The higher sensitivity of synapses formed by SOM-INs versus PV-INs to etomidate suggests that β2/β3 expression is functionally enriched at the former versus the latter.
Figure 5. GABAA receptor β2 subunits are enriched at synapses formed by SOM-INs and are required for iLTP.

(A, top) Average IPSC traces obtained from optogenetic stimulation of SOM-INs (left) at baseline (black) and in etomidate (red) for a representative experiment. Summary plots of the effect of etomidate on average IPSC amplitude and decay kinetics are shown. (A, bottom) Similar experiments are shown for optogenetic stimulation of PV-INs. Asterisks denote p-value of <0.05, paired T-test. (B, left) Schematic of the experimental paradigm. Pyramidal cells expressing GFP-Cre are targeted for patching, and inhibitory responses are elicited by uncaging GABA in the dendritic regions. (B, right) Time-course of the effect of NMDA application on uncaging responses in cells obtained from wild-type (black) or β2-deleted (gray) cells. Average IPSC traces obtained before (black) and after (red) NMDA exposure from a single experiment are shown in the insets. Data are represented as mean ± SEM.
We then tested whether β2- or β3-containing GABAA receptors are required for iLTP by using mice expressing floxed conditional alleles of either the β2 (Supplemental Figure 3A, B) or β3 (Ferguson et al., 2007) subunit of the GABAA receptor. We virally introduced GFP-tagged Cre recombinase (AAV-CaMKII α-GFP-Cre, Figure 5B) into the prefrontal cortex of conditional mice and prepared acute slices 6–7 weeks post-injection (Supplemental Figure 3C). Notably, genetic deletion of the β2 subunit eliminated iLTP of uncaging-evoked IPSCs following NMDA application (Cre+; β2f/f: 115 ± 7%, n=8, p=0.08, Figure 5B). In contrast, neither expression of GFP-Cre by itself (Cre+; β2+/+: 161 ± 13%, n=6, p=0.03, Figure 5B) nor deletion of the β3 subunit blocked potentiation of uncaging-evoked IPSCs (Cre+; β3f/f: 161 ± 21%, n=7, p=0.02, Supplemental Figure 3D).
The preceding results indicate that activation of NMDARs can acutely potentiate the strength of inhibition mediated by selective subsets of GABAergic interneurons. We next asked whether glutamatergic signaling also plays a role in regulating inhibitory potency in vivo. To address this possibility, we utilized a genetic strategy for sparsely eliminating NMDAR signaling in prefrontal neurons in the intact mouse. We used the same viral vector to express GFP-tagged Cre recombinase in mice harboring a floxed allele of the obligatory NR1 subunit of the NMDAR (Tsien et al., 1996). In slices prepared 6–7 weeks following injection, infected (GFP-positive) and non-transfected (GFP-negative) cells were intermixed. Whole cell recordings of PN pairs combined with local electrical stimulation confirmed that NMDARs were not functional in Cre-expressing cells (Figure 6A, B). In contrast, the amplitude of AMPAR-mediated excitation was not significantly altered by NR1 deletion (Cre−; NR1f/f: −78.9 ± 9.9 pA, Cre+; NR1f/f: −118.2 ± 29.6 pA, n = 10, p=0.43, Figure 6A, B).
Figure 6. Conditional deletion of NMDARs differentially alters dendritic and perisomatic inhibition.

(A) Schematic of whole-cell recordings in neighboring cells to compare evoked glutamatergic responses. AMPAR- (−70 mV) and NMDAR- (+40 mV) EPSCs in control (black) and NR1-lacking (red) cells are shown in the insets. (B) Summary plot of NMDAR- (left) and AMPAR-EPSC amplitude (right). (C, left) Schematic of dual recordings in neighboring cells to compare inhibitory responses evoked by an extracellular stimulating electrode in layer 1. Agatoxin (aga) was bath applied to block P/Q-type Ca2+ channels. Average IPSC traces are shown for a control (black) and a NR1-lacking (red) cell in a representative experiment. (C, right) Summary plot comparing amplitude of isolated IPSCs between wild-type and NR1-deleted cells. (D) Similar results obtained for IPSCs evoked by stimulating in layer 2/3 and in the presence of conotoxin (cono) to block N-type Ca2+ channels. Data are represented as mean ± SEM. Asterisks denote p-value of <0.05, Wilcoxon matched-pairs signed rank Test.
We then examined inhibition onto NR1-deleted cells. As Cre recombinase was utilized to remove NR1 expression, we could not adopt the same strategy of ChR2-mediated activation of IN subtypes. To compare inhibition putatively mediated by SOM-INs or PV-INs, we placed a stimulating electrode either in layer 1 or the cell body layer, respectively (Figure 6C, D). We further enhanced the selectivity of activation by including either the P/Q-type Ca2+ channel blocker agatoxin TK or the N-type channel blocker conotoxin GVIA in the bathing solution to block GABA release from specific INs (Kruglikov and Rudy, 2008). While PV-INs exclusively depend on P/Q-type Ca2+ channels for GABA release, SOM-INs utilize both channel types to mediate GABAergic transmission (Supplemental Figure 4A, B). Consistent with our preceding results, NR1 deletion led to a significant reduction in GABAergic inhibition putatively mediated by SOM-INs (Cre−; NR1f/f: −338.7 ± 100.4 pA, Cre+; NR1f/f: −120 ± 45.1 pA, n = 9, p=0.004, Figure 6C). Surprisingly, we found that loss of NMDAR signaling produced a significant enhancement of putative PV-IN-mediated inhibition (Cre−; NR1f/f: −187.1 ± 35.8 pA, Cre+; NR1f/f: −411.7 ± 83.2 pA, n = 9, p=0.004, Figure 6D). These results indicate that NMDARs control the strength of GABAergic inhibition in vivo, but the directionality of this influence differs across inhibitory synaptic subpopulations, potentially leading to a disruption of the balance between excitation and inhibition at the subcellular level.
Discussion
The cellular mechanisms underlying the preservation of balance between synaptic excitation and inhibition across distinct GABAergic circuits remain poorly understood. Recent work has begun to focus on GABAergic synaptic plasticity as a key mediator of homeostatic control (Castillo et al., 2011; Kullmann et al., 2012). In this study, we found that activation of glutamatergic NMDARs by either exogenous agonists or endogenous glutamate is capable of potentiating GABAergic synapses in the neocortex. Notably, this form of plasticity is specific to inputs arising from SOM-INs and does not occur for inputs from either PV- or VIP-INs. Using dual wavelength optogenetic stimulation, we also show that physiologically patterned optogenetic stimulation of excitatory thalamocortical fibers in the PFC is sufficient to induce iLTP. Finally, we find that signaling through NMDARs is necessary for the maintenance of putative SOM-IN synapses. Our results highlight a novel mechanism for maintaining the balance of excitation and inhibition within neocortical dendrites.
Homeostatic regulation of GABAergic signaling in the neocortex has largely focused on perisomatic inhibition. Work in vivo showed that loss of visual stimulation resulted in a weakening of PV-IN synapses onto layer 4 PNs (Maffei et al., 2006). Similarly, the ratio of glutamatergic and GABAergic inputs to layer 2/3 PNs in visual cortex is highly conserved, despite large variations in the absolute magnitudes of each component (Xue et al., 2014). This balance was attributed to the regulation of synapses formed by PV-INs, as chronically altering PN spike output resulted in a corresponding change in perisomatic inhibition (Xue et al., 2014). In keeping with this observation, several studies demonstrated modulation of PV-IN inputs following alterations in pyramidal cell firing (Bartley et al., 2008; Holmgren and Zilberter, 2001). Indeed, postsynaptic spiking is sufficient to induce changes in inhibitory synaptic efficacy from fast-spiking, putative PV-expressing interneurons (Kurotani et al., 2008; Lourenco et al., 2014). Overall, these findings suggest a direct linkage of PN output and the strength of perisomatic inhibition.
In contrast to these studies, our results indicate a distinct relationship between excitation and inhibition, where glutamatergic input is coupled to the strength of dendritic GABAergic signaling. Supporting this idea, the coupling of NMDARs with GABAergic plasticity was previously shown in cultured hippocampal neurons (Marsden et al., 2007; Petrini et al., 2014), though input specificity was not addressed. Surprisingly, hippocampal iLTP was shown to require the β3 GABAA subunit (Petrini et al., 2014), indicating that not all aspects of this phenomenon may be conserved. Nevertheless, it is intriguing to speculate that dendritic iLTP may be a general process across cortical areas. Given the dependence of SOM-IN iLTP on NMDAR-mediated Ca2+ influx, we predict that this form of plasticity will be highly localized in small dendritic regions, consistent with the compartmentalization of glutamatergic Ca2+ transients (Higley and Sabatini, 2008; Sabatini et al., 2002). We previously showed that inhibition mediated by SOM-INs could, in turn, influence excitatory transmission and Ca2+ signaling at the scale of single dendritic spines (Chiu et al., 2013), potentially driving long-term depression of glutamatergic inputs and regulating spine stability (Chen et al., 2015; Hayama et al., 2013). Thus, the homeostatic interaction of glutamatergic and GABAergic signaling may fine-tune excitatory synaptic integration at the level of individual synapses.
The critical role of inhibitory plasticity in vivo is also supported by recent work showing that GABAergic synapses formed in the dendrites of L2/3 PNs of visual cortex are highly dynamic both spontaneously and in response to altered sensory experience (Chen et al., 2012; Kannan et al., 2016; Villa et al., 2016). Notably, GABAergic inputs to distal dendrites exhibit greater turnover than more proximal contacts, with synapses on dendritic spines among the most labile (Chen et al., 2012). This observation is consistent with our earlier findings that SOM-INs make a subset of their inputs directly onto spine heads (Chiu et al., 2013). Given these results and our present findings, it would be interesting to examine the role of NMDARs in visual experience-dependent reorganization of cortical GABAergic circuits.
The selective induction of NMDAR- and CaMKIIα-dependent iLTP at synapses formed by SOM-INs might be solely explained by their structural proximity to glutamatergic inputs that also target PN dendrites. However, two results argue for a more complex explanation. First, loading either activated calmodulin or CaMKIIα through the patch pipette was insufficient to trigger iLTP at PV-IN synapses despite robustly potentiating inputs from SOM-INs. Second, application of the β2/β3-subunit containing GABAergic receptor modulator etomidate selectively altered currents evoked by stimulation of SOM-INs, while genetic deletion of the β2 subunit prevented induction of iLTP. Overall, these results suggest the tantalizing hypothesis that the molecular constituency of GABAergic synapses might differ across the somatodendritic arbor. The mechanisms underlying this molecular heterogeneity are unclear and could involve the differential trafficking of receptor subunits and accessory molecules to distinct pools of synapses across the somatodendritic arbor. In contrast to glutamatergic synapses, the structural organization of GABAergic inputs is not well characterized. Previous work has suggested the possibility that inhibitory scaffolding molecules may vary across synaptic subpopulations. In the neocortex, the cell adhesion molecule neuroligin-2 was reported to be necessary for synapses formed by PV-INs but not SOM-INs (Gibson et al., 2009) In the cerebellum, the scaffolding molecule gephyrin was suggested to be critical for dendritic but not perisomatic GABAergic inputs to Purkinje cells (Viltono et al., 2008). Recent studies have begun to reveal additional molecules involved in the structure and function of inhibitory synapses (Uezu et al., 2016; Yamasaki et al., 2017), and future investigation will be necessary to determine their selective roles in different cellular compartments.
Previous models of synaptic homeostasis often rely on a straightforward “balance” of overall excitation and inhibition that may be oversimplified. As we have shown, dysregulation of NMDAR signaling results in opposite alterations in putative PV- and SOM-IN-mediated inhibition. Importantly, these experiments do not rule out non-synaptic explanations for the links between NMDARs and GABAergic inputs in vivo. However, they are consistent with our iLTP data and highlight the possibility that the strength of inhibition can be redistributed along the somatodendritic axis in response to altered glutamatergic signaling. Indeed, many studies have suggested that the functional roles of inhibition mediated by different IN populations are highly distinct (Atallah et al., 2012; Lee et al., 2012; Wilson et al., 2012). Thus, although the total amount of inhibition may remain “balanced”, the functional consequences for cellular and circuit activity may be considerable.
In conclusion, we present evidence for a novel synapse-specific mechanism for linking excitatory signaling to the potency of dendritic GABAergic inhibition. We expect that future studies into the cellular mechanisms governing such specificity will yield rich rewards into understanding both basic synaptic development and maintenance as well as circuit organization and function.
STAR Methods
CONTACT FOR REAGENT AND RESOURCE SHARING
Further information and requests for resources and reagents should be directed to and will be fulfilled by the Lead Contact, Michael J. Higley (m.higley@yale.edu).
EXPERIMENTAL MODEL AND SUBJECT DETAILS
All animal handling was performed according to the regulations of the Yale Institutional Animal Care and Use Committee. For all experiments, we used both male and female mice. Mice were housed in a Yale University School of Medicine animal facility on an alternating 12-hour light-dark cycle and provided with food and water ad libitum. Optogenetic experiments were performed in acute prefrontal cortical (PFC) slices taken from specific interneuron Cre-driver lines (SOM-Cre, PV-Cre or VIP-Cre mice)(Taniguchi et al., 2011) at postnatal day (P) 30–50 expressing ChR2 or ChrimsonR in targeted IN populations. Control experiments were performed in an interleaved fashion in slices from the same animal on the same day. GABA uncaging experiments were conducted using cortical slices from wild-type C57/Bl6 mice (P30–50) or transgenic mice harboring floxed alleles of Gabrb2 or Gabrb3 (P55–70). Littermate controls were used without regard to sex. Extracellular stimulating electrodes were used to assess basal synaptic transmission in slices from transgenic mice harboring floxed alleles of GluN1 (P55–70). Recordings from control cells were obtained in the same experiment using the same cortical slice.
METHOD DETAILS
Slice Preparation
Under isoflurane anesthesia, mice were decapitated and coronal slices (300 μm thick) were cut in ice-cold external solution containing (in mM): 100 choline chloride, 25 NaHCO3, 1.25 NaH2PO4, 2.5 KCl, 7 MgCl2, 0.5 CaCl2, 15 glucose, 11.6 sodium ascorbate and 3.1 sodium pyruvate, bubbled with 95% O2 and 5% CO2. Slices containing the prelimbic-infralimbic regions of the PFC were then transferred to artificial cerebrospinal fluid (ACSF) containing (in mM): 127 NaCl, 25 NaHCO3, 1.25 NaH2PO4, 2.5 KCl, 1 MgCl2, 2 CaCl2 and 15 glucose, bubbled with 95% O2 and 5% CO2. After an incubation period of 30 min at 34 °C, the slices were maintained at 22–24 °C for at least 20 min before use.
Electrophysiology
Experiments were conducted at room temperature (22–24 °C) in a submersion-type recording chamber. Whole-cell voltage-clamp recordings were obtained from layer 2/3 pyramidal cells located 200–300 μm from the pial surface and identified with video infrared differential interference contrast. To obtain measurable GABAAR responses at a membrane holding potential of −70 mV, glass electrodes (3.0–3.2 MΩ) were filled with a high chloride internal solution containing (in mM): 100 CsCl, 30 CsGluconate, 10 HEPES, 4 MgCl2, 4 Na2ATP, 0.4 NaGTP and 10 sodium creatine phosphate, adjusted to pH 7.3 with CsOH. In GABA uncaging experiments, red-fluorescent Alexa Fluor-594 (10 μM)(Invitrogen) was included in the pipette solution to visualize cell morphology. For all recordings, series resistance was 15–25 MΩ and uncompensated. Recordings were discarded if series resistance changed >15% during the experiment. Electrophysiological recordings were made using a Multiclamp 700B amplifier (Molecular Devices), filtered at 4 kHz, and digitized at 10 kHz using acquisition software written in Matlab (Mathworks)(Pologruto et al., 2003).
Synaptic stimulation and GABA uncaging
To photoactivate specific INs, SOM-Cre, PV-Cre or VIP-Cre mice were injected at P14–20 into the PFC with recombinant AAV driving Cre-dependent expression of either a ChR2-YFP or ChrimsonR-tdTomato fusion protein under the Ef1α promoter (AAV5-DIO-Ef1α-ChR2-YFP, University of North Carolina Vector Core or AAV5-DIO-CAG-ChrimsonR-tdTomato, Addgene). To photoactivate thalamic fibers, mice were injected into MD with AAV driving non-conditional expression of ChR2-YFP. Mice were sacrificed 14–21 days post-injection for slice preparation as described above. To activate opsin-positive cells or fibers, we filled the back aperture of the microscope objective (60x, 1.0 NA, Olympus) with blue (473 nm) or red (594 nm) light from fiber-coupled 473 nm or 594 nm lasers (Spectra Physics), yielding a ~15–20 μm diameter disc of light at the focal plane. A brief (0.5–3 ms) pulse of light (3–5 mW at the sample) reliably stimulated ChR2- and Chrimson-expressing cells/fibers and evoked EPSCs or IPSCs in pyramidal neurons. To photorelease GABA, 11 μM Rubi-GABA (Chiu et al., 2013; Rial Verde et al., 2008) was included in the bathing ACSF and the microscope objective was centered over the apical dendritic arbor of the recorded neuron. Light pulses were delivered as with optogenetic stimulation and reliably evoked IPSCs. For experiments involving local electrical stimulation, a glass theta stimulating electrode was placed in layer 1 or 2/3 to evoke IPSCs in distal or perisomatic regions, respectively.
Conditional deletion of targeted receptor subunits
To remove functional NMDARs, mice harboring a floxed allele of GluN1 (Tsien et al., 1996) (P14–20) were injected into the PFC with AAV driving expression of a Cre-GFP fusion protein under the CaMKIIα promoter (AAV-CaMKIIα-Cre-GFP)(University of North Carolina Vector Core). Virus was diluted 1:10 and injected at a volume of 1 μl to obtain sparse infection. Mice were sacrificed 6–7 weeks post-injection for slice preparation as described above. A similar approach was used to delete the GABAA receptor β2 (see below) or β3 (Ferguson et al., 2007) subunit.
Generation of conditional β2 knockout mice
A BAC clone containing the GABAAR β2 gene (Gabrb2) from C57BL/6 mice genomic DNA was purchased from BACPAC Resources Center (Oakland, CA USA). We combined MultiSite Gateway cloning technology (Invitrogen, Carlsbad, CA USA) and Red/ET-mediated homologous recombination (Gene Bridges GmbH, Heidelberg, Germany) for targeting vector construction. The targeting vector was linearized, electroporated into the embryonic stem (ES) cell line RENKA derived from the C57BL/6N strain (Mishina and Sakimura, 2007), and selected by G418. Recombinant clones were identified by Southern blot analysis using the Gabrb2 5′ probe on Spe I-digested genomic DNA, and the Gabrb2 3′ probe on BamH I-digested genomic DNA. Targeted clones were injected into eight-cell stage embryos of a CD-1 mouse strain. The embryos were cultured to blastocysts and transferred to pseudopregnant CD-1 mice. Resulting male chimeric mice were crossed with female C57BL/6N mice. After Cre-loxP recombination, the elimination of exon 4 results in a frame-shift mutation in the gene encoding GABAAR β2.
Pharmacology
For most experiments (excluding thalamic stimulation experiments), the ACSF included 10 μM NBQX to block AMPA receptors. In a subset of experiments (see text), the ACSF also included (in μM): 6 ifenprodil, 3 CGP-55845, 3 nimodipine, 5 KN-62, 20 cyclosporine A, 100 (S)-MCPG, 50 CPP, 0.5 etomidate, 0.2 ω-agatoxin TK or 1 ω-conotoxin GVIA. In cell loading experiments, the drug concentrations (in μM unless indicated otherwise) are as follows: 500 MK-801, 10 mM BAPTA, 10 AIP, 40/10 Ca2+/calmodulin or 200 ng/ml BoNT-A. For loading constitutively active CaMKII*, the compound was synthesized as previously described (Tavalin and Colbran, 2017) and added to the internal solution. All compounds other than CaMKIIα were purchased from Tocris except for conotoxin (Peptides International), agatoxin (Peptides International), and calmodulin (Sigma-Aldrich).
Slice resectioning for immunofluorescence
Brain slices were fixed after recording in 4% formaldehyde in phosphate buffer (PBS) for 1 hour at 4°C and then stored in PBS overnight. Post-fixed slices were embedded in 10% gelatin at 4°C and re-sectioned to 50 μm on a vibratome. Slices were incubated in blocking solution containing 10% normal goat serum, 1% bovine serum albumin, and 0.1% Triton X-100 for 1.5 hours at 4°C prior to immunostaining. To visualize ChR2-EYFP SOM-INs, a primary antibody made in rabbit against green fluorescent protein (GFP) (Invitrogen A6455, 1:500) was applied overnight at 4°C. Sections were then stained with Alexa 488-conjugated secondary antibody (Invitrogen A11008, 1:300) for 4 hours at RT°, rinsed repeatedly with buffer, and mounted on microscope slides for epifluorescence imaging. To visualize both Chrimson-tdT SOM-INs and ChR2-EYFP thalamic afferents, we used chicken anti-GFP (Rockland 600-901-215S, 1:300) and rabbit anti-RFP (Rockland 600-401-379, 1:300). Sections were stained with Alexa 488-conjugated secondary antibody (Invitrogen A11039, 1:300) and Alexa 555-conjugated secondary antibody (Invitrogen A21428, 1:300). Immunofluorescence images were acquired using an Olympus epifluorescence microscope with a 10x objective.
QUANTIFICATION AND STATISTICAL ANALYSIS
Off-line analysis of electrophysiological recordings was performed using custom routines written in IgorPro (Wavemetrics). IPSC amplitudes were calculated by finding the peak of the current traces and averaging the values within a 1 ms window. Potentiation of GABAergic responses was assessed by comparing the average IPSC amplitude in the first 5 minutes prior to NMDA application or thalamic stimulation to the average IPSC amplitude 20–25 minutes after plasticity induction for each experiment, using paired Student’s t-tests at a significance level of p<0.05 in GraphPad Prism 7. To assess the effect of pharmacological blockade on iLTP, we performed Mann-Whitney tests comparing drug versus control experiments. For recordings comparing pairs of neighboring GluN1-positive and -negative cells, a Wilcoxon matched-pairs signed rank test was performed to assess significance at p<0.05 due to non-normally distributed data. Data are represented as mean ± SEM throughout the main text and in all figures. N represents the number of cells, and on average 2–3 cells were obtained from a single animal.
Supplementary Material
HIGHLIGHTS.
Activation of NMDARs potentiates dendritic GABAergic inhibition.
Dendritic but not perisomatic GABAergic synapses are sensitive to CaMKIIα activity.
GABAergic potentiation requires expression of the GABAAR β2 subunit.
Loss of NMDARs alters the balance of inhibition along the somatodendritic axis.
Acknowledgments
The authors wish to thank Dr. Jessica Cardin for helpful comments during the preparation of this manuscript and Dr. Ed Boyden for help with the use of ChrimsonR. This work was funded by the NIH (R01 MH099045 to MJH, R01 NS076637 to SJT, and K01 MH097961 to CQC), the March of Dimes Basil O’Connor Award to MJH, and funding agencies in Chile (FONDECYT No. 1171840 and PROYECTO P09-022-F, CINV to CQC).
Footnotes
Author Contributions:
CQC and MJH designed the experiments and wrote the manuscript. CQC performed all experiments. JSM, ST, MY, and RN designed and generated the conditional β2 subunit mouse. SJT designed and synthesized constitutively active CaMKIIα.
Declaration of Interests:
All authors have no competing interests to declare.
Publisher's Disclaimer: This is a PDF file of an unedited manuscript that has been accepted for publication. As a service to our customers we are providing this early version of the manuscript. The manuscript will undergo copyediting, typesetting, and review of the resulting proof before it is published in its final citable form. Please note that during the production process errors may be discovered which could affect the content, and all legal disclaimers that apply to the journal pertain.
References
- Ascoli GA, Alonso-Nanclares L, Anderson SA, Barrionuevo G, Benavides-Piccione R, Burkhalter A, Buzsaki G, Cauli B, Defelipe J, Fairen A, et al. Petilla terminology: nomenclature of features of GABAergic interneurons of the cerebral cortex. Nat Rev Neurosci. 2008;9:557–568. doi: 10.1038/nrn2402. [DOI] [PMC free article] [PubMed] [Google Scholar]
- Atallah BV, Bruns W, Carandini M, Scanziani M. Parvalbumin-expressing interneurons linearly transform cortical responses to visual stimuli. Neuron. 2012;73:159–170. doi: 10.1016/j.neuron.2011.12.013. [DOI] [PMC free article] [PubMed] [Google Scholar]
- Bartley AF, Huang ZJ, Huber KM, Gibson JR. Differential activity-dependent, homeostatic plasticity of two neocortical inhibitory circuits. J Neurophysiol. 2008;100:1983–1994. doi: 10.1152/jn.90635.2008. [DOI] [PMC free article] [PubMed] [Google Scholar]
- Bolkan SS, Stujenske JM, Parnaudeau S, Spellman TJ, Rauffenbart C, Abbas AI, Harris AZ, Gordon JA, Kellendonk C. Thalamic projections sustain prefrontal activity during working memory maintenance. Nat Neurosci. 2017;20:987–996. doi: 10.1038/nn.4568. [DOI] [PMC free article] [PubMed] [Google Scholar]
- Cardin JA, Carlen M, Meletis K, Knoblich U, Zhang F, Deisseroth K, Tsai LH, Moore CI. Driving fast-spiking cells induces gamma rhythm and controls sensory responses. Nature. 2009;459:663–667. doi: 10.1038/nature08002. [DOI] [PMC free article] [PubMed] [Google Scholar]
- Castillo PE, Chiu CQ, Carroll RC. Long-term plasticity at inhibitory synapses. Curr Opin Neurobiol. 2011;21:328–338. doi: 10.1016/j.conb.2011.01.006. [DOI] [PMC free article] [PubMed] [Google Scholar]
- Chen JL, Villa KL, Cha JW, So PT, Kubota Y, Nedivi E. Clustered dynamics of inhibitory synapses and dendritic spines in the adult neocortex. Neuron. 2012;74:361–373. doi: 10.1016/j.neuron.2012.02.030. [DOI] [PMC free article] [PubMed] [Google Scholar]
- Chen SX, Kim AN, Peters AJ, Komiyama T. Subtype-specific plasticity of inhibitory circuits in motor cortex during motor learning. Nat Neurosci. 2015;18:1109–1115. doi: 10.1038/nn.4049. [DOI] [PMC free article] [PubMed] [Google Scholar]
- Chiu CQ, Lur G, Morse TM, Carnevale NT, Ellis-Davies GC, Higley MJ. Compartmentalization of GABAergic inhibition by dendritic spines. Science. 2013;340:759–762. doi: 10.1126/science.1234274. [DOI] [PMC free article] [PubMed] [Google Scholar]
- Clements JD. Variance-mean analysis: a simple and reliable approach for investigating synaptic transmission and modulation. Journal of neuroscience methods. 2003;130:115–125. doi: 10.1016/j.jneumeth.2003.09.019. [DOI] [PubMed] [Google Scholar]
- Ferguson C, Hardy SL, Werner DF, Hileman SM, Delorey TM, Homanics GE. New insight into the role of the beta3 subunit of the GABAA-R in development, behavior, body weight regulation, and anesthesia revealed by conditional gene knockout. BMC Neurosci. 2007;8:85. doi: 10.1186/1471-2202-8-85. [DOI] [PMC free article] [PubMed] [Google Scholar]
- Fu Y, Tucciarone JM, Espinosa JS, Sheng N, Darcy DP, Nicoll RA, Huang ZJ, Stryker MP. A cortical circuit for gain control by behavioral state. Cell. 2014;156:1139–1152. doi: 10.1016/j.cell.2014.01.050. [DOI] [PMC free article] [PubMed] [Google Scholar]
- Gibson JR, Huber KM, Sudhof TC. Neuroligin-2 deletion selectively decreases inhibitory synaptic transmission originating from fast-spiking but not from somatostatin-positive interneurons. J Neurosci. 2009;29:13883–13897. doi: 10.1523/JNEUROSCI.2457-09.2009. [DOI] [PMC free article] [PubMed] [Google Scholar]
- Gogolla N, Leblanc JJ, Quast KB, Sudhof T, Fagiolini M, Hensch TK. Common circuit defect of excitatory-inhibitory balance in mouse models of autism. J Neurodev Disord. 2009;1:172–181. doi: 10.1007/s11689-009-9023-x. [DOI] [PMC free article] [PubMed] [Google Scholar]
- Hayama T, Noguchi J, Watanabe S, Takahashi N, Hayashi-Takagi A, Ellis-Davies GC, Matsuzaki M, Kasai H. GABA promotes the competitive selection of dendritic spines by controlling local Ca2+ signaling. Nat Neurosci. 2013;16:1409–1416. doi: 10.1038/nn.3496. [DOI] [PMC free article] [PubMed] [Google Scholar]
- He Q, Duguid I, Clark B, Panzanelli P, Patel B, Thomas P, Fritschy JM, Smart TG. Interneuron- and GABA(A) receptor-specific inhibitory synaptic plasticity in cerebellar Purkinje cells. Nature communications. 2015;6:7364. doi: 10.1038/ncomms8364. [DOI] [PMC free article] [PubMed] [Google Scholar]
- Higley MJ, Sabatini BL. Calcium signaling in dendrites and spines: practical and functional considerations. Neuron. 2008;59:902–913. doi: 10.1016/j.neuron.2008.08.020. [DOI] [PubMed] [Google Scholar]
- Holmgren CD, Zilberter Y. Coincident spiking activity induces long-term changes in inhibition of neocortical pyramidal cells. J Neurosci. 2001;21:8270–8277. doi: 10.1523/JNEUROSCI.21-20-08270.2001. [DOI] [PMC free article] [PubMed] [Google Scholar]
- Isaacson JS, Scanziani M. How inhibition shapes cortical activity. Neuron. 2011;72:231–243. doi: 10.1016/j.neuron.2011.09.027. [DOI] [PMC free article] [PubMed] [Google Scholar]
- Kannan M, Gross GG, Arnold DB, Higley MJ. Visual Deprivation During the Critical Period Enhances Layer 2/3 GABAergic Inhibition in Mouse V1. J Neurosci. 2016;36:5914–5919. doi: 10.1523/JNEUROSCI.0051-16.2016. [DOI] [PMC free article] [PubMed] [Google Scholar]
- Klapoetke NC, Murata Y, Kim SS, Pulver SR, Birdsey-Benson A, Cho YK, Morimoto TK, Chuong AS, Carpenter EJ, Tian Z, et al. Independent optical excitation of distinct neural populations. Nature methods. 2014;11:338–346. doi: 10.1038/nmeth.2836. [DOI] [PMC free article] [PubMed] [Google Scholar]
- Kruglikov I, Rudy B. Perisomatic GABA release and thalamocortical integration onto neocortical excitatory cells are regulated by neuromodulators. Neuron. 2008;58:911–924. doi: 10.1016/j.neuron.2008.04.024. [DOI] [PMC free article] [PubMed] [Google Scholar]
- Kullmann DM, Moreau AW, Bakiri Y, Nicholson E. Plasticity of inhibition. Neuron. 2012;75:951–962. doi: 10.1016/j.neuron.2012.07.030. [DOI] [PubMed] [Google Scholar]
- Kurotani T, Yamada K, Yoshimura Y, Crair MC, Komatsu Y. State-dependent bidirectional modification of somatic inhibition in neocortical pyramidal cells. Neuron. 2008;57:905–916. doi: 10.1016/j.neuron.2008.01.030. [DOI] [PMC free article] [PubMed] [Google Scholar]
- Lee SH, Foldy C, Soltesz I. Distinct endocannabinoid control of GABA release at perisomatic and dendritic synapses in the hippocampus. J Neurosci. 2010;30:7993–8000. doi: 10.1523/JNEUROSCI.6238-09.2010. [DOI] [PMC free article] [PubMed] [Google Scholar]
- Lee SH, Kwan AC, Zhang S, Phoumthipphavong V, Flannery JG, Masmanidis SC, Taniguchi H, Huang ZJ, Zhang F, Boyden ES, et al. Activation of specific interneurons improves V1 feature selectivity and visual perception. Nature. 2012;488:379–383. doi: 10.1038/nature11312. [DOI] [PMC free article] [PubMed] [Google Scholar]
- Lewis DA, Hashimoto T. Deciphering the disease process of schizophrenia: the contribution of cortical GABA neurons. Int Rev Neurobiol. 2007;78:109–131. doi: 10.1016/S0074-7742(06)78004-7. [DOI] [PubMed] [Google Scholar]
- Lourenco J, Pacioni S, Rebola N, van Woerden GM, Marinelli S, DiGregorio D, Bacci A. Non-associative potentiation of perisomatic inhibition alters the temporal coding of neocortical layer 5 pyramidal neurons. PLoS biology. 2014;12:e1001903. doi: 10.1371/journal.pbio.1001903. [DOI] [PMC free article] [PubMed] [Google Scholar]
- Maffei A, Nataraj K, Nelson SB, Turrigiano GG. Potentiation of cortical inhibition by visual deprivation. Nature. 2006;443:81–84. doi: 10.1038/nature05079. [DOI] [PubMed] [Google Scholar]
- Malenka RC, Bear MF. LTP and LTD: an embarrassment of riches. Neuron. 2004;44:5–21. doi: 10.1016/j.neuron.2004.09.012. [DOI] [PubMed] [Google Scholar]
- Marsden KC, Beattie JB, Friedenthal J, Carroll RC. NMDA receptor activation potentiates inhibitory transmission through GABA receptor-associated protein-dependent exocytosis of GABA(A) receptors. J Neurosci. 2007;27:14326–14337. doi: 10.1523/JNEUROSCI.4433-07.2007. [DOI] [PMC free article] [PubMed] [Google Scholar]
- Mishina M, Sakimura K. Conditional gene targeting on the pure C57BL/6 genetic background. Neurosci Res. 2007;58:105–112. doi: 10.1016/j.neures.2007.01.004. [DOI] [PubMed] [Google Scholar]
- Murayama M, Perez-Garci E, Nevian T, Bock T, Senn W, Larkum ME. Dendritic encoding of sensory stimuli controlled by deep cortical interneurons. Nature. 2009;457:1137–1141. doi: 10.1038/nature07663. [DOI] [PubMed] [Google Scholar]
- Petrini EM, Ravasenga T, Hausrat TJ, Iurilli G, Olcese U, Racine V, Sibarita JB, Jacob TC, Moss SJ, Benfenati F, et al. Synaptic recruitment of gephyrin regulates surface GABAA receptor dynamics for the expression of inhibitory LTP. Nature communications. 2014;5:3921. doi: 10.1038/ncomms4921. [DOI] [PMC free article] [PubMed] [Google Scholar]
- Pfeffer CK, Xue M, He M, Huang ZJ, Scanziani M. Inhibition of inhibition in visual cortex: the logic of connections between molecularly distinct interneurons. Nat Neurosci. 2013;16:1068–1076. doi: 10.1038/nn.3446. [DOI] [PMC free article] [PubMed] [Google Scholar]
- Pologruto TA, Sabatini BL, Svoboda K. ScanImage: flexible software for operating laser scanning microscopes. Biomed Eng Online. 2003;2:13. doi: 10.1186/1475-925X-2-13. [DOI] [PMC free article] [PubMed] [Google Scholar]
- Pouille F, Scanziani M. Enforcement of temporal fidelity in pyramidal cells by somatic feed-forward inhibition. Science. 2001;293:1159–1163. doi: 10.1126/science.1060342. [DOI] [PubMed] [Google Scholar]
- Rial Verde EM, Zayat L, Etchenique R, Yuste R. Photorelease of GABA with Visible Light Using an Inorganic Caging Group. Front Neural Circuits. 2008;2:2. doi: 10.3389/neuro.04.002.2008. [DOI] [PMC free article] [PubMed] [Google Scholar]
- Rudy B, Fishell G, Lee S, Hjerling-Leffler J. Three groups of interneurons account for nearly 100% of neocortical GABAergic neurons. Dev Neurobiol. 2011;71:45–61. doi: 10.1002/dneu.20853. [DOI] [PMC free article] [PubMed] [Google Scholar]
- Sabatini BL, Oertner TG, Svoboda K. The life cycle of Ca(2+) ions in dendritic spines. Neuron. 2002;33:439–452. doi: 10.1016/s0896-6273(02)00573-1. [DOI] [PubMed] [Google Scholar]
- Taniguchi H, He M, Wu P, Kim S, Paik R, Sugino K, Kvitsiani D, Fu Y, Lu J, Lin Y, et al. A resource of Cre driver lines for genetic targeting of GABAergic neurons in cerebral cortex. Neuron. 2011;71:995–1013. doi: 10.1016/j.neuron.2011.07.026. [DOI] [PMC free article] [PubMed] [Google Scholar]
- Tavalin SJ, Colbran RJ. CaMKII-mediated phosphorylation of GluN2B regulates recombinant NMDA receptor currents in a chloride-dependent manner. Molecular and cellular neurosciences. 2017;79:45–52. doi: 10.1016/j.mcn.2016.12.002. [DOI] [PMC free article] [PubMed] [Google Scholar]
- Tsien JZ, Chen DF, Gerber D, Tom C, Mercer EH, Anderson DJ, Mayford M, Kandel ER, Tonegawa S. Subregion- and cell type-restricted gene knockout in mouse brain. Cell. 1996;87:1317–1326. doi: 10.1016/s0092-8674(00)81826-7. [DOI] [PubMed] [Google Scholar]
- Turrigiano G. Too many cooks? Intrinsic and synaptic homeostatic mechanisms in cortical circuit refinement. Annu Rev Neurosci. 2011;34:89–103. doi: 10.1146/annurev-neuro-060909-153238. [DOI] [PubMed] [Google Scholar]
- Uezu A, Kanak DJ, Bradshaw TW, Soderblom EJ, Catavero CM, Burette AC, Weinberg RJ, Soderling SH. Identification of an elaborate complex mediating postsynaptic inhibition. Science. 2016;353:1123–1129. doi: 10.1126/science.aag0821. [DOI] [PMC free article] [PubMed] [Google Scholar]
- van Versendaal D, Rajendran R, Saiepour MH, Klooster J, Smit-Rigter L, Sommeijer JP, De Zeeuw CI, Hofer SB, Heimel JA, Levelt CN. Elimination of inhibitory synapses is a major component of adult ocular dominance plasticity. Neuron. 2012;74:374–383. doi: 10.1016/j.neuron.2012.03.015. [DOI] [PubMed] [Google Scholar]
- Villa KL, Berry KP, Subramanian J, Cha JW, Chan Oh W, Kwon HB, Kubota Y, So PT, Nedivi E. Inhibitory Synapses Are Repeatedly Assembled and Removed at Persistent Sites In Vivo. Neuron. 2016;90:662–664. doi: 10.1016/j.neuron.2016.03.035. [DOI] [PubMed] [Google Scholar]
- Viltono L, Patrizi A, Fritschy JM, Sassoe-Pognetto M. Synaptogenesis in the cerebellar cortex: differential regulation of gephyrin and GABAA receptors at somatic and dendritic synapses of Purkinje cells. J Comp Neurol. 2008;508:579–591. doi: 10.1002/cne.21713. [DOI] [PubMed] [Google Scholar]
- Wang JH, Kelly PT. Postsynaptic injection of CA2+/CaM induces synaptic potentiation requiring CaMKII and PKC activity. Neuron. 1995;15:443–452. doi: 10.1016/0896-6273(95)90048-9. [DOI] [PubMed] [Google Scholar]
- Wilson NR, Runyan CA, Wang FL, Sur M. Division and subtraction by distinct cortical inhibitory networks in vivo. Nature. 2012;488:343–348. doi: 10.1038/nature11347. [DOI] [PMC free article] [PubMed] [Google Scholar]
- Xue M, Atallah BV, Scanziani M. Equalizing excitation-inhibition ratios across visual cortical neurons. Nature. 2014;511:596–600. doi: 10.1038/nature13321. [DOI] [PMC free article] [PubMed] [Google Scholar]
- Yamasaki T, Hoyos-Ramirez E, Martenson JS, Morimoto-Tomita M, Tomita S. GARLH Family Proteins Stabilize GABAA Receptors at Synapses. Neuron. 2017;93:1138–1152. e1136. doi: 10.1016/j.neuron.2017.02.023. [DOI] [PMC free article] [PubMed] [Google Scholar]
Associated Data
This section collects any data citations, data availability statements, or supplementary materials included in this article.