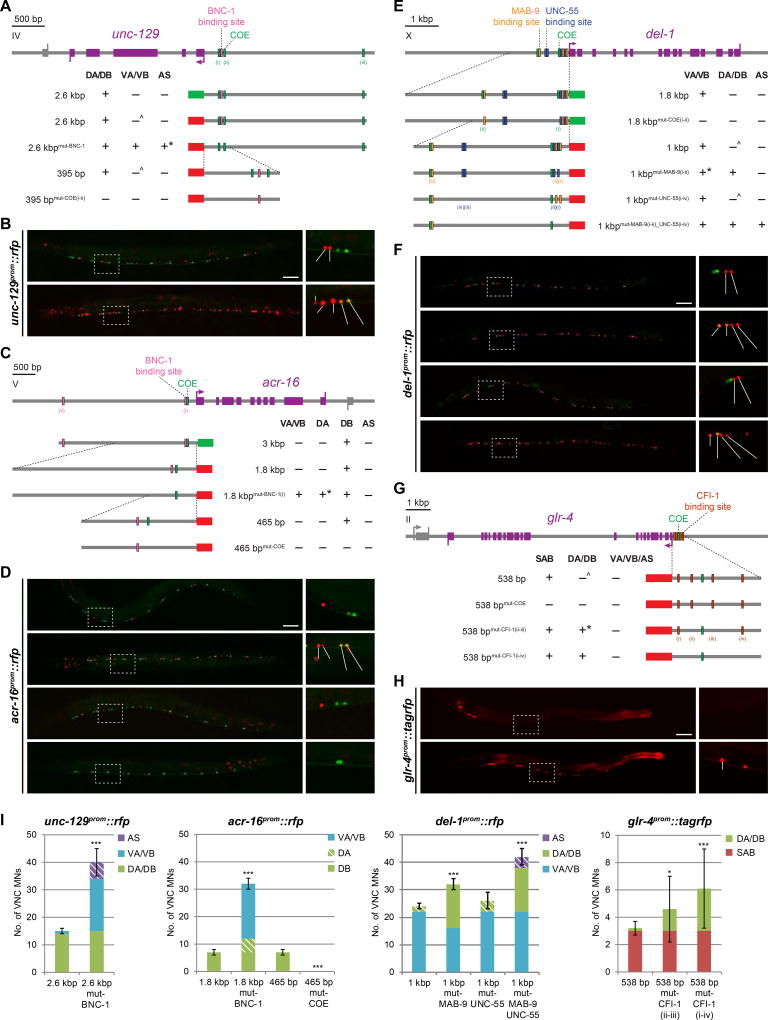
Figure 6. Repressor binding sites adjacent to COE motif mediate class specificity of motor neuron effector gene expression.
White-filled vertical rectangles represent mutated sites. Expression observed in corresponding MN class (+); absence of expression (−); although largely absent, weak expression in a small number of MNs occasionally observed (^); unexpected result to be addressed (*). All scale bars = 50 µm.
A,B: Mutation of BNC-1 binding site results in unc-129 derepression in VA/VB and AS MNs. *The BNC-1 site harbors two UNC-55 site consensus motifs with one mismatch in each. These two repressors may be sharing the same site in this case. del-1prom::gfp marks VA/VB MNs.
C,D: Mutating the COE motif causes acr-16 expression to be lost. When the BNC-1 binding site is mutated, acr-16 becomes derepressed in VA/VB and DA MNs. *The BNC-1 site does not resemble that of UNC-4 nor is there an UNC-4 site near that of BNC-1. This result nonetheless supports the notion that effector genes are repressed at the cis-regulatory level to achieve class specificity. 1.8 kb reporter image repeated from Fig.4D; del-1prom::gfp marks VA/VB MNs.
E,F: Mutation of two MAB-9 binding sites adjacent to the COE motif proximal to the start codon results in del-1 derepression in DA/DB MNs. *Expression in anterior VA/VBs (from VA2/VB3 and upward) is at times repressed – hinting at finer subclass regulation. No derepression is observed when all four UNC-55 sites are mutated, but deletion of both validated MAB-9 and all four UNC-55 sites results in del-1 derepression in DA/DB and AS MNs. unc-129prom::gfp marks DA/DB MNs.
G,H: Mutating the two CFI-1 binding sites flanking the COE motif causes glr-4 to be derepressed in DA/DB MNs, albeit in a variable manner. This effect is potentiated when all four sites are mutated.
I: Quantification for B, D, F, and H; error bars show SD. Superimposed diagonal stripes indicate dim expression. At least three independent transgenic lines were assessed although only the most representative line is shown. Unpaired t-tests were performed comparing each line with its corresponding non-mutated control; ***p < 0.001; *p < 0.05; n ≥ 10.

