

SUMMARY
Cancer stem cells (CSCs) are critical for cancer progression and chemoresistance. How lipid metabolism regulates CSCs and chemoresistance remains elusive. Here, we demonstrate that JAK/STAT3 regulates lipid metabolism, which promotes breast CSCs (BCSCs) and cancer chemoresistance. Inhibiting JAK/STAT3 blocks BCSC self-renewal and expression of diverse lipid metabolic genes, including carnitine palmitoyltransferase 1B (CPT1B), which encodes the critical enzyme for fatty acid β-oxidation (FAO). Moreover, mammary adipocyte-derived leptin upregulates STAT3-induced CPT1B expression and FAO activity in BCSCs. Human breast cancer-derived data suggest STAT3-CPT1B-FAO pathway promotes cancer cell stemness and chemoresistance. Blocking FAO and/or leptin re-sensitizes them to chemotherapy and inhibits BCSCs in mouse breast tumors in vivo. We identify a critical pathway for BCSC maintenance and breast cancer chemoresistance.
eTOC
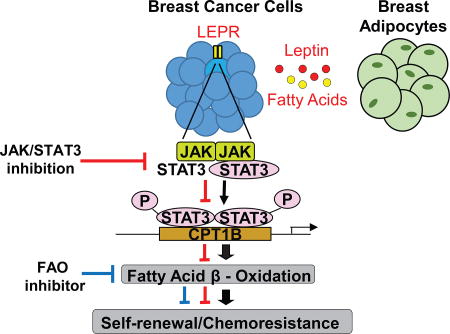
Cancer stem cells play an important role in cancer development and chemoresistance. Wang et al. show that leptin-JAK/STAT3 regulates lipid metabolism through fatty acid β-oxidation (FAO), promoting breast cancer stemness and chemoresistance. Blocking FAO and/or depleting leptin re-sensitize cancer cells to chemotherapy while reducing cancer stemness in vivo.
INTRODUCTION
Chemoresistance remains a major hurdle for cancer therapy. A subpopulation of cancer cells that is highly tumorigenic and resistant to various therapies constitute the so-called cancer stem cells (CSCs)(Bose et al., 2011; Oliva et al., 2010; Shafee et al., 2008). Although critical roles played by CSCs in tumor progression and resistance to therapies are established, targeting and eliminating these cells is still problematic in the clinic. Consequently, there is an urgent need to understand the molecular pathways sustaining CSC characteristics.
The critical role of metabolic regulation in cancer progression and, more recently, resistance to therapy has been recognized (Baumann et al., 2013; Camarda et al., 2016; Sounni et al., 2014; Zhou et al., 2003). During tumor progression, cancer cells reprogram their metabolic profiles geared toward glycolysis, which provides building blocks for the synthesis of macromolecules and biomass to support proliferation and survival. Proliferating cancer cells ferment glucose to generate ATP, despite sufficient oxygen available to support oxidative phosphorylation (OXPHOS), a phenomenon known as the Warburg effect (Hsu and Sabatini, 2008; Vander Heiden et al., 2009).
Emerging studies reveal that CSCs are metabolically distinct from cancer cells, and the degree of glycolytic activity required for CSCs remains controversial (Ciavardelli et al., 2014; Janiszewska et al., 2012; Mao et al., 2013; Vlashi et al., 2011). For example, glioblastoma stem cells (GSCs) consume less glucose and produce less lactate than their differentiated tumor cells (Vlashi et al., 2011). Notably, even in the presence of low glycolytic flux, GSCs still produce high ATPs and exhibit enhanced spare respiratory capacity, indicating that CSCs may rely on catabolism to generate ATP while utilizing anabolism to create biomass (Vlashi et al., 2011), and GSCs use OXPHOS to meet energy demands by interchangeably breaking down glucose, amino acids, and fats to fuel tricarboxylic acid (TCA) cycle and ATP production (Janiszewska et al., 2012). However, whether CSCs attain a unique phenotype through catabolic metabolism such as OXPHOS remains to be explored.
Previously we and others demonstrated that blocking JAK/STAT3 inhibits CSC self-renewal and tumor growth in vivo (Herrmann et al., 2014; Marotta et al., 2011; Schroeder et al., 2014). The importance of STAT3 in promoting glycolysis through transcriptional regulation has been shown in proliferating breast cancer cells (Demaria et al., 2010). Interestingly, STAT3 is also found in the cell mitochondrion, and mitochondrial STAT3 sustains OXPHOS activities in breast cancer cells. Blocking STAT3 downregulates mitochondrial electron transport chain in breast cancer cells, and breast tumor growth in vivo (Tammineni et al., 2013; Zhang et al., 2013). Although these findings suggest that STAT3 might contribute to tumor-promoting CSC phenotype and function by regulating anabolic and possibly also catabolic metabolism, no studies have delineated how JAK/STAT3 could regulate CSC metabolically, thereby impacting resistance to therapy.
RESULTS
JAK Regulates Lipid Metabolism in BCSCs
The pan-JAK small molecule inhibitorAZD1480 has been shown to effectively inhibit JAK and STAT3 activity in various cancer cells (Hedvat et al., 2009). Treating breast cancer cell line HCC1937 with AZD1480 significantly lowered the viability of its CSCs (CD44+/CD24−)(Figure 1A), in contrast to non-cancer stem cells (NCSC) (Figure 1A). Similarly, treating MCF7 cells, which exhibit CSC-like characteristics in tumorspheres and initiate tumors in vivo with minimal numbers of engrafted cells (Al-Hajj et al., 2003; Wang et al., 2014b), with AZD1480 suppressed tumorsphere formation (Figure 1B). To identify the JAK/STAT3 downstream pathways responsible for regulating BCSC propagation, we performed RNAseq analyses using RNAs prepared from MCF7 tumorspheres treated with AZD1480, which indicated that some lipid metabolic genes might be regulated by JAK/STAT pathway. qRT-PCR showed that blocking JAK/STAT3 with AZD1480 downregulated several key lipid metabolism genes in BCSCs, including the rate limiting enzyme, carnitinepalmitoyl transferase 1 (CPT1), for Fatty Acid Oxidation (FAO) (Figure 1C). Metabolomic analyses were performed using lysates prepared from Hs578T and MDA-MB-436, which are CD44+/CD24− BCSC-enriched cell lines, and CD24+ HCC1500 and BT20 breast cancer cell lines, which are known to be mainly NCSCs (Sheridan et al., 2006). Tumorsphere formation was confirmed and the results for Hs578T, MDA-MB-436, HCC1500 and BT20 are provided in Figure S1A. The metabolomic analyses indicated that levels of long-chain acylcarnitines C16:0 and C18:1, but not medium- or short-chain acylcarnitines, were higher in Hs578T and MDA-MB-436 BCSC cell lines relative to HCC1500 and BT20 NCSC cell lines (Figure 1D and S1B). These findings are supportive of enhanced long-chain FAO metabolites in BCSCs as compared to NCSC populations.
Figure 1. Inhibiting JAK BCSCs Reduces Self-Renewal and Expression of Lipid Metabolic Genes.

(A) Effects of AZD1480 on proliferation/survival of non-cancer stem cells (NCSC; CD24+) and cancer stem cells (CSC; CD44+/CD24−) of HCC1937 cells as shown by the ratio of trypan blue negative cells (live cells) treated with AZD1480 at the indicated concentrations or DMSO (0). Shown are mean ± SD (n=3). (B) Tumorsphere-forming assay comparing impacts of AZD1480 and DMSO treatments on tumorsphere formation of MCF7 cells. Shown are mean ± SD (n=3). (C) Real–time PCR analysis assessing expression of key lipid metabolic genes in MCF7 tumorspheres treated with DMSO or 1µM AZD1480. Shown are mean ± SD (n=3). (D) Fold-change in fatty acylcarnitines and L-carnitine in Hs578T, MDA-MB-436 and HCC1500 relative to BT20. Significance was determined by One-Way ANOVA with Tukey HSD Post Hoc Test. *p<0.05, **p<0.005, and ***p<0.0005
BCSC Self-Renewal Requires Catabolic FAO
To investigate a role of FAO in BCSCs, we first compared the oxidation rate of 3H-palmitic acid in BCSCs vs. NCSCs. We used BBM2 and BBM3 cells, which were derived from patient breast-to-brain metastasis that retain their original tissue morphology (Neman et al., 2014). Without well-defined CSC markers from patient primary cells, we used non-adherent mammosphere culture to enrich early progenitor/stem cells for BBM2 and BBM3 primary cells (Grimshaw et al., 2008). Tumorspheres of BBM2 and BBM3 and CSC (CD44+/CD24−) MDA-MB-468 cells expressed high levels of stem cell markers including MSI1, OCT4 and NANOG (Figure S1C and D). In addition, CSC MDA-MB-468 cells showed increased ability to form colonies when plated in soft agar (Figure S1E) compared to NCSCs (CD24+). Importantly, BBM2 tumorspheres and BCSC cells from MDA-MB-468 exhibited elevated FAO rates compared to NCSC populations (Figure 2A).
Figure 2. FAO is Elevated in BCSCS and Required for Self-Renewal.

(A) FAO assay comparing of FAO levels in BBM2 tumorspheres (CSC) vs. adherent BBM2 cells (NCSC) and CD44+/CD24− (CSC) vs. CD24+ (NCSC) MDA-MB-468 cells. Shown are mean ± SD (n=3). (B) Immunofluorescent images of patient breast cancer tissues showing CD44+ cells with CPT1B elevated expression. (C) ATP luminescence assay showing differential ATP production in etomoxir-treated CSC MDA-MB-468, BBM2 and BBM3 tumorspheres compared to NCSC MDA-MB-468, BBM2 and BBM3 adherent cells. Shown are mean ± SD (n=3). (D) Cell proliferation of CSC and NCSC MDA-MB-468 cells after etomoxir treatments at the indicated concentrations. Shown are mean ± SD (n=3). (E) Limiting dilution assay demonstrating etomoxir impact on tumorsphere formation of BBM2 tumor cells (1 in 5.14 to 1 in 20.2 cells, p=9.26×10⁻⁹ with Χ2, n=18). (F) Flow cytometric analysis of the proportion of CD44high/Sca-1high cells in tumors harvested from MMTV-PyMT mice treated with PBS or 5mg/kg perhexiline. Shown are mean ± SD (n=4). (G) Real time PCR showing gene expression of SOX2 and ALDH1A1 in tumors harvested from MMTV-PyMT treated with PBS or 5 mg/kg perhexiline. Shown are mean ± SD (n=4).*p<0.05, **p<0.005, and ***p<0.0005
FAO requires the rate limiting enzyme CPT1 to transport lipids into the mitochondria (Carracedo et al., 2013). Of the three isoforms of CPT1, only CPT1 B was detected in BCSCs (Figure S2A). Immunofluorescent staining of CPT1B in conjunction with stem cell markers CD44 in human breast cancer tissue sections supported CPT1B/FAO enrichment in BCSCs (Figure 2B). While NCSCs exhibit a perinuclear mitochondria arrangement, BCSCs displayed a branched mitochondrial network which typically correlates with an oxidative cell phenotype (Figure S2D and E)(Rossignol et al., 2004). Furthermore, FAO inhibition with irreversible CPT1 inhibitor etomoxir significantly decreased ATP levels in BCSCs, but not in NCSCs (Figure 2C).
Etomoxir treatment decreased the cell viability in CSC MDA-MB-468 (Figure 2D) and in BBM2 and BBM3 tumorsphere (Figure S2B). Moreover, inhibiting FAO in BBM2 and BBM3 decreased their tumorsphere forming potential and the number of tumorsphere-initiating cells (Figure 2D, E and S2B). In contrast, the viability of NCSCs, which exhibit low FAO rates and minimal CPT1 gene expression, was only slightly affected by etomoxir treatment (Figure 2D). Treating spontaneously developed mammary tumors in Mouse Mammary Tumor Virus-Polyoma Virus Middle T antigen (MMTV-PyMT) mice with an FAO inhibitor perhexiline, reduced tumor weight (Figure S2C) and percentage of CD44high/Sca-1high mouse BCSCs within these tumors (Figure 2G). Ex vivo real-time PCR analysis of these tumors also indicated decreased expression of stem cells genes SOX2 and ALDH1A1 (Figure 2G).
STAT3 Inhibition Attenuates FAO in BCSCs
We next tested whether STAT3 directly modulates BCSC transcriptome important for FAO. Knocking down STAT3 in BCSCs reduced expression of genes involved in various metabolic pathways including FAO (Figure 3B). STAT3 silencing by siRNA in BBM2 tumorspheres, CSC MDA-MB-468, and breast epithelial MCF10A cells (cultured in the presence of insulin and epidermal growth factor, which activate STAT3 (Vultur et al., 2004)) diminished FAO (oxidation of 3H-labeled palmitic acid) (Figure 3C). Knocking down STAT3 also reduced ATP production in MCF10A cells while increasing the ADP/ATP ratio (Figure 3D).
Figure 3. Inhibiting JAK/STAT3 Attenuates FAO and Decreases BCSC Self-Renewal.

(A) FAO assay comparing levels of FAO in DMSO and 1µM AZD1480-treated BBM2 and BBM3 tumorspheres. Shown are mean ± SD (n=3). (B) Real-time PCR showing the effects of STAT3 siRNA on lipid metabolic genes in BBM2 tumorspheres. Shown are mean ± SD (n=3). (C) Comparison of FAO rates in CSC MDA-MB-468, BBM2 tumorspheres, and MCF-10A cells treated with control siRNA vs. STAT3 siRNA. Shown are mean ± SD (n=3). (D) Relative ATP and ADP/ATP ratio in MCF-10A cells after control or STAT3 siRNA treatment. Shown are mean ± SD (n=4). (E) BODIPY 493/503 staining showing effect of STAT3 siRNA on lipid droplets in CSC MDA-MB-468 cells. The fluorescence intensity was quantified and shown on the right side. (F) Cell survival assay of CSC MDA-MB-468 cells or tumorsphere formation of BBM2 tumor cells after indicated treatments. Shown are mean ± SD (n=4). (G) Tumorsphere formation of BBM2 after indicated treatments of 1µM AZD1480 or/and 5µM Bezafibrate. Shown are mean ± SD (n=3).*p<0.05, **p<0.005, and ***p<0.0005
Inhibition of fatty acid catabolism typically causes lipid accumulation in the cytoplasm in the form of adiposomes due to decreased fatty acid utilization (Wang et al., 2014a). Consistently, we observed accumulation of adiposomes in BCSCs upon STAT3 silencing (Figure 3E). We tested whether the replacement of acetyl-CoA can rescue the reduced self-renewal potential of STAT3-ablated BCSCs. Blocking STAT3 in BCSCs inhibited self-renewal, whereas addition of acetyl-CoA (1 µM) into CSC MDA-MB-468 cells transfected with STAT3 siRNA rescued their survival (Figure 3F and S2F) as well as BBM2 tumorsphere formation ability (Figure 3G). In addition, stimulating FAO with agonist, bezafibrate, also rescued BBM2 tumorsphere formation ability of STAT3-inhibited cells (Figure 3G).
STAT3 Promotes FAO by Regulating CPT1B Transcription
Silencing STAT3 with siRNA decreased CPT1B mRNA levels in BBM2 tumorspheres and CSC MDA-MB-468 cells with no compensation from other isoforms, CPT1A and C (Figure 4A). Chromatin immunoprecipitation (ChIP) assay revealed that STAT3 regulated CPT1B expression in BCSCs by directly binding to the CPT1B promoter (Figure 4B). Furthermore, STAT3 siRNA significantly downregulated while constitutively-activated STAT3 (STAT3C) upregulated CPT1B promoter-driven luciferase activity (Figure 4C). Silencing STAT3 reduced CPT1B protein expression in CSC MDA-MB-468 cells and BBM2 tumorspheres (Figure 4D and –E), leading to diminished CPT1B enzymatic activity (Figure 4F). We further confirmed the role of STAT3 in FAO and CPT1B regulation by supplementing BBM2 tumorspheres with medium-chain fatty acid, myristic acid (MA), which bypasses CPT1B to be metabolized in the mitochondria. Addition of MA reversed the inhibition of BBM2 tumorsphere formation induced by JAK inhibitor AZD1480 (Figure 4G).
Figure 4. STAT3 Modulates FAO through Transcriptional Regulation of CPT1B.

(A) Real time PCR measuring CPT1A, CPT1B, and CPT1C mRNA levels in BBM2 tumorspheres and CSC MDA-MB-468 cells transfected with control or STAT3 siRNA. Shown are mean ± SD (n=3). (B) ChIP assay showing STAT3 binding to the CPT1B promoter in BBM2 tumorspheres. The results were normalized to input DNA. Shown are mean ± SD (n=3). (C) CPT1B promoterluciferase assay was measured in MDA-MB-468 and −231 breast cancer cells 24 hours after control or STAT3 siRNA transfection. Constitutively activated STAT3 (STAT3C) was used as a positive control. The luciferase activity was then normalized with control siRNA transfection. (D) Immunofluorescent images of CPT1B levels in CSC MDA-MB-468 cells transfected with control or STAT3 siRNA. White bar presents 10 µm. The fluorescence intensity was quantified and shown on the right side. (E) Western blotting measuring CPT1B and STAT3 protein levels in BBM2 tumorspheres transfected with control siRNA or STAT3 siRNA. β-actin was detected as a loading control. (F) Measurement of relative radioactivity (per µg protein) showing effects of STAT3 siRNA on CPT1 enzyme activity in CSC MDA-MB-468 cells and BBM2 tumorspheres. Shown are mean ± SD (n=3). (G) Tumorsphere formation of BBM2 tumorspheres treated with 1 uM AZD1480 or 5 µM myristic acid (MA). Shown are mean ± SD (n=3).*p<0.05, **p<0.005, and ***p<0.0005
Mammary Adipocyte-Derived Leptin Is Critical for BCSC STAT3-FAO Pathway
Aberrant lipogenesis and lipid accumulation are frequently observed in breast tumors and contribute to increased capacity for catabolic FAO (Baumann et al., 2013; Bozza and Viola, 2010; Zhou et al., 2003). However, lipid droplet staining of BCSCs showed minimal lipid content (Figure 3E), suggesting that FAO in BCSCs may require exogenous lipid supplies for oxidation substrates. We tested whether BCSCs can uptake FAO substrates from the fat-laden breast tumor environment to drive self-renewal and proliferation. Supplementing BCSC media with BSA-conjugated palmitic acid (PA) increased BCSC proliferation, while etomoxir reversed the increased proliferation (Figure S3A). Furthermore, conditioned medium (CM) from in vivo differentiated human-derived breast adipocytes (Figure S3B) also increased proliferation of BBM2 tumorspheres (Figure S3C). Migration assay using human breast adipose CM indicated that BBM2 and BBM3 tumorspheres show tropism toward adipose-derived factors (Figure S3D). We next investigated if BBM2 tumorspheres could uptake lipids directly from the surrounding adipose tissue. We co-cultured BBM2 tumorspheres with human-derived breast adipocytes loaded with fluorescent PA (BODIPY-C16). During co-culturing, fluorescent lipids were transferred from adipocytes to BCSCs, indicating that adipocytes can serve as a reservoir of lipids to BCSCs (Figure S3E). In addition, sulfosuccinimidyl oleate sodium (SSO) treatment decreased fluorescent lipid uptake by BBM2 (Figure S3E), suggesting that the specific fatty acid transfer occurs rather than cell fusion. SSO has been shown to inhibit fatty acid translocase (FAT/CD36). At 200 µM it can block uptake of long chain fatty acid by approximately 65% in cultured adipocytes (Abumrad et al., 1993; Harmon et al., 1991). Even though PA transporter has not been well characterized, the only protein located at the plasma membrane consistently shown to enhance fatty acid uptake is CD36(Krammer et al., 2011). Co-culturing BCSCs with mature adipocytes but not pre-adipocyte stimulated STAT3 phosphorylation (p-STAT3) in BBM2 tumorspheres (Figure 5A). In addition, fatty acid uptake by BCSCs by co-culturing with adipocytes induced CPT1B and STAT3 upregulation in BCSCs (Figure S3F).
Figure 5. Adipocyte-Derived Leptin Activates STAT3-CPT1B to Drive FAO in BCSCs.

(A) Western blot showing increased phosphorylation of STAT3 at Y705 (pSTAT3) in BBM2 tumorspheres after co-culture with human breast adipocytes or pre-adipocyte. BBM2 culture alone was used as control. (B) Adipokine array identifying adipokines in supernatant from human breast adipocytes. Right, table listing the most highly secreted adipokines. (C) Real-time PCR measuring LEPR mRNA levels in BBM2 and BBM3 tumorspheres (CSC) vs. adherent cells (NCSC). LEPR expression of CSC was then normalized with NCSC. Shown are mean ± SD (n=3). (D) Western blot showing increases in phosphorylation of JAK2 (pJAK2) and STAT3 (pSTAT3) in BBM2 tumorspheres upon leptin stimulation with the indicated conditions. (E) Tumorsphere formation of BBM2 cells treated with leptin at the indicated concentrations. Shown are mean ± SD (n=3). (F) Real-time PCR comparing expression of CPT1B and ACADM in BBM2 tumorspheres cultured with or without human breast adipocytes, treated with leptin neutralizing antibody (α-Leptin) or 1µM AZD1480. Shown are mean ± SD (n=3). (G) Tumor weights of tumors collected from multiple sites in MMTV-PyMT mice treated with PBS or α-Leptin (250 µg/kg). Shown are mean ± SD (n=4). (H) Flow cytometric analyses of single-cell suspensions prepared from tumors collected from MMTV-PyMT mice treated with PBS or α-Leptin (250 µg/kg). Shown are mean ± SD (n=4). (I) Expression of Leptin receptor and CPT1B in primary and resistant TNBC tumors. FFPE tissue sections from TNBC patients were stained by immunofluorescence for Leptin receptor (red) and CPT1B (green); nuclei were counterstained with Hoechst (blue).*p<0.05, **p<0.005, and ***p<0.0005.
We next performed an adipokine array on breast adipocyte-conditioned medium. Of the 58 adipokines tested, the most abundantly expressed were pentraxin-3, leptin, adipsin, insulin-like growth factor-binding proteins (IGFBP) 3 and 4, chemokine (C-C motif) ligand 2(CCL2) and interleukin 8 (IL-8) (Figure 5B). To assess which adipokine(s) might be critical for activating STAT3 in BCSCs, qRT-PCR and flow cytometry were performed to detect the expression of the receptors of the identified adipokines inBBM2 and BBM3 tumorspheres. The results showed that only leptin receptor (LEPR) expression was elevated in BBM2 and BBM3 tumorspheres (Figure 5C and S4). Among them, LEPR has been shown to maintain BCSC-like and metastatic properties (Feldman et al., 2012; Han et al., 2013), and leptin can stimulate JAK2 and STAT3 phosphorylation in BCSCs. Consistent with a homeostatic role of leptin signaling in BCSCs, BBM2 tumorpheres treated with BSA and leptin showed an increased level of phosphorylated JAK2 and STAT3 (Figure 5D). Furthermore, supplementing culture media with BSA-leptin increased tumorsphere formation (Figure 5E). Leptin neutralizing antibody (α-leptin) in media reversed the induction of FAO enzymes CPT1B and ACADM (Figure 5F). AZD1480 also lowered the induction of FAO in BCSCs (Figure 5F). Consistently, MMTV-PyMT mice treated with α-leptin reduced breast tumor development. Ex vivo flow cytometric analyses of the excised tumors showed that α-leptin treatments decreased the percentage of Cd44high/Sca-1high BCSCs in the breast tumors (Figure 5G and H). Recently, CSCs have been shown to play a critical role in cancer pathogenesis and chemoresistance (Han et al., 2013; Shafee et al., 2008). In addition to our finding that CD44 CSC marker co-expresses with CPT1B in breast cancer patient tumors (Figure 2B), we found that LEPR expression was higher in the chemoresistant metastatic breast tumor sections and that LEPR -positive cells had elevated expression of CPT1B (Figure 5I).
STAT3-CPT1B-FAO Pathway Promotes Breast Cancer and Chemoresistance
To further determine whether JAK/STAT3-CPT1B and its downstream FAO influence clinical outcome in human breast cancers, we identified several annotated breast tumor data sets in which we could compare CPT1B expression in normal versus tumor specimens and from patients with different outcomes and chemotherapeutic responses. Specifically, we compared the expression profiles of invasive breast carcinoma tissues (from 56 patients) with normal breast tissues (6 patients). We also compared the expression profiles in primary breast tumors from patients whose tumors recurred (11 patients) and those who did not (8 patients) within 5 years. We found that CPT1B expression is elevated in breast carcinomas compared to normal breast tissues in several data sets (Figure 6A, S5A and B). Importantly, CPT1B expression levels were amplified in the breast tumor tissues upon disease recurrence (Figure 6B) and correlated with poor outcome (Figure S5C). CPT1B was also significantly adversely associated with therapeutic response of breast cancer patients (Figure 6C). Consistently, CPT1B and STAT3 mRNA levels were higher in ex vivo cultured breast cancer biopsies derived from post-chemotherapy (resistant) triple negative breast cancer (TNBC) tumors compared to pre-chemotherapy tumor tissues (primary)(Figure 6D). To test whether aberrant expression of CPT1B driven by FAO in BCSCs is a key contributing factor for refractory breast cancer, chemoresistant MDA-MB-231 TNBC cell line was generated by serial passage in media supplemented with paclitaxel. Consistent with our Oncomine data analyses, mRNA levels of CPT1B and FAO enzyme ACADM were significantly elevated in paclitaxel-resistant MDA-MB 231 cells (231-R) compared to their parental cells (231-P) (Figure 6E). Moreover, expression of stem cell markers MSI1 and OCT4, tumorsphere-forming ability as well as FAO rate were significantly increased in chemoresistant TNBC cells (Figure 6F–I). To further validate our finding in more clinical relevant setting, we compared protein expression of CPT1B and CD44 in 6 pairs of patient biopsies before and after developing chemoresistance. We detected higher expression levels of CD44, which are positive also for CPT1B, in the chemoresistant tumor sections when compared to their counterparts prior to paclitaxel treatment (Figure 6J).
Figure 6. STAT3-CPT1B Mediated FAO Pathway Promotes Chemoresistance.

(A, B) Oncomine analyses of the Finak§ breast cancer data set comparing relative CPT1B mRNA expression in normal breast tissues and breast carcinoma tissues and tumors from patients with recurrence and no recurrence within 5 years. (C) Oncomine analysis of Gluck§ breast cancer dataset of CPT1B mRNA expression in breast tumors from patients with no, partial, near complete, and complete response to paclitaxeltaxol chemotherapy. (D) Real time PCR to assess CPT1B and STAT3 gene expression in ex vivo cultured breast cancer biopsies collected before (primary) and after chemotherapy (resistant). (E) Real time PCR measuring CPT1B and ACADM gene expression in 231-P (parental) and 231-R (resistant) cells. Shown are mean ± SD (n=3). The results were normalized with GAPDH expression. (F) Real time PCR comparing gene expression of MSI1 and OCT4 in 231-P and 231-R cells. Shown are mean ± SD (n=3). The results were normalized with GAPDH expression. (G) Limiting dilution assay comparing tumorsphere forming ability of 231-P and 231-R cells (1 in 13.56 to 1 in 2.24 cells, p=1.26×10⁻¹⁶ with Χ2, n=18). (H) Immunofluorescent images comparing protein levels of CPT1B and pSTAT3 in 231-P and 231-R cells. Right, quantification of relative fluorescence intensities of CPT1B and STAT3. Shown are mean ± SD (n≥5). (I) Comparison of FAO rates between 231-P and -R cells. Shown are mean ± SD (n=3). (J) Expression of CD44 and CPT1B in primary and resistant TNBC tumors. FFPE tissue sections from TNBC patients were stained by immunofluorescence for CD44 (red) and CPT1B (green); nuclei were counterstained with Hoechst (blue). §Databases are named after the first author of originally published data. *p<0.05, **p<0.005, and ***p<0.0005.
Untargeted metabolomic analyses further confirm that FAO metabolites are enriched in chemoresistant breast tumor cells. Such analyses revealed differences in integral FAO metabolites in chemoresistant 231-R vs. 231-P parental breast tumor cells (Figure 7A). In particular, we detected elevated levels of acylcarnitines, including CPT1-mediated acylcarnitine-C16:0, and carnitine-shuttle pathway intermediates in 231-R relative to 231-P cells, consistent with increased FAO in the chemoresistant TNBC cells (Figure 7A Lower left panels). Comparisons of major structural lipids between the cell line pairs indicated higher levels of lysophospholipids, phospholipids and sphingolipids and lower levels of triacylglycerols and cholesterol esters in the chemoresistant TNBC cells (Figure S6A).
Figure 7. Metabolomic Analyses Reveal an FAO Signature in Drug-Resistant Tumor Cells.

(A) Heatmap depicting abundances of detected FAO- and carnitine-shuttle pathway-related metabolites in chemoresistant 231-R and parental 231-P TNBC cell lines. Values were autoscaled; clustering was conducted using Euclidean Distance and Ward’s method. Fold-change in glycerophosphoethanolamine abundance (B) and carnitine/acetylcarnitine levels (C) following 2, 4 or 6 hours of paclitaxel challenge in 231-R and -P TNBC cell lines relative to respective time-matched vehicle (DMSO) controls. P-value represents differences in the area under the curve between 231-R and -P cells. * p<0.05. (D) Cell survival assay showing perhexilline sensitizes 231-R cells to paclitaxel. Shown are mean ± SD (n=4). (E) Schematic of how JAK/STAT3 activates FAO in BCSCs through intrinsic and extrinsic pathways.
To further confirm an enhanced FAO-dominant metabolic state in the resistant tumor cells, especially during drug treatment, we interrogated the dynamics of acute metabolic changes in 231-R and 231-P cells 2, 4 and 6 hours after initiation of paclitaxel treatment and compared these changes against respective time-matched vehicle controls. Chemoresistant 231-R cells exhibited acute increases in lysophospholipids, namely lysophosphatidylethanolamines (LPE), within the first 2 hours of paclitaxel treatment, after which LPE levels decreased (Figure S6B). LPEs are derived from the hydrolytic cleavage of fatty acid residues at the sn-2 position of phosphatidylethanolamines (PE), thereby releasing the fatty acid (Figure S6B). In addition, our metabolomic analyses indicated an accumulation of glycerophosphoethanolamine (a downstream degradation product of LPEs) in 231-R cells with 4 hours post-paclitaxel treatment, indicating the greatest increase relative to time-matched vehicle control (Figure 7B). The 231-R-associated elevation in glycerophosphoethanolamine and reduction in LPEs during the initial 4 hours of paclitaxel treatment implies a secondary hydrolysis of the fatty acid on the sn-1 position of the LPEs (Figure 7B and S7). The transfer of long-chain fatty acids (LCFA) into the mitochondrial matrix for FAO is highly reliant upon the carnitine shuttle pathway. Our findings indicate that carnitine and acetylcarnitine levels increase in 231-R cells acutely in response to paclitaxel treatment, suggesting an increased rate of LCFA-CoA transfer for FAO (Figure 7C and S7).
To investigate this notion and further define the contribution of FAO to paclitaxel-acquired resistance, chemoresistant 231-R TNBC cells were treated with paclitaxel in combination with FAO inhibitor perhexiline (Figure 7D). Although single-agent treatment of TNBC cells with paclitaxel or perhexiline showed minimal efficacy against TNBC cells, combinatorial regimens with both agents significantly decreased 231-R cell viability (Figure 7D), suggesting that perhexiline can sensitize drug-resistant breast cancer cells to chemotherapy.
DISCUSSION
Our study identifies a novel leptin-LEPR-JAK-STAT3-dependent FAO pathway as critical for BCSC self-renewal that is associated with breast cancer chemoresistance (Figure 7E). The induction of FAO may provide several metabolic advantages for BCSC maintenance: FAO products NADH and FADH2 counteract reactive oxygen species accumulation to reduce oxidative stress and increase ATP production as electron carriers of the electron transport chain (Carracedo et al., 2013). Acetyl-CoA serves as the intersection to many metabolic pathways and contributes to fatty acid synthesis, TCA cycle, and protein acetylation (Comerford et al., 2014; Yoshii et al., 2015). Of relevance, our study demonstrates the requirement of acetyl-CoA in maintaining BCSC survival. Importantly, protein acetylation is a prevalent modification in metabolic enzymes. Zhao et al. found nearly every enzyme in glycolysis, gluconeogensis, TCA cycle, and fatty acid metabolism was acetylated in human liver tissue. Protein acetylation levels also corresponded to enzyme activity (Zhao et al., 2010). This suggests that acetyl-CoA deprivation can depress the entire metabolic acetylome suspending the metabolic processes required for BCSC proliferation and survival.
In addition to our findings that FAO is required for the maintenance of BCSCs and contributes to chemresistance, other studies showed the importance of FAO in cancer progression/metastasis. FAO has been implicated to be necessary to prevent anoikis associated with detachment from the extracellular matrix and anchorage independent growth, an event necessary for metastasis (Carracedo et al., 2012). Recently, a critical role of FAO in mediating c-Myc-overexpressed TNBC oncogenicity has been demonstrated (Camarda et al., 2016). These results suggest that FAO contributes to cancer progression in multiple ways.
Recent publications have reported FAO to be important for maintenance of hematopoietic stem cell (HSC) and CD8+ memory T cells, which exhibit some stem cell phenotype (Gattinoni et al., 2011; Ito et al., 2012; Lugli et al., 2013). FAO inhibition in T cells prevents differentiation toward the memory T cell lineage (Lochner et al., 2015; Priyadharshini and Turka, 2015), and FAO inhibition in HSCs leads to eventual population depletion (Ito et al., 2012). In contrast, rapidly dividing effector T cells and cancer cells preferentially upregulate glycolysis to sustain the high anabolic needs of proliferating cells (Lochner et al., 2015; Priyadharshini and Turka, 2015). These data suggest that FAO is favorable for sustaining homeostatic survival rather than rapid proliferation, suggesting a need of BCSCs for cell maintenance rather than rapid expansion. Coincidentally, STAT3 has also been reported to be critical for the development of memory T cells in viral infectious models; STAT3 steers naïve T cells away from the effector phenotype (Cui et al., 2011; Siegel et al., 2011). Whether STAT3 and FAO contribute to memory T cell maintenance in the setting of tumor development and obesity remains to be determined. We show that STAT3 transcriptionally upregulates the FAO rate limiting enzyme CPT1B, which may link the requirement of FAO with STAT3 in T cell development. More recently, however, deprivation of glycolysis in the tumor microenvironment due to rapidly proliferating tumor cells metabolically restricts T cell effector (TEFF) functions (Chang et al., 2015; Ho et al., 2015). Glycolysis by TEFF cells is necessary for IFNγ production and upregulating of its inducible Th1 immune mediators (Cham et al., 2008; Chang et al., 2013; Maciolek et al., 2014). A paradoxical observation initially described by our group that is validated by numerous studies is that STAT3, though a well-known transcription activator, is capable of inhibiting IFNγ and many Th1 mediators in the tumor microenvironment (Herrmann et al., 2010; Kortylewski et al., 2005; Kortylewski et al., 2009; Yue et al., 2015). Another project in our group based on the role of STAT3 in activating FAO pathway in BCSCs demonstrated a critical role of leptin-STAT3-FAO pathway in CD8+ TEFF cells in inhibiting glycolysis and Th1 antitumor immunity in breast cancer. Inhibiting STAT3 or FAO promotes CD8+ TEFF cell glycolysis, Th1 antitumor immunity and reduces breast tumor development. Although our in vivo studies in MMTV-PyMT mice using a FAO inhibitor showed a reduction of tumor growth and numbers of CSCs, we cannot rule out the possibility that the decrease in CSCs was contributed by the effects of the FAO inhibitor on the tumor microenvironment. Further in vivo experiments using patient CSC expressing CPT1b shRNA are required to formally demonstrate that targeting CPT1B/FAO reduces CSCs without impact from the tumor microenvironment. Nevertheless, our extensive data performed in the absence of tumor stromal cells clearly demonstrate an important role of STAT3-CPT1B/FAO intrinsic to BCSCs for self-renewal and for breast cancer chemoresistance.
When we probed Oncomine for clinical outcomes related to CPT1B expression, we found that elevated CPT1B expression correlated with poorer response to chemotherapy. Indeed, we find enhanced FAO is a characteristic of chemoresistant breast cancer cells, which can be sensitized to chemotherapy if FAO is inhibited by perhexiline. FAO has recently been shown to contribute to mitochondrial spare respiratory capacity (SRC), the extra capacity in cells to produce energy under conditions of increased stress (van der Windt et al., 2012). As such, SRC is tightly associated with cell survival in conditions of chemotherapeutic stress. Furthermore, elevated SRC have been linked to resistance to both radiation and chemotherapy (Oliva et al., 2010; Vlashi et al., 2011). This suggests that the source of chemoresistance in breast cancer maybe FAO-induced elevation in SRC. These studies raise the possibility for concurrent use of FAO inhibitors with chemotherapy to reduce excess SRC. Perhexiline, the FAO inhibitor used in this study, is approved for use in Australia and Asia for angina, but long-term use often leads to liver toxicity (Hay and Gwynne, 1983). However, short-term use in combination with chemotherapy may not generate such side effects. Our findings identify potential metabolic targets to be tested in novel treatment trials as strategies to overcome breast cancer stem-cell associated chemoresistance.
Contact for Reagent and Resource Sharing
Further information and requests for resources and reagents should be directed to the lead contact, Dr. Hua Yu (hyu@coh.org)
Experimental Model and Subject Details
Cell Lines
Female breast epithelial cell line MCF10A was cultured in DMEM/F12 supplemented with 5% horse serum, 20 ng/mL EGF, 0.5 mg/ml hyfrocortisone, 10 µg/mL insulin and 100 ng/mL cholera toxin. Female breast cancer cell lines MCF7, BBM2, and BBM3 tumorspheres were cultured in DMEM/F12 supplemented with 2% B27 (Life Technologies), 20 ng/mL hEGF, 20 ng/mL hFGF2 (Peprotech), and heparin. All adherent cell lines were cultured in 10% FBS in DMEM. All cultures were supplemented with 10µg/mL gentamicin. BBM2 and BBM3 tumor spheres were dissociated with collaganase and DNAse for several hoursat 37°C and plated and maintained in 20% FBS in DMEM for at least 5 passages. Primary female human preadipocytes were purchased from Zen-Bio, cultured in preadipocyte medium until 80% confluence and differentiated with differentiation medium for at least 2 weeks as established by the manufacturer. All media was purchased from Zen-Bio. Female breast cancer cell lines MB231-P, Hs578T, MB436, HCC1500 and BT20 were grown in DMEM (Gibco) containing 10% FBS where as MB231-R was grown in DMEM containing 10% FBS plus 50 nM paclitaxel (Sigma Aldrich).
Patient Tumor Specimens
Female breast cancer patient specimens were obtained through a City of Hope Institutional Review Board approved protocol with voluntary patient consent. 10 female patients with triple negative breast cancer (TNBC) with ages between 45 and 79 (stage 1 to 4). Each pair of tumor specimens (primary and recurrent) was obtained from the same patient. Clinical and pathologic data were retrieved from medical records under institutionally approved protocols (IRB#09139 at City of Hope). Samples were de-identified to protect patient confidentiality. Paraffin-embedded tissue were obtained from breast tumor resections and prepared as 4 µm sections on unstained slides for subsequence analysis.
Mice
MMTV-PyMT (PyMT) female mice were purchased from the Jackson Laboratory. Mouse care and experimental procedures were performed in accordance with established institutional guidance and approved protocols from Institutional Animal Care and Use Committee at the Beckman Research Institute of City of Hope National Medical Center. For some studies, mice were housed in a controlled environment (12-h light/12-h dark cycle) with access to water and fed a High Fat Diet (HFD, 60 kcal % fat; Research Diets D12492) generally from 6 to 8 weeks of age, to induce tumor formation. Body weight was measured weekly and food intake was monitored.
Method Details
ATP Measurement and Etomoxir Treatment
For Etomoxir treatment, 5,000 cells were seeded in a well of 96-well plate with 1% FBS/DMEM overnight. Etomoxir was then added at the indicated concentration. In ATP measurement experiment, cells were treated as the indicated conditions overnight.
Tumorsphere Formation Assay
Tumorsphere formation was conducted by subculturing BBM2 and BBM3 cells in tumorsphere media. Cell culture was performed in 12-well plates (Corning). Accutase (Millipore) was used to dissociate tumorspheres into single cells. One thousand cells were plated, and tumorspheres were counted after 6 days. Leptin and acetyl-CoA were purchased from BD Pharmingen and Sigma Aldrich, respectively. BSA was added to leptin at 0.1% as carrier protein before supplementing to culture media. RNAi against human STAT3 was introduced using RNAi MAX (Life Technologies) according to manufacturer’s instructions. BSA and BSA-conjugated palmitic acid was purchased from Seahorse Biosciences. Myristic acid was purchased from Sigma Aldrich.
Limiting Dilution Assay
Cells were cultured for 2 weeks in tumorsphere-forming media. After dissociating spheres into single cells, cells were serially diluted from 500 to 2 cells per well into a 96-well plate in 18 replicates. Fresh media, hEGF and hFGF2 were replenished every 3 days. Frequency of wells containing tumorspheres was counted. Data was analyzed using the Extreme Limiting Dilution Algorithm (http://bioinf.wehi.edu.au/software/elda/).
Immunostaining (IF)
Formalin-fixed paraffin-embedded (FFPE) breast tumor sections were de-paraffinized and dehydrated through xylene and ethanol series, followed by antigen retrieval in sodium citrate buffer, pH 6.0. After blocking with normal goat serum for 30 min, the sections were stained with antibodies for CD44 (Cell Signaling), Leptin Receptor (Sigma) and CPT1B (Abcam), followed by incubation with secondary antibodies (Alexa Fluor 488 and Alexa Fluor 555, Invitrogen). Sections were counterstained with Hoechst 33342, mounted and imaged using the Zeiss LSM700 confocal microscope.
CPT1B Promoter Reporter Assay
CPT1B promoter was cloned by PCR amplification of 1 kb up- and down-stream of chr22:51,017,100. The primers are listed in the above table. The promoter region of CPT1B was then sub-cloned into pGL 3.1 luciferase reporter vector. MDA-MB-468 and MDA-MB-231 cells were co-transfected with pGL 3.1-CPT1B, pRL-TK vectors and STAT3 siRNA or constitutively active STAT3 overexpressing construct (STAT3C) using lipofectamine 2000. Twenty four hours after transfection, cells were harvested and analyzed using Dual-Luciferase Reporter Assay System (Promega) according to manufacturer’s instruction.
Real-Time PCR
Total mRNA was extracted from cells using RNeasy Plus RNA isolation kit (Qiagen) as per the manufacturer's protocol. Total RNAs were converted to cDNA by using iScript cDNA Synthesis Kit (Bio-Rad) according to manufacturer’s protocol. Real-time PCR was performed using a CFX Connect Real-Time PCR Detection System (Bio-Rad). For real-time PCR of gene expression, the 20 µl PCR included 1 µL cDNA, 1× iQ SYBR Green Supermix (Bio-Rad) and 1 µl of 10 µM of primer mix. The primers for the qPCR are listed in Supplemental Table S1. The reactions were incubated in a 96-well optical plate at 95°C f or 3 min, followed by 40 to 45 cycles of 95°C for 15 s and 60° for 30 s. The ΔCt was determinate using default threshold settings. The threshold cycle (Ct) is defined as the fractional cycle number at which the fluorescence passes the fixed threshold. The relative fold change was measured by the ΔΔ(CT) method between each treatments and the average of the control samples in expression.
Fatty Acid Oxidation Assay
The experiment procedures were performed as a previous study (Djouadi et al., 2003). In brief, at least 100,000 cells were seeded and treated with 1µM AZD1480, human control or STAT3 siRNA for 24h. For the oxidation assay, cultured cell layers or tumorspheres were washed three times with HBSS. Then, 200µLof [3H]-palmitic acid (1 mCi/mL, PerkinElmer Inc) bound to fatty-acid free albumin (100 µM; the ratio of palmitate:albumin is 2:1) and 1 mM l-carnitine were added to each well. Incubation was carried out for 2h at 37°C. After incubation, the media was collected and added to a tube containing 200 µLof cold 10% trichloroacetic acid. The tubes were centrifuged 10 min at 3,000g at 4°C and aliquots of supernatants (350 µL) were removed, neutralized with 55 µL of 6N NaOH, and applied to an ion exchange column loaded with Dowex 1×2 chloride form resin (Sigma Aldrich). The radioactive product was eluted with water. Flow-through was collected and radiation was quantified using liquid scintillation counting. Radiation count was normalized to amount of protein, as quantified by BCA assay (Pierce).
Chromatin Immunoprecipitation Assay
ChIP assay was performed using Imprint Chromatin-Immunoprecipitation kit (Sigma) following manufacturer’s instructions. Chromatin was prepared from 3×10⁶ BBM2 tumorspheres and immunoprecipitated using 4 µg of anti-STAT3 rabbit polyclonal antibody (Santa Cruz) or rabbit IgG. The primers listed above were used to amplify the human CPT1B promoter region that contained the putative STAT3-binding sites as suggested by TRANSFAC software and SA Biosciences. STAT3 binding site sequence for CPT1B is 5’-GGGCTCCTACCCGGAAGTGAGC-3’. The relative amount of precipitated DNA were quantified by real time PCR and normalized to input DNA.
CPT1 Enzyme Assay
CPT1 enzyme assay was carried out as previously described (Guzman and Geelen, 1992). BCSCs were seeded in 24-well plates overnight. Cells were treated with human control or STAT3 siRNA for 24h. Cells were washed once with 150 mM NaCl. Cells were treated with medium containing 50 mM imidazle, 70 mM KCl, 80 mM sucrose, 1 mM EGTA, 0.1% fatty acid-free BSA, 2 mM MgCl2, 1 mM ATP, 70µM palmitoyl-CoA, 50 µg/mL digitonin, 0.5 mM 3H-L-carnitine, and 1 mM DTT at 37°C for 3 minutes. Reaction was stopped by adding 1M cold HCl. Cells were harvested with Accutase (Millipore) and pelleted. Pellet was washed once with 2 mM PCA, pelleted, and resuspended in water. Lipids were extracted with butanol and radiation was quantified using liquid scintillation counting.
In Vivo Experiments
MMTV-PyMT mice were fed on high fat diet (HFD, 60% kcal fat, Research Diets D12492) from 8–10 weeks of age followed by treatment with PBS or perhexiline (5 mg/kg) from day 120 when tumors were not palpable once every two days for three weeks. For leptin neutralizing experiments, mice were treated were treated with PBS or anti-mLeptin (R&D, 250 µg/kg) once every two days for three weeks. Mice were humanely euthanized and tumors were harvested for weight measurements and single-cell suspensions from tumors were analyzed by flow cytometry.
Cell Culture for Metabolomics
For metabolomic analysis of Hs578T, MB436, HCC1500 and BT20, cells were seeded at 50–60% confluency in 6 cm dishes in DMEM containing 10% FBS and allowed to adhere overnight. The following day, cells were washed twice with DMEM containing 0.1% FBS and cell lysates collected for metabolomic analysis. All experiments were performed in biological duplicate or triplicate.
For analysis of MDA-MB231-P and MDA-MB231-R lysates before and after challenge with paclitaxel, cells were seeded and washed as mentioned above followed by the addition of either DMEM containing 0.1% FBS plus 5 nM paclitaxel (231-P) or 50 nM paclitaxel (231-R) or DMEM containing 0.1% FBS plus vehicle (DMSO). Cell lysates were collected directly after washing (baseline) and 2, 4 and 6 hours post challenge with either paclitaxel or vehicle. All experiments were performed in biological triplicate.
Metabolomics
Cell lysates were washed 2× with pre-chilled 0.9% NaCl followed by addition of 1 mL of prechilled extraction buffer (3:1 isopropanol:ultrapure water) to quench and remove cell media. Cells were then scraped in extraction solvent and transferred to a 1.5 mL eppendorf tube. After vortexing briefly, the extracted cell lysates were centrifuged at 4°C for 10 min at 2,000×g. Thereafter, 1 mL of the supernatant containing the extracted metabolites were transferred to eppendorf tubes. 100 µL of Cell lysate supernatant was aliquoted into two 96-well plates (Eppendorf) and evaporated to dryness under vacuum. The samples were then reconstituted as follows: for the HILIC assays, the dried samples were dissolved in 65 µL of ACN (Fisher Scientific): 100 mM Ammonium Formate pH3 (9:1) whereas for the reverse phase C18 assays, the dried samples were dissolved in 65 µL of H2O: 100 mM ammonium formate pH3 (9:1). The samples were then spun down to remove any insoluble materials and transferred to a 384-well plate for high throughput analysis using LCMS. For Complex Lipids sample preparation, 10µL supernatant of the extracted cell lysate metabolites was diluted with 90 µL of 1:3:2 100 mM ammonium formate, pH3: acetonitrile: 2-propanol (Fisher Scientific) and transferred to a 384-well microplate (Eppendorf) for analysis using LCMS. Untargeted metabolomics analysis was conducted on Waters Acquity UPLC system with 2D column regeneration configuration coupled to a Xevo G2-XS quadrupole time-of-flight (qTOF) mass spectrometer. Chromatographic separation was performed using HILIC (Acquity™ UPLC BEH amide, 100 Å, 1.7 µm 2.1× 100 mm, Waters Corporation, Milford, U.S.A) and C18 (Acquity™ UPLC HSS T3, 100 Å, 1.8 µm, 2.1×100 mm, Water Corporation, Milford, U.S.A) columns at 45°C. Quaternary solvent system mobile phases were (A) 0.1% formic acid in water, (B) 0.1% formic acid in acetonitrile and (D) 100 mM ammonium formate, pH 3. Samples were separated using the following gradient profile: for the HILIC separation a starting gradient of 95% B and 5% D was increased linearly to 70% A, 25% B and 5% D over a 5 min period at 0.4 mL/min flow rate, these final conditions were maintained for 1 min at 0.4 mL/min flow rate. For reverse phase C18 separation, a chromatography gradient was started at 100% A, and linearly increased to final conditions of 5% A, 95% B at 5 mL/min, followed by isocratic gradient at the final conditions for 1 min at 5 mL/min. The solvent system mobile phases were (A1) 100 mM ammonium formate, pH 3, (A2) 0.1 % formic in 2-propanol and (B1) 0.1 % formic acid in acetonitrile. The HILIC column was stripped using 95% A1 for 2 min followed by 5 min equilibration using 5% A1, 95% B1 at 0.4 mL/min flow rate. Reverse phase C18 column was striped using 90% A2 for 5 min at 0.2 mL/min, followed by column 2 min equilibration using 100% B1 at 0.3 mL/min. Lipidomic assay, untargeted metabolomics analysis was conducted on a Waters Acquity™ UPLC system coupled to a Xevo G2-XS quadrupole qTOF mass spectrometer. Chromatographic separation was performed using a reverse phase C18 (Acquity UPLC HSS T3, 100 Å, 1.8 µm, 2.1×100 mm, Water Corporation, Milford, U.S.A) column thermostated at 55°C. The mobile phases were (A) water, (B) Acetonitrile, (C) 2-propanol and (D) 500 mM ammonium formate, pH 3. A starting elution gradient of 20% A, 30% B, 49% C and 1% D was increased linearly to 10% B, 89% C and 1 % D for 5.5 min, followed by isocratic elution at 10% B, 89%C and 1% D for 1.5 min and column equilibration with initial conditions for 1 min. Mass spectrometry data was acquired for positive electrospray ionization mode within 50–1200 Da range for primary metabolites and 100–2000 Da for complex lipids. For the electrospray acquisition, the capillary voltage was set at 1.5 kV (positive), sample cone voltage 30V, source temperature at 120°C, cone gas flow 50 L/h, desolvation temperature 400 °C and desolvation gas flow rate of 800 L/h with scan time of 0.5 sec in continuum mode. Leucine enkephalin [556.2771 Da (positive) was used for lockmass correction, and scans were performed every 0.5 min. The mass spectrometer was calibrated according to the manufacturer recommended procedure using sodium Iodide for complex lipid or sodium formate for primary metabolites. The samples were injected randomly at 3 µL volume. MSe data were processed using Progenesis QI (Nonlinear, Waters) and values were reported as area units. Annotations were determined by matching accurate mass and retention times using customized libraries created from authentic standards and/or by matching experimental tandem mass spectrometry data against the NIST MSMS or HMDB v3 theoretical fragmentations. To correct for drift caused by injection order, each feature was normalized using data from repeat injections of quality control samples collected every 10 injections throughout the samples acquisition. Measurement data were smoothed by Locally Weighted Scatterplot Smoothing signal correction as previously described (Dunn et al., 2011). Feature values between quality control samples were interpolated by a cubic spline. Metabolite values were rescaled by using the overall median of the historical quality control peak areas across all samples. Only detected features exhibiting a relative standard deviation (RSD) less than 30 in either the historical or pooled quality controls samples were considered for further statistical analysis. To reduce data matrix complexity, annotated features with multiple adducts or acquisition mode repeats were collapsed to one representative unique feature. Features were selected based on replicate precision (RSD<30), highest intensity and best isotope similarity matching to theoretical isotope distributions. Values were subsequently normalized to total protein.
Quantification and Statistical Analyses
Each experiment was conducted three times, as indicated n=3 in Figure Legend. Figures shown are representative. All analyses were carried out in Microsoft Excel and GraphPad Prism 7. Oncomine box plots were generated using GraphPad Prism. Unless otherwise noted, all statistical comparisons were made by unpaired two-tailed Student’s t-test and were considered significant if p<0.05, *p<0.05, **p<0.005, and ***p<0.0005. Limiting dilution assay was analyzed using Chi-Squared test. Oncomine analyses are displayed as Tukey boxplots. Oncomine analyses of the Finak breast cancer data set comparing relative CPT1B mRNA expression in normal breast tissues (n=6) and breast carcinoma tissues (n=53) and tumors from patients with recurrence (n=11) and no recurrence (n=8) within 5 years. Oncomine analysis of Gluck breast cancer dataset of CPT1B mRNA expression in breast tumors from patients with no (n=6), partial (n=72), near complete (n=6), and complete response (n=10) to paclitaxel taxol chemotherapy.
Supplementary Material
Key Resources Table
| REAGENT or RESOURCE | SOURCE | IDENTIFIER |
|---|---|---|
| Antibodies | ||
| Mouse monoclonal anti-CD44 | Cell Signaling Technology | Cat# 3570S; clone 156-3C11 |
| Mouse monoclonal anti-LEPR | Sigma Aldrich | Cat# SAB1402837-100UG; clone 2H5 |
| Rabbit polyclonal anti-CPT1B | Abcam | Cat# ab104662 |
| Rabbit polyclonal anti-STAT3 | Santa Cruz Biotech | Cat# SC-482 |
| Rabbit polyclonal anti-pY705-STAT3 | Cell Signaling Technology | Cat#9145S |
| Rabbit polyclonal anti-GAPDH | Santa Cruz Biotech | Cat#sc-25778 |
| Rabbit polyclonal anti-phospho-Jak2 (Tyr1007/1008) | Cell Signaling Technology | Cat# 3771S |
| RNA polymerase | Sigma Aldrich | Cat#05-952 |
| Normal rabbit IgG | Santa Cruz Biotech | Cat# SC-2027 |
| Leptin neutralizing antibody: Mouse monoclonal anti-LEPR | R&D Systems, Inc. | Cat# AF497 |
| Bacterial and Virus Strains | ||
| N/A | ||
| Biological Samples | ||
| Breast cancer patient specimens | City of Hope National Cancer Center | N/A |
| Chemicals, Peptides, and Recombinant Proteins | ||
| Recombinant LEPR | BD Pharmingen | Cat# 564376 |
| Recombinant CCR2 | BD Pharmingen | Cat# 561744 |
| Recombinant CXCR1 | BD Pharmingen | Cat# 555939 |
| Recombinant CXCR2 | BD Pharmingen | Cat# 551126 |
| [3H]-palmitic acid | PerkinElmer Inc | Cat# NET043001MC |
| [3H]-Acetyl Coenzyme A | PerkinElmer Inc | Cat# NET290050UC |
| Acetyl-coA | Sigma Aldrich | Cat# A2056 |
| Myristic acid | Sigma Aldrich | Cat# M3128 |
| paclitaxel | Sigma Aldrich | Cat# T7402 |
| Etomoxir | Sigma Aldrich | Cat# 236020 |
| Accutase | Millipore | Cat# SCR005 |
| Critical Commercial Assays | ||
| Imprint Chromatin-Immunoprecipitation kit | Sigma Aldrich | Cat# CHP1-96RXN |
| Adipokine array | R&D Systems | Cat# ARY024 |
| ChIPAb+ RNA Pol II - ChIP Validated Antibody and Primer Set | Sigma Aldrich | Cat#17-620 |
| RNeasy Plus Mini Kit | Qiagen | Cat#74134 |
| iScript cDNA Synthesis Kit | Bio-Rad | Cat#1708890 |
| iQ SYBR Green Supermix | Bio-Rad | Cat#1708880 |
| Deposited Data | ||
| N/A | ||
| Experimental Models: Cell Lines | ||
| MCF10A | ATCC | CRL-10317 |
| MCF-7 | ATCC | HTB-22 |
| MDA-MB-468 | ATCC | HTB-132 |
| MDA-MB-231-Parental | This paper | N/A |
| MDA-MB-231-Resistant | This paper | N/A |
| BBM2 | Neman and Jandial, 2004 | N/A |
| BBM3 | Neman and Jandial, 2004 | N/A |
| Hs578T | ATCC | HTB-126 |
| MDA-MB-436 | ATCC | HTB-130 |
| HCC1500 | ATCC | CRL-2329 |
| BT20 | ATCC | HTB-19 |
| Preadipocyte | Zen-Bio | BR-F |
| Experimental Models: Organisms/Strains | ||
| Mouse: FVB/N-Tg(MMTV-PyVT)634Mul/J | The Jackson Laboratory | Cat# 002374 |
| Oligonucleotides | ||
| Stat3 siRNA (h) | Santa Cruz Biotech | Cat# sc-29493 |
| Please see supplemental table 1 for primer sequence | ||
| Recombinant DNA | ||
| pRC-CMV-STAT3C | This paper | N/A |
| pGL 3.1 | Promega | Cat# E1751 |
| pGL3.1-CPT1B | This paper | N/A |
| Software and Algorithms | ||
| Oncomine | Rhodes and Chinnaiyan, 2004. | https://www.oncomine.org/ |
HIGHLIGHTS.
Inhibition of FAO preferentially eliminates BCSCs
JAK/STAT3 activates FAO through transcription of CPT1B
Adipocyte-derived leptin is critical for JAK/STAT3-FAO in BCSCs
Targeting FAO/leptin inhibits BCSCs, chemoresistance and breast tumor growth
Acknowledgments
We would like to thank Dr. Brian Armstrong and other members of Light Microscopy Imaging Core, Integrative Genomic Core at Beckman Research Institute, City of Hope Comprehensive Cancer Center. The authors would also like to thank the Irell & Manella Graduate School of Biological Sciences and the Beckman Research Institute for funding this project. This work is funded also in part by the Billy and Audrey Wilder Endowment and R01CA122976 to HY. Research reported in this publication was supported by the National Cancer Institute of the National Institutes of Health under grant number P30CA033572. The content is solely the responsibility of the authors and does not necessarily represent the official views of the National Institutes of Health.
Footnotes
Publisher's Disclaimer: This is a PDF file of an unedited manuscript that has been accepted for publication. As a service to our customers we are providing this early version of the manuscript. The manuscript will undergo copyediting, typesetting, and review of the resulting proof before it is published in its final citable form. Please note that during the production process errors may be discovered which could affect the content, and all legal disclaimers that apply to the journal pertain.
AUTHOR CONTRIBUTIONS
TW – all in vitro experimental procedures, conception and construction of study, manuscript writing
JF – metabolomics analysis and manuscript writing
HL – general guidance throughout study, especially for figures 6&7E and generated 231-P and 231-R cell lines, and manuscript writing and editing
YJL – FAO analysis, in vitro assays and manuscript writing
JS – Adipokine receptor analysis and CPT1B promoter assay
VL – fluorescence-immunohistochemitry staining for breast tumors and mitochondria
CZ – FAO assay
ST – metabolomic analysis
CY – performed in vivo experiments and data analyses and manuscript editing
YY – provided primary human tumor samples and useful discussions
RJ – provided BBM2 and BBM3 cell lines
GS – provided primary human tumor samples and useful discussions
SH – providing support and suggestions for the metabolomics analysis
RJ – guidance and mentorship, helped with study conception
HY – guidance and mentorship throughout study, manuscript writing and editing
References
- Abumrad NA, Elmaghrabi MR, Amri EZ, Lopez E, Grimaldi PA. Cloning of a Rat Adipocyte Membrane-Protein Implicated in Binding or Transport of Long-Chain Fatty-Acids That Is Induced during Preadipocyte Differentiation - Homology with Human Cd36. Journal of Biological Chemistry. 1993;268:17665–17668. [PubMed] [Google Scholar]
- Al-Hajj M, Wicha MS, Benito-Hernandez A, Morrison SJ, Clarke MF. Prospective identification of tumorigenic breast cancer cells. Proceedings of the National Academy of Sciences of the United States of America. 2003;100:3983–3988. doi: 10.1073/pnas.0530291100. [DOI] [PMC free article] [PubMed] [Google Scholar]
- Baumann J, Sevinsky C, Conklin DS. Lipid biology of breast cancer. Biochimica et biophysica acta. 2013;1831:1509–1517. doi: 10.1016/j.bbalip.2013.03.011. [DOI] [PMC free article] [PubMed] [Google Scholar]
- Bose D, Zimmerman LJ, Pierobon M, Petricoin E, Tozzi F, Parikh A, Fan F, Dallas N, Xia L, Gaur P, et al. Chemoresistant colorectal cancer cells and cancer stem cells mediate growth and survival of bystander cells. British journal of cancer. 2011;105:1759–1767. doi: 10.1038/bjc.2011.449. [DOI] [PMC free article] [PubMed] [Google Scholar]
- Bozza PT, Viola JP. Lipid droplets in inflammation and cancer. Prostaglandins, leukotrienes, and essential fatty acids. 2010;82:243–250. doi: 10.1016/j.plefa.2010.02.005. [DOI] [PubMed] [Google Scholar]
- Camarda R, Zhou AY, Kohnz RA, Balakrishnan S, Mahieu C, Anderton B, Eyob H, Kajimura S, Tward A, Krings G, et al. Inhibition of fatty acid oxidation as a therapy for MYC-overexpressing triple-negative breast cancer. Nat Med. 2016;22:427-+. doi: 10.1038/nm.4055. [DOI] [PMC free article] [PubMed] [Google Scholar]
- Carracedo A, Cantley LC, Pandolfi PP. Cancer metabolism: fatty acid oxidation in the limelight. Nature reviews Cancer. 2013;13:227–232. doi: 10.1038/nrc3483. [DOI] [PMC free article] [PubMed] [Google Scholar]
- Carracedo A, Weiss D, Leliaert AK, Bhasin M, de Boer VC, Laurent G, Adams AC, Sundvall M, Song SJ, Ito K, et al. A metabolic prosurvival role for PML in breast cancer. The Journal of clinical investigation. 2012;122:3088–3100. doi: 10.1172/JCI62129. [DOI] [PMC free article] [PubMed] [Google Scholar]
- Cham CM, Driessens G, O'Keefe JP, Gajewski TF. Glucose deprivation inhibits multiple key gene expression events and effector functions in CD8+ T cells. European journal of immunology. 2008;38:2438–2450. doi: 10.1002/eji.200838289. [DOI] [PMC free article] [PubMed] [Google Scholar]
- Chang CH, Curtis JD, Maggi LB, Jr, Faubert B, Villarino AV, O'Sullivan D, Huang SC, van der Windt GJ, Blagih J, Qiu J, et al. Posttranscriptional control of T cell effector function by aerobic glycolysis. Cell. 2013;153:1239–1251. doi: 10.1016/j.cell.2013.05.016. [DOI] [PMC free article] [PubMed] [Google Scholar]
- Chang CH, Qiu J, O'Sullivan D, Buck MD, Noguchi T, Curtis JD, Chen Q, Gindin M, Gubin MM, van der Windt GJ, et al. Metabolic Competition in the Tumor Microenvironment Is a Driver of Cancer Progression. Cell. 2015;162:1229–1241. doi: 10.1016/j.cell.2015.08.016. [DOI] [PMC free article] [PubMed] [Google Scholar]
- Ciavardelli D, Rossi C, Barcaroli D, Volpe S, Consalvo A, Zucchelli M, De Cola A, Scavo E, Carollo R, D'Agostino D, et al. Breast cancer stem cells rely on fermentative glycolysis and are sensitive to 2-deoxyglucose treatment. Cell death & disease. 2014;5:e1336. doi: 10.1038/cddis.2014.285. [DOI] [PMC free article] [PubMed] [Google Scholar]
- Comerford SA, Huang Z, Du X, Wang Y, Cai L, Witkiewicz AK, Walters H, Tantawy MN, Fu A, Manning HC, et al. Acetate dependence of tumors. Cell. 2014;159:1591–1602. doi: 10.1016/j.cell.2014.11.020. [DOI] [PMC free article] [PubMed] [Google Scholar]
- Cui W, Liu Y, Weinstein JS, Craft J, Kaech SM. An interleukin-21-interleukin-10-STAT3 pathway is critical for functional maturation of memory CD8+ T cells. Immunity. 2011;35:792–805. doi: 10.1016/j.immuni.2011.09.017. [DOI] [PMC free article] [PubMed] [Google Scholar]
- Demaria M, Giorgi C, Lebiedzinska M, Esposito G, D'Angeli L, Bartoli A, Gough DJ, Turkson J, Levy DE, Watson CJ, et al. A STAT3-mediated metabolic switch is involved in tumour transformation and STAT3 addiction. Aging. 2010;2:823–842. doi: 10.18632/aging.100232. [DOI] [PMC free article] [PubMed] [Google Scholar]
- Djouadi F, Bonnefont JP, Munnich A, Bastin J. Characterization of fatty acid oxidation in human muscle mitochondria and myoblasts. Molecular genetics and metabolism. 2003;78:112–118. doi: 10.1016/s1096-7192(03)00017-9. [DOI] [PubMed] [Google Scholar]
- Dunn WB, Broadhurst DI, Atherton HJ, Goodacre R, Griffin JL. Systems level studies of mammalian metabolomes: the roles of mass spectrometry and nuclear magnetic resonance spectroscopy. Chem Soc Rev. 2011;40:387–426. doi: 10.1039/b906712b. [DOI] [PubMed] [Google Scholar]
- Feldman DE, Chen C, Punj V, Tsukamoto H, Machida K. Pluripotency factor-mediated expression of the leptin receptor (OB-R) links obesity to oncogenesis through tumor-initiating stem cells. Proceedings of the National Academy of Sciences of the United States of America. 2012;109:829–834. doi: 10.1073/pnas.1114438109. [DOI] [PMC free article] [PubMed] [Google Scholar]
- Gattinoni L, Lugli E, Ji Y, Pos Z, Paulos CM, Quigley MF, Almeida JR, Gostick E, Yu Z, Carpenito C, et al. A human memory T cell subset with stem cell-like properties. Nat Med. 2011;17:1290–1297. doi: 10.1038/nm.2446. [DOI] [PMC free article] [PubMed] [Google Scholar]
- Grimshaw MJ, Cooper L, Papazisis K, Coleman JA, Bohnenkamp HR, Chiapero-Stanke L, Taylor-Papadimitriou J, Burchell JM. Mammosphere culture of metastatic breast cancer cells enriches for tumorigenic breast cancer cells. Breast Cancer Res. 2008;10 doi: 10.1186/bcr2106. [DOI] [PMC free article] [PubMed] [Google Scholar]
- Guzman M, Geelen MJ. Activity of carnitine palmitoyltransferase in mitochondrial outer membranes and peroxisomes in digitonin-permeabilized hepatocytes. Selective modulation of mitochondrial enzyme activity by okadaic acid. The Biochemical journal. 1992;287(Pt 2):487–492. doi: 10.1042/bj2870487. [DOI] [PMC free article] [PubMed] [Google Scholar]
- Han G, Wang L, Zhao W, Yue Z, Zhao R, Li Y, Zhou X, Hu X, Liu J. High expression of leptin receptor leads to temozolomide resistance with exhibiting stem/progenitor cell features in gliobalastoma. Cell cycle (Georgetown, Tex) 2013;12:3833–3840. doi: 10.4161/cc.26809. [DOI] [PMC free article] [PubMed] [Google Scholar]
- Harmon CM, Luce P, Beth AH, Abumrad NA. Labeling of Adipocyte Membranes by Sulfo-N-Succinimidyl Derivatives of Long-Chain Fatty-Acids - Inhibition of Fatty-Acid Transport. J Membrane Biol. 1991;121:261–268. doi: 10.1007/BF01951559. [DOI] [PubMed] [Google Scholar]
- Hay DR, Gwynne JF. Cirrhosis of the liver following therapy with perhexiline maleate. The New Zealand medical journal. 1983;96:202–204. [PubMed] [Google Scholar]
- Hedvat M, Huszar D, Herrmann A, Gozgit JM, Schroeder A, Sheehy A, Buettner R, Proia D, Kowolik CM, Xin H, et al. The JAK2 inhibitor AZD1480 potently blocks Stat3 signaling and oncogenesis in solid tumors. Cancer cell. 2009;16:487–497. doi: 10.1016/j.ccr.2009.10.015. [DOI] [PMC free article] [PubMed] [Google Scholar]
- Herrmann A, Cherryholmes G, Schroeder A, Phallen J, Alizadeh D, Xin H, Wang T, Lee H, Lahtz C, Swiderski P, et al. TLR9 Is Critical for Glioma Stem Cell Maintenance and Targeting. Cancer research. 2014 doi: 10.1158/0008-5472.CAN-14-1151. [DOI] [PMC free article] [PubMed] [Google Scholar]
- Herrmann A, Kortylewski M, Kujawski M, Zhang C, Reckamp K, Armstrong B, Wang L, Kowolik C, Deng J, Figlin R, Yu H. Targeting Stat3 in the myeloid compartment drastically improves the in vivo antitumor functions of adoptively transferred T cells. Cancer research. 2010;70:7455–7464. doi: 10.1158/0008-5472.CAN-10-0736. [DOI] [PMC free article] [PubMed] [Google Scholar]
- Ho PC, Bihuniak JD, Macintyre AN, Staron M, Liu X, Amezquita R, Tsui YC, Cui G, Micevic G, Perales JC, et al. Phosphoenolpyruvate Is a Metabolic Checkpoint of Anti-tumor T Cell Responses. Cell. 2015;162:1217–1228. doi: 10.1016/j.cell.2015.08.012. [DOI] [PMC free article] [PubMed] [Google Scholar]
- Hsu PP, Sabatini DM. Cancer cell metabolism: Warburg and beyond. Cell. 2008;134:703–707. doi: 10.1016/j.cell.2008.08.021. [DOI] [PubMed] [Google Scholar]
- Ito K, Carracedo A, Weiss D, Arai F, Ala U, Avigan DE, Schafer ZT, Evans RM, Suda T, Lee CH, Pandolfi PP. A PML-PPAR-delta pathway for fatty acid oxidation regulates hematopoietic stem cell maintenance. Nat Med. 2012;18:1350–1358. doi: 10.1038/nm.2882. [DOI] [PMC free article] [PubMed] [Google Scholar]
- Janiszewska M, Suva ML, Riggi N, Houtkooper RH, Auwerx J, Clement-Schatlo V, Radovanovic I, Rheinbay E, Provero P, Stamenkovic I. Imp2 controls oxidative phosphorylation and is crucial for preserving glioblastoma cancer stem cells. Genes & development. 2012;26:1926–1944. doi: 10.1101/gad.188292.112. [DOI] [PMC free article] [PubMed] [Google Scholar]
- Kortylewski M, Kujawski M, Wang T, Wei S, Zhang S, Pilon-Thomas S, Niu G, Kay H, Mule J, Kerr WG, et al. Inhibiting Stat3 signaling in the hematopoietic system elicits multicomponent antitumor immunity. Nat Med. 2005;11:1314–1321. doi: 10.1038/nm1325. [DOI] [PubMed] [Google Scholar]
- Kortylewski M, Xin H, Kujawski M, Lee H, Liu Y, Harris T, Drake C, Pardoll D, Yu H. Regulation of the IL-23 and IL-12 balance by Stat3 signaling in the tumor microenvironment. Cancer cell. 2009;15:114–123. doi: 10.1016/j.ccr.2008.12.018. [DOI] [PMC free article] [PubMed] [Google Scholar]
- Krammer J, Digel M, Ehehalt F, Stremmel W, Fullekrug J, Ehehalt R. Overexpression of CD36 and Acyl-CoA Synthetases FATP2, FATP4 and ACSL1 Increases Fatty Acid Uptake in Human Hepatoma Cells. Int J Med Sci. 2011;8:599–614. doi: 10.7150/ijms.8.599. [DOI] [PMC free article] [PubMed] [Google Scholar]
- Lochner M, Berod L, Sparwasser T. Fatty acid metabolism in the regulation of T cell function. Trends in immunology. 2015;36:81–91. doi: 10.1016/j.it.2014.12.005. [DOI] [PubMed] [Google Scholar]
- Lugli E, Dominguez MH, Gattinoni L, Chattopadhyay PK, Bolton DL, Song K, Klatt NR, Brenchley JM, Vaccari M, Gostick E, et al. Superior T memory stem cell persistence supports long-lived T cell memory. The Journal of clinical investigation. 2013;123:594–599. doi: 10.1172/JCI66327. [DOI] [PMC free article] [PubMed] [Google Scholar]
- Maciolek JA, Pasternak JA, Wilson HL. Metabolism of activated T lymphocytes. Current opinion in immunology. 2014;27:60–74. doi: 10.1016/j.coi.2014.01.006. [DOI] [PubMed] [Google Scholar]
- Mao P, Joshi K, Li J, Kim SH, Li P, Santana-Santos L, Luthra S, Chandran UR, Benos PV, Smith L, et al. Mesenchymal glioma stem cells are maintained by activated glycolytic metabolism involving aldehyde dehydrogenase 1A3. Proceedings of the National Academy of Sciences of the United States of America. 2013;110:8644–8649. doi: 10.1073/pnas.1221478110. [DOI] [PMC free article] [PubMed] [Google Scholar]
- Marotta LL, Almendro V, Marusyk A, Shipitsin M, Schemme J, Walker SR, Bloushtain-Qimron N, Kim JJ, Choudhury SA, Maruyama R, et al. The JAK2/STAT3 signaling pathway is required for growth of CD44(+)CD24(−) stem cell-like breast cancer cells in human tumors. The Journal of clinical investigation. 2011;121:2723–2735. doi: 10.1172/JCI44745. [DOI] [PMC free article] [PubMed] [Google Scholar]
- Neman J, Termini J, Wilczynski S, Vaidehi N, Choy C, Kowolik CM, Li H, Hambrecht AC, Roberts E, Jandial R. Human breast cancer metastases to the brain display GABAergic properties in the neural niche. Proceedings of the National Academy of Sciences of the United States of America. 2014;111:984–989. doi: 10.1073/pnas.1322098111. [DOI] [PMC free article] [PubMed] [Google Scholar]
- Oliva CR, Nozell SE, Diers A, McClugage SG, 3rd, Sarkaria JN, Markert JM, Darley-Usmar VM, Bailey SM, Gillespie GY, Landar A, Griguer CE. Acquisition of temozolomide chemoresistance in gliomas leads to remodeling of mitochondrial electron transport chain. The Journal of biological chemistry. 2010;285:39759–39767. doi: 10.1074/jbc.M110.147504. [DOI] [PMC free article] [PubMed] [Google Scholar]
- Priyadharshini B, Turka LA. T-cell energy metabolism as a controller of cell fate in transplantation. Current opinion in organ transplantation. 2015;20:21–28. doi: 10.1097/MOT.0000000000000149. [DOI] [PMC free article] [PubMed] [Google Scholar]
- Rossignol R, Gilkerson R, Aggeler R, Yamagata K, Remington SJ, Capaldi RA. Energy substrate modulates mitochondrial structure and oxidative capacity in cancer cells. Cancer research. 2004;64:985–993. doi: 10.1158/0008-5472.can-03-1101. [DOI] [PubMed] [Google Scholar]
- Schroeder A, Herrmann A, Cherryholmes G, Kowolik C, Buettner R, Pal S, Yu H, Muller-Newen G, Jove R. Loss of androgen receptor expression promotes a stem-like cell phenotype in prostate cancer through STAT3 signaling. Cancer research. 2014;74:1227–1237. doi: 10.1158/0008-5472.CAN-13-0594. [DOI] [PMC free article] [PubMed] [Google Scholar]
- Shafee N, Smith CR, Wei S, Kim Y, Mills GB, Hortobagyi GN, Stanbridge EJ, Lee EY. Cancer stem cells contribute to cisplatin resistance in Brca1/p53-mediated mouse mammary tumors. Cancer research. 2008;68:3243–3250. doi: 10.1158/0008-5472.CAN-07-5480. [DOI] [PMC free article] [PubMed] [Google Scholar]
- Sheridan C, Kishimoto H, Fuchs RK, Mehrotra S, Bhat-Nakshatri P, Turner CH, Goulet R, Badve S, Nakshatri H. CD44(+)/CD24(−) breast cancer cells exhibit enhanced invasive properties: an early step necessary for metastasis. Breast Cancer Res. 2006;8 doi: 10.1186/bcr1610. [DOI] [PMC free article] [PubMed] [Google Scholar]
- Siegel AM, Heimall J, Freeman AF, Hsu AP, Brittain E, Brenchley JM, Douek DC, Fahle GH, Cohen JI, Holland SM, Milner JD. A critical role for STAT3 transcription factor signaling in the development and maintenance of human T cell memory. Immunity. 2011;35:806–818. doi: 10.1016/j.immuni.2011.09.016. [DOI] [PMC free article] [PubMed] [Google Scholar]
- Sounni NE, Cimino J, Blacher S, Primac I, Truong A, Mazzucchelli G, Paye A, Calligaris D, Debois D, De Tullio P, et al. Blocking lipid synthesis overcomes tumor regrowth and metastasis after antiangiogenic therapy withdrawal. Cell metabolism. 2014;20:280–294. doi: 10.1016/j.cmet.2014.05.022. [DOI] [PubMed] [Google Scholar]
- Tammineni P, Anugula C, Mohammed F, Anjaneyulu M, Larner AC, Sepuri NB. The import of the transcription factor STAT3 into mitochondria depends on GRIM-19, a component of the electron transport chain. The Journal of biological chemistry. 2013;288:4723–4732. doi: 10.1074/jbc.M112.378984. [DOI] [PMC free article] [PubMed] [Google Scholar]
- van der Windt GJ, Everts B, Chang CH, Curtis JD, Freitas TC, Amiel E, Pearce EJ, Pearce EL. Mitochondrial respiratory capacity is a critical regulator of CD8+ T cell memory development. Immunity. 2012;36:68–78. doi: 10.1016/j.immuni.2011.12.007. [DOI] [PMC free article] [PubMed] [Google Scholar]
- Vander Heiden MG, Cantley LC, Thompson CB. Understanding the Warburg effect: the metabolic requirements of cell proliferation. Science (New York, NY) 2009;324:1029–1033. doi: 10.1126/science.1160809. [DOI] [PMC free article] [PubMed] [Google Scholar]
- Vlashi E, Lagadec C, Vergnes L, Matsutani T, Masui K, Poulou M, Popescu R, Della Donna L, Evers P, Dekmezian C, et al. Metabolic state of glioma stem cells and nontumorigenic cells. Proceedings of the National Academy of Sciences of the United States of America. 2011;108:16062–16067. doi: 10.1073/pnas.1106704108. [DOI] [PMC free article] [PubMed] [Google Scholar]
- Vultur A, Cao J, Arulanandam R, Turkson J, Jove R, Greer P, Craig A, Elliott B, Raptis L. Cell-to-cell adhesion modulates Stat3 activity in normal and breast carcinoma cells. Oncogene. 2004;23:2600–2616. doi: 10.1038/sj.onc.1207378. [DOI] [PubMed] [Google Scholar]
- Wang C, Liu F, Yuan Y, Wu J, Wang H, Zhang L, Hu P, Li Z, Li Q, Ye J. Metformin suppresses lipid accumulation in skeletal muscle by promoting fatty acid oxidation. Clinical laboratory. 2014a;60:887–896. doi: 10.7754/clin.lab.2013.130531. [DOI] [PubMed] [Google Scholar]
- Wang R, Lv Q, Meng W, Tan Q, Zhang S, Mo X, Yang X. Comparison of mammosphere formation from breast cancer cell lines and primary breast tumors. Journal of thoracic disease. 2014b;6:829–837. doi: 10.3978/j.issn.2072-1439.2014.03.38. [DOI] [PMC free article] [PubMed] [Google Scholar]
- Yoshii Y, Furukawa T, Saga T, Fujibayashi Y. Acetate/acetyl-CoA metabolism associated with cancer fatty acid synthesis: overview and application. Cancer letters. 2015;356:211–216. doi: 10.1016/j.canlet.2014.02.019. [DOI] [PubMed] [Google Scholar]
- Yue C, Shen S, Deng J, Priceman SJ, Li W, Huang A, Yu H. STAT3 in CD8+ T Cells Inhibits Their Tumor Accumulation by Downregulating CXCR3/CXCL10 Axis. Cancer immunology research. 2015;3:864–870. doi: 10.1158/2326-6066.CIR-15-0014. [DOI] [PMC free article] [PubMed] [Google Scholar]
- Zhang Q, Raje V, Yakovlev VA, Yacoub A, Szczepanek K, Meier J, Derecka M, Chen Q, Hu Y, Sisler J, et al. Mitochondrial localized Stat3 promotes breast cancer growth via phosphorylation of serine 727. The Journal of biological chemistry. 2013;288:31280–31288. doi: 10.1074/jbc.M113.505057. [DOI] [PMC free article] [PubMed] [Google Scholar]
- Zhao S, Xu W, Jiang W, Yu W, Lin Y, Zhang T, Yao J, Zhou L, Zeng Y, Li H, et al. Regulation of cellular metabolism by protein lysine acetylation. Science (New York, NY) 2010;327:1000–1004. doi: 10.1126/science.1179689. [DOI] [PMC free article] [PubMed] [Google Scholar]
- Zhou W, Simpson PJ, McFadden JM, Townsend CA, Medghalchi SM, Vadlamudi A, Pinn ML, Ronnett GV, Kuhajda FP. Fatty acid synthase inhibition triggers apoptosis during S phase in human cancer cells. Cancer research. 2003;63:7330–7337. [PubMed] [Google Scholar]
Associated Data
This section collects any data citations, data availability statements, or supplementary materials included in this article.