

Abstract
Aims
Regional cerebral oxygen saturation (rSO2) is currently the most used measure in clinical practice to monitor cerebral ischaemia in patients undergoing carotid endarterectomy (CEA). Although end‐tidal carbon dioxide (PETCO2) is known as a factor that influences rSO2, the relationship between PETCO2 and rSO2 has not been quantitatively evaluated in patients with severe arteriosclerosis. This study aimed to evaluate the effect of PETCO2 on rSO2 in patients undergoing CEA under general anaesthesia.
Methods
The intervention to change PETCO2 was conducted between skin incision and clamping of the carotid artery. The rSO2 values were observed by changing PETCO2 in the range of 25–45 mmHg. The PETCO2–rSO2 relationship was characterized by population analysis using a turnover model.
Results
In total, 1651 rSO2 data points from 30 patients were used to determine the pharmacodynamic characteristics. Hypertension (HTN) and systolic blood pressure (SBP) were significant covariates on the slope factor in the stimulatory effect of PETCO2 on rSO2 and fractional turnover rate constant (kout), respectively. The estimates of the parameters were kout(min−1): 3.59 for SBP <90 mmHg and 0.491 for SBP ≥90 mmHg, slope: 0.00321 for patients with HTN and 0.00664 for patients without HTN.
Conclusion
The presence of HTNattenuates the response of rSO2 after a change in PETCO2. When cerebral blood flow is in a state of decline caused by a decrease in SBP to <90 mmHg, the response of rSO2 to PETCO2 is increased. It is advisable to maintain SBP >90 mmHg in patients with HTNduring CEA.
Keywords: satherosclerosis, pharmacodynamics, vascular disease
What is Already Known about this Subject
Regional cerebral oxygen saturation (rSO2) increases with an increase in end‐tidal carbon dioxide (PETCO2).
A turnover model can be an appropriate method to describe a time delay between drug concentration and an endogenous effect.
What this Study Adds
The response of rSO2 to PETCO2 increase was slower in patients with hypertension than in those without hypertension.
When cerebral blood flow is in a state of decline caused by a decrease in systolic blood pressure to <90 mmHg, the response of rSO2 to PETCO2 is increased.
Introduction
Carotid endarterectomy (CEA) is a surgical procedure used to prevent stroke in patients with severe carotid stenosis caused by an atherosclerotic plaque 1. Cross‐clamping of the carotid artery is required to remove plaque at the bifurcation of the common carotid, which can lead to neurological derangement induced by impaired cerebral blood flow 2. Among the various neurological monitoring modalities, near‐infrared spectroscopy‐based regional cerebral oxygen saturation (rSO2) is mainly used to monitor cerebral ischaemia in clinical practice 3, 4. In an earlier study, an 11.7% decrease in rSO2 from the baseline value was set as the cut‐off value of neurological derangement under general anaesthesia 5. Although end‐tidal carbon dioxide (PETCO2) is known as a factor that influences rSO2 6, the relationship between PETCO2 and rSO2 has not been quantitatively evaluated in patients with severe arteriosclerosis.
In a previous study, a time delay was observed between PETCO2 and rSO2 7. The turnover model could appropriately describe it between drug concentration and effect 8. Moreover, the model is best conceptualized when the effect is an endogenous biomarker 8. Considering rSO2 as an endogenous substance in the human body, the turnover model can be used to characterize the effect of PETCO2 on rSO2 7.
The aim of this study was to quantitatively evaluate the dose–response relationship between PETCO2 and rSO2using a turnover model in patients undergoing CEA under general anaesthesia.
Materials and methods
Patient population
This clinical trial was approved by the Institutional Review Board of Asan Medical Center and was registered on an international clinical trials registry platform (http://cris.nih.go.kr; KCT0000179). Written informed consent was obtained from all patients. In total, 32 patients undergoing CEA under general anaesthesia were enrolled in this study. The indication for surgery was 70% stenosis of the internal carotid artery for symptomatic patients. Patients were excluded if they had a history of obstructive lung diseases, including asthma and chronic obstructive pulmonary disease. Two‐dimensional echocardiography and pulmonary function test were performed before surgery to evaluate the patient's physical condition.
Study procedure
All patients fasted for 6–8 h prior to surgery. For continuous blood pressure monitoring, a 20‐gauge catheter was inserted into a radial artery. Electrocardiography, pulse oximetry, PETCO2 and invasive blood pressure (Datex‐Ohmeda S/5, Planar Systems, Inc., Beaverton, OR, USA) were monitored continuously. Throughout the surgery, these data were downloaded to personal computers using RS232C cables. The rSO2 (INVOS 5100B, Covidien, Boulder, CO, USA) was monitored continuously and downloaded to a personal computer until recovery from anaesthesia. Sensors for rSO2 were placed on the right and left forehead. The rSO2 values from the right and left were averaged to evaluate the effect of PETCO2 on rSO2.The target concentrations of propofol and remifentanil were adjusted to maintain bispectral index (Covidien) values of <60 and stable haemodynamics. Systolic blood pressure (SBP) was maintained within the range of the resting values in the general ward, and were specific to each patient. If necessary, vasopressors and antihypertensive drugs were used to titrate the SBP during surgery. Tracheal intubation was performed after administering cisatracurium (0.2 mg kg−1). The lungs of the patients were then ventilated with oxygen in air [1:2, fraction of inspired oxygen (FiO2) = 0.47], and the tidal volume and ventilation rate were adjusted to maintain the PETCO2 between 25 and 45 mmHg. Neuromuscular blockade was reversed by administering pyridostigmine and glycopyrrolate at the end of surgery.
Method of intervention to change PETCO2
The intervention was conducted between skin incision and clamping of the carotid artery. Approximately 5 min after the start of skin incision, the tidal volume and ventilation rate were adjusted so that PETCO2 was maintained at 25 mmHg. When PETCO2 was maintained at 25 mmHg for more than 3 min, the tidal volume was halved and the ventilation rate was reduced to 2/3, which was maintained until PETCO2 reached 45 mmHg. When PETCO2 reached 45 mmHg, they were restored to the control values until PETCO2 reached 25 mmHg. The time at which the tidal volume and ventilation rate were decreased to raise PETCO2 to 45 mmHg was defined as the reference time. The intervention period was set as the time elapsed between the reference time and the time when PETCO2 reached 25 mmHg. The intervention period lasted 27.1 ±5.8 min. After the intervention period, PETCO2 was maintained between 35 and 45 mmHg until the end of the surgery.
Data selection of PETCO2 and rSO2
The individual data files of PETCO2 and rSO2 were recorded continuously during the intervention period. The PETCO2 and rSO2 values were updated every 10 s and 5 s, respectively. For pharmacodynamic analysis, these data points were selected every 30 s.
Population pharmacodynamic analysis
We observed a slight time delay between the maximum PETCO2 value and maximum rSO2 value (1.8 ±1.5 min). NONMEM VII level 3 (ICON Development Solutions, Ellicott City, MD, USA) was used to fit a turnover model to the data.
| (1) |
| (2) |
where kin is a turnover rate constant, kout is a fractional turnover rate constant, and rSO2_base is the baseline rSO2. H(c) is a stimulation function to explain the relationship between PETCO2 and rSO2. Within the PETCO2 range used in this study, the relationship is known to be linear 7. H(c) can be expressed as follows 9:
| (3) |
where slope is a slope factor in the stimulatory effect of PETCO2 on the production of the response (rSO2). To normalize the response of rSO2 to PETCO2 and to reduce the number of parameters to be estimated, rSO2 data were normalized to individual baseline rSO2 values. Hence, rSO2_base was set to 1.
Interindividual random variabilities in pharmacodynamic parameters were estimated assuming a log‐normal distribution. Diagonal matrices were applied to estimate the various distributions of η, where η represented the interindividual random variability with a mean of zero and a variance of ω 2. An additive residual error model was applied to the model building. NONMEM computed the minimum objective function value (OFV), a statistical equivalent to the –2 log likelihood of the model. An α level of 0.05, which corresponds to a reduction in the OFV of 3.84 (chi‐square distribution, degree of freedom = 1, P < 0.05), was used to distinguish between the hierarchical models 10. The covariates analysed were the time‐invariant age; height; weight; sex (1: male; 0: female); maximal percent decrease in luminal diameter of the ipsilateral or contralateral internal carotid artery; history of hypertension (HTN) or diabetes mellitus (DM; 1: presence; 0: absence); ejection fraction; E/A ratio; forced vital capacity (FVC); volume that has been exhaled at the end of the first second of forced expiration (FEV1); and FEV1/FVC ratio along with time‐varying SBP, mean blood pressure (MBP), and categorical data conversion of SBP (1: <90 mmHg; 2: ≥90 mmHg) and MBP (1: <60 mmHg, 2: ≥60 mmHg) during the intervention period. Nonparametric bootstrap analysis helped validate the models internally (fit4NM 3.3.3, Eun‐Kyung Lee and Gyu‐Jeong Noh; http://cran.r‐project.org/web/packages/fit4NM/index.html; last accessed: March 16, 2011) 11. Predictive checks were also performed using fit4NM 3.3.3 11. Deterministic simulations were performed to characterize the effect of covariates on rSO2 by using the estimated pharmacodynamic parameters of the final model.
Statistics
Statistical analyses were conducted using R (version 3.3.2; R Foundation for Statistical Computing, Vienna, Austria) or SigmaStat version 3.5 for Windows (Systat Software, Inc, Chicago, IL, USA). Data are expressed as the mean ± standard deviation for normally distributed continuous variables, the median (25–75%) for non‐normally distributed continuous variables, or counts and percentages for categorical variables.
Results
Of the 32 patients enrolled, two were excluded from the analysis because of a technical error in data file storage. The characteristics of the remaining 30 patients are summarized in Table 1. In total, 1651 rSO2 data points were used to determine the pharmacodynamic characteristics. Time courses of the PETCO2, rSO2, fractional rSO2calculated by dividing rSO2 by individual baseline rSO2 values, and SBP during the intervention period are shown in Figure 1. SBPs during the intervention period ranged between 68 and 178 mmHg. Actual and fractional values of rSO2 vs.PETCO2 are displayed in Figure 2. As PETCO2 increased, the rSO2 value tended to increase.
Table 1.
Patient characteristics (n = 30)
| Age, years | 68.8 ± 8.0 |
| Male/female | 27/3 |
| Weight, kg | 62.8 ± 7.8 |
| Height, cm | 162.9 ± 7.0 |
| ASA PS 2/3 | 21/9 |
| Coexisting disease | |
| Diabetes mellitus | 12 |
| Hypertension | 21 |
| Coronary artery disease | 7 |
| Maximal percent decrease in luminal diameter | |
| Ipsilateral internal carotid artery, % | 79.6 ± 7.2 |
| Contralateral internal carotid artery, % | 41.5 ± 20.9 |
| Cardiac function by measured two‐dimensional echocardiography | |
| Ejection fraction, % | 62.5 (59–64) |
| E/A ratio | 0.8 ± 0.2 |
| Pulmonary function tests | |
| FVC, l | 3.4 ± 0.6 |
| FEV1, l | 2.4 ± 0.6 |
| FEV1/FVC ratio | 7.5 (6.4–8.0) |
| Concomitant medication | |
| Antidiabetic drugs | 11/30 |
| Antihypertensive drugs | 21/30 |
| Lipid‐lowering drugs | 24/30 |
| Anticoagulation drugs | 17/30 |
| Aspirin | 16/30 |
| Others* | 17/30 |
The data are expressed as mean ±standard deviation, median (25–75%) or count, as appropriate. ASA PS, American Society of Anesthesiologists Physical Status;E/A ratio, the ratio of peak velocity flow in early diastole (the E wave) to peak velocity flow in late diastole caused by atrial contraction (the A wave); FVC,forced vital capacity; FEV1, volume that has been exhaled at the end of the first second of forced expiration. Antidiabetic drugs: metformine (9), glimepiride (3), vildagliptin (2), gliclazide (1); antihypertensive drugs: amlodipine (7), atenolol (4), hydrochlorothiazide (4), losartan (3), carvedilol (3), valsartan (2), nebivolo (2), spironolactone (1), barnidipine (1), nisoldipine (1); lipid‐lowering drugs: atorvastatin (13), rosuvastatin (9), simvastatin (2); Anticoagulation drugs: clopidogrel (14), warfarin (1), rivaroxaban (1); * rebamipide (mucosal protection, 4), isosorbide mononitrate (treatment of angina pectoris, 3), choline alfoscerate (treatment of Alzheimer's disease and other dementias, 3), tamsulosin (treatment of symptomatic benign prostatic hyperplasia, 2), allopurinol (decrease of uric acid level, 2), celecoxib (nonsteroidal anti‐inflammatory drug, 2), ranitidine (decrease of stomach acid production, 1), cilostazol (alleviation of the symptoms of intermittent claudication, 1).
Figure 1.

Time courses of end‐tidal carbon dioxide (PETCO2; A), regional cerebral oxygen saturation (rSO2; B), fractional rSO2 (C) and systolic blood pressure (D) during an intervention period to change PETCO2 in patients undergoing carotid endarterectomy (n = 30). PETCO2 is the partial pressure of CO2 at the end of an exhaled breath. The intervention was conducted between skin incision and clamping of the carotid artery. The time at which the tidal volume and ventilation rate were decreased to raise PETCO2 to 45 mmHg was defined as the reference time. The intervention period was set as the time elapsed between the reference time and the time when PETCO2 reached 25 mmHg. Fractional rSO2 was calculated by dividing rSO2 by the individual baseline rSO2 values. The baseline rSO2 value was defined as the rSO2 value at the reference time
Figure 2.
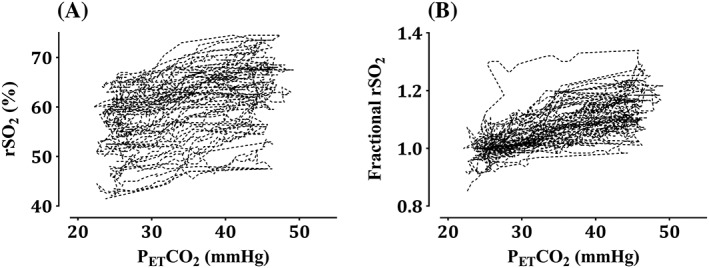
Regional cerebral oxygen saturation (rSO2, A) and fractional rSO2 (B) vs. end‐tidal carbon dioxide (PETCO2) in patients undergoing carotid endarterectomy (n = 30). PETCO2 is the partial pressure of CO2 at the end of an exhaled breath. The intervention was conducted between skin incision and clamping of the carotid artery. The time at which the tidal volume and ventilation rate were decreased to raise PETCO2 to 45 mmHg was defined as the reference time. The intervention period was set as the time elapsed between the reference time and the time when PETCO2 reached 25 mmHg. Fractional rSO2 was calculated by dividing rSO2 by the individual baseline rSO2 values. The baseline rSO2 value was defined as the rSO2 value at the reference time
The turnover model well described the time course of rSO2. A history of HTN (1: presence; 0: absence) was a significant covariate for the slope, and it resulted in a greater improvement in the OFV (4.70, P < 0.05, degree of freedom = 1) than did the basic model (number of model parameters = 5). Categorical data conversion of SBP (1: <90 mmHg; 2: ≥90 mmHg) was a significant covariate for the kout, and it resulted in a greater improvement in the OFV (88.43, P < 0.001, degree of freedom = 2) than did the OFV of a pharmacodynamic model that included HTN as a covariate for the slope only (number of model parameters = 6). Population pharmacodynamic parameter estimates, interindividual variability and median parameter values (2.5–97.5%) of the nonparametric bootstrap replicates of the final pharmacodynamic model of fractional rSO2 are represented in Table 2. Predictive checks of the final pharmacodynamic model are presented in Figure 3. In total, 5.4% of the data were distributed outside of the 90% prediction intervals of the predictive check. The simulated response of fractional rSO2 to PETCO2 in a hypothetical patient is depicted in Figure 4.
Table 2.
Population pharmacodynamic parameter estimates, inter‐individual variability, and median parameter values (2.5–97.5%) of the nonparametric bootstrap replicates of the final pharmacodynamic model of fractional regional cerebral oxygen saturation (rSO2)
| Parameter | Estimate (RSE, %) | CV (%) | Median (2.5–97.5%) |
|---|---|---|---|
| kout (min−1) | |||
| SBP < 90 mmHg | 3.59 (47.6) | 215.2 | 4.42 (1.63–13.3) |
| SBP ≥ 90 mmHg | 0.491 (24.8) | 130.0 | 0.498 (0.360–0.675) |
| rSO2_base | 1 (–) | – | – |
| Slope = θ1×HTN + (1 – HTN)×θ2 | |||
| θ1 | 0.00321 (22.7) | 87.2 | 0.00327 (0.00237–0.00439) |
| θ2 | 0.00664 (20.0) | 0.00692 (0.00501–0.00946) | |
| σ | 0.00218 (15.7) | – | 0.00223 (0.00179–0.00269) |
A log‐normal distribution of interindividual random variability was assumed. Residual random variability was modelled using an additive error model. Nonparametric bootstrap analysis was repeated 2000 times. CV, coefficient of variation; kout, fractional turnover rate constant; RSE, relative standard error = SE/mean×100 (%); SBP, categorical data conversion of systolic blood pressure during the intervention period, and every SBP was assigned a value of 1 (<90 mmHg) or 2 (≥90 mmHg). SBPs during the intervention period ranged between 68 mmHg and 178 mmHg. The intervention was conducted between skin incision and clamping of the carotid artery. The time at which the tidal volume and ventilation rate were decreased to raise end‐tidal carbon dioxide (PETCO2) to 45 mmHg was defined as the reference time. The intervention period was set as the time elapsed between the reference time and the time when PETCO2 reached 25 mmHg. rSO2_base: baseline rSO2, rSO2_base was set to 1 because rSO2 data were normalized to the individual baseline rSO2values. Baseline rSO2 value was defined as the rSO2 value at the reference time. Slope: slope factor in the stimulatory effect of PETCO2 on the production of the response (fractional rSO2). HTN,hypertension;HTN was assigned a value of 1 (a person diagnosed with HTN) or 0 (a person without HTN).
Figure 3.

Predictive checks of the final pharmacodynamic model. A black+ indicates the observed fractional regional cerebral oxygen saturation (rSO2). The solid red line and shaded areas indicate the 50% prediction line and 90% prediction intervals, respectively. Fractional rSO2 was calculated by dividing rSO2 by the individual baseline rSO2 values. Baseline rSO2 value was defined as the rSO2 value at the reference time. The time at which the tidal volume and ventilation rate were decreased to raise end‐tidal CO2 to 45 mmHg was defined as the reference time
Figure 4.

The simulated response of fractional regional cerebral oxygen saturation (rSO2) to end‐tidal carbon dioxide (PETCO2) in a hypothetical patient. Based on the presence of hypertension and whether the systolic blood pressure (SBP) was above or below 90 mmHg, four different cases were simulated. PETCO2 and fractional rSO2 data from a patient (ID 12) were used for the simulation analysis. SBPs observed during the intervention period ranged between 68 mmHg and 178 mmHg. The intervention was conducted between skin incision and clamping of the carotid artery. The time at which the tidal volume and ventilation rate were decreased to raise PETCO2 to 45 mmHg was defined as the reference time. The intervention period was set as the time elapsed between the reference time and the time when PETCO2 reached 25 mmHg. Fractional rSO2 was calculated by dividing rSO2 by the individual baseline rSO2 values. The baseline rSO2 value was defined as the rSO2 value at the reference time
Discussion
CEA is a prophylactic treatment to reduce the incidence of stroke in patients who are at risk of stroke from emboli arising from atheromatous plaque in the carotid artery 12. Timely CEA can substantially reduce the risk of stroke, but the possibility of complications during the perioperative period should be also considered. Cerebrovascular accident and myocardial infarction are the two most severe perioperative complications 12. Especially during surgery, neurological derangement induced by impaired cerebral blood flow usually occurs during cross‐clamping of the carotid artery 2. The primary intervention in this event is the insertion of a shunt. It is also appropriate to maintain blood pressure perhaps 20% above the preoperative level to maintain the perfusion pressure across the Circle of Willis 12. A number of techniques and monitors, such as stump pressure, electroencephalogram, near‐infrared spectroscopy and transcranial Doppler, are available to monitor the occurrence of neurological derangement. Near‐infrared spectroscopy‐based rSO2 is currently the most used in clinical practice due to its noninvasiveness and ease of use. During cross‐clamping of the carotid artery, a 5–6% increase in rSO2 was observed at PETCO2 40–45 mmHg compared with PETCO2 30–35 mmHg in unshunted patients 6, which means that the rSO2 value is changed by the change of PETCO2. The turnover model presented in this study well explained the relationship between PETCO2 and rSO2 in patients with arteriosclerosis.
In the final pharmacodynamic model, a history of HTN was a significant covariate for the slope factor in the stimulatory effect of PETCO2 on rSO2. The response of rSO2 to PETCO2 increase was slow in patients with HTN than in those without HTN (see Figure 3). This can be explained by the fact that cerebrovascular carbon dioxide reactivity was more impaired in patients with HTN than in normotensive patients 13, 14. HTN induces changes in cerebrovascular structure and function, such as an increase in the wall/lumen ratio of the vessels and a decrease in the vasoconstrictory and vasodilatory abilities of the cerebral arterioles 14, 15. Cerebral remodelling caused by HTN is thought to be related to the slow response to PETCO2 change.
In the operating room, a SBP of <80 mmHg is generally considered to indicate hypotension, and efforts are made to correct it 16. Autoregulation of cerebral blood flow refers to the intrinsic ability to maintain a constant perfusion in the face of blood pressure changes 17. In normal volunteers, the lower limit of autoregulation may be a MBP of 50–55 mmHg 18. However, in chronic HTN, the limits of autoregulation are shifted toward high blood pressure 17. Dynamic cerebral autoregulation is impaired in carotid artery stenosis 19. Taken together, cerebral blood flow may be reduced if SBP is <90 mmHg. Once cerebral blood flow is reduced, the compensatory mechanism to restore it will be activated. The increase in cerebral blood flow caused by the increase in PETCO2 will also become large. This hypothesis may be supported by the results of a previous study showing that full restoration of cerebral blood flow to the baseline value was faster in hypocapnia after the step decrease in SBP, while the response was slower in normocapnia and hypercapnia 20. The results of the final pharmacodynamic model showed that the values of kout were quite different when SBP was set at a cut‐off value of 90 mmHg (see Table 2). This difference led to a difference in the reaction of rSO2 to PETCO2 (refer to Figure 3). When a pharmacodynamic model was fitted to the data after a SBP of 90 mmHg or more was divided into two sections based on 140 mmHg, the kout values were similar (90 ≤ SBP < 140 mmHg: kout = 0.423; 140 ≤ SBP: kout = 0.419). Although categorical data conversion of MBP (1: <60 mmHg; 2: ≥60 mmHg) was a significant covariate for kout, the improvement of OFV (79.04) was less than that of SBP (88.43) as a covariate. The control stream of the final pharmacodynamic model that included a history of HTN and categorical data conversion of SBP are presented in the Appendix.
The difference in the reaction of rSO2 to PETCO2 was the largest in a hypothetical patient without HTN whose SBP remained below 90 mmHg (patient A) than in a patient with HTN whose SBP was maintained above 90 mmHg (patient B). Raising PETCO2 from 25 to 45 mmHg showed a difference of 16% fractional rSO2 between patients A and B (1.16–1.06 = 0.16; see Figure 3). Because the actual mean value of rSO2 at the reference time was 55.8, this difference represented a difference of 8.9 in actual rSO2 value.
In an earlier study, cerebrovascular carbon dioxide reactivity was greatly reduced in patients with severe cerebral vascular disease 21. The slope factor in the stimulatory effect of EtCO2 on rSO2 was about 2–3 times smaller in patients undergoing carotid endarterectomy than in patients from previous studies without cerebrovascular disease 7. In a previous study, DM was a significant covariate on the slope factor, but not in this study. Although DM was a significant covariate in the previous study, the slope factor was similar regardless of DM (presence of DM: slope factor = 0.011; absence of DM: slope factor = 0.015) 7. However, the slope factor of patients without HTN was about twice as large as that of patients with HTN in this study, which may suggest that HTN is a more significant covariate than is DM.
Cardiovascular lability is often observed in hypertensive patients undergoing general anaesthesia. These patients are prone to episodes of hypotension and HTN during surgery 22, 23. These adverse events are especially marked in patients undergoing CEA 12. An earlier study showed that HTN was seen in 25–58% of patients after CEA and hypotension was seen in 8–10% of patients 24. This study found that patients with HTN had lower cerebrovascular carbon dioxide reactivity than patients without HTN, which means that the ability to maintain cerebral blood flow is weakened. The decrease in SBP of these patients to <90 mmHg may lead to a decrease in cerebral blood flow. Hence, it is advisable to maintain SBP >90 mmHg in patients with HTN during CEA.
There are several limitations of the model. First, HTN is not well controlled and systolic blood pressure may be excessively high in patients with severe atherosclerosis. Because the model was constructed using limited blood pressure range data, it may not be possible to apply the results when the systolic blood pressure range is exceeded. Second, permissive hypercapnia can be helpful in mechanical ventilation strategies in patients with obstructive pulmonary disease 25. Changes in PETCO2 during surgery may cause harm to patients with obstructive lung disease, so these patients were excluded from the clinical study. This model does not explain cerebrovascular carbon dioxide reactivity in patients with obstructive pulmonary disease. Third, it is not possible to predict change of rSO2 and occurrence of neurological derangement during cross‐clamping of the carotid artery because the model was constructed using data before cross‐clamping.
There are also several issues to be considered as limitations of this study. First, cerebral near‐infrared spectroscopy measures the relative concentrations of oxyhaemoglobin and deoxyhaemoglobin, not cerebral blood flow. When evaluating cerebrovascular carbon dioxide reactivity, cerebral blood flow is commonly measured using transcranial Doppler 14, 18, 26. However, it is not widely used in clinical situations because of the small or absent transtemporal windows in some patients and the difficulty in keeping the probe steady 27. Therefore, rSO2 is widely used because of its convenience and its validation as a measurement tool to detect cerebral ischaemia during carotid endarterectomy 4. As previously mentioned, the aim of this study was to quantitatively evaluate the effect of PETCO2 on rSO2, and not evaluating cerebrovascular carbon dioxide reactivity. We used the concept of cerebral carbon dioxide reactivity when interpreting the results of the pharmacodynamic analysis. The findings of this study are physiologically accountable and consistent with those of previous studies 14, 20, 21. Second, other factors affecting the dependent variable may not have been considered. Haemoglobin, total bilirubin, and inspired oxygen fraction are known as factors affecting rSO2 measurement values 6, 28, 29. This study was conducted between skin incision and cross clamping of the carotid artery, and bleeding loss was negligible during this period. Therefore, haemoglobin levels would not have changed much during the intervention period. Total bilirubin levels were in the normal range in all patients, and the inspired oxygen fraction was kept constant. If both PETCO2 and FiO2 are involved in intervention, it may be difficult to evaluate the sole effect of EtCO2 on rSO2. Because the aim of this study was to evaluate the effect of PETCO2 on rSO2quantitatively, FiO2 was fixed at a constant value and PETCO2 was changed. In an earlier study that quantitatively analysed the effect of PETCO2 on rSO2 under general anaesthesia, FiO2 was also fixed to a constant value 7.
In conclusion, the turnover model well described the change in rSO2 according to the change in PETCO2. HTN and SBP were significant covariates on the slope factor in the stimulatory effect of EtCO2and fractional turnover rate constant, respectively. The presence of HTN attenuates the response of rSO2 after a change in PETCO2. When cerebral blood flow is in a state of decline caused by the decrease in SBP to <90 mmHg, the response of rSO2 to PETCO2 is increased. In anaesthetic management of patients undergoing carotid endarterectomy under general anaesthesia, it is advisable to maintain systolic blood pressure >90 mmHg in patients with HTN.
Competing Interests
All authors have completed the Unified Competing Interest form. No author has had any financial relationships over the previous 3 years with any organizations that might have an interest in this submitted work, and no author has any other relationships or has engaged in any activities that could appear to have influenced the submitted work.
This work was supported by the Korea Healthcare Technology R&D Project, Ministry of Health, Welfare and Family Affairs, Republic of Korea (Grant number: A102065–34).
Example of the control stream used in pharmacodynamic modelling
Turnover model

$PROB RUN# 45153 (turnover model)

$INPUT ID OID TIME CP DV MDV SEX AGE WT HT DM HTN MAXSTENO SBP MBP OPSBP

$DATA ETCO2_rSO2_join_covariates_BP_OID_fractional_DV_OPSBP2.csv IGNORE=@

; TIME: min

; CP: end-tidal CO2 (mmHg)

; DV: fractional rSO2

; SEX: M=1, F=0

; AGE: yr, WT: kg, HT: cm

; DM: 1=Yes, 0=No

; HTN: 1=Yes, 0=No

; MAXSTENO: maximal carotid artery stenosis

; BP: blood pressure (S: systol, M: mean, D: diastol)

; OPSBP: 1: SBP<90, 2: 90<=SBP

; OPMBP: 1: MBP<60, 2: 60<=MBP

$SUBROUTINE ADVAN=6 TOL=3

$MODEL COMP (EFF)

$PK

TH1 = THETA(1)

TH2 = THETA(2)

TH3 = THETA(3)

TH4 = THETA(4)

TH5 = THETA(5)

IF (OPSBP.EQ.1) KOUT=TH1*EXP(ETA(1))

IF (OPSBP.EQ.2) KOUT=TH2*EXP(ETA(2))

BRSO = TH3*EXP(ETA(3))

SLOPE = (TH4*HTN + (1-HTN)*TH5)*EXP(ETA(4))

KIN = KOUT*BRSO

IF(A_0FLG.EQ.1) A_0(1)=BRSO

$DES

FCO2=1 + SLOPE*CP

DADT(1) = KIN*FCO2 - KOUT*A(1)

$ERROR

ERSO2 = A(1)

IPRED = ERSO2

W = 1

IRES = DV - IPRED

IWRES = IRES / W

Y = IPRED + W*EPS(1)

$THETA ;#4

(0, 2) ; KOUT_SBP<90

(0, 0.5) ; KOUT_90<=SBP

1 FIX ; BRSO

(0, 0.1, 1) ; SLOPE_HTN

(0, 0.1, 1) ; SLOPE_No_HTN

$OMEGA ;#3

0.4 ; IIV_KOUT_SBP<90

0.4 ; IIV_KOUT_90 <=SBP

0 FIX ; IIV_BRSO

0.2 ; IIV_SLOPE

$SIGMA ;#1

0.1 ; EPS

$ESTIMATION NOTBT NOOBT NOSBT SIGL=3 NSIG=1 MAXEVAL=9999 PRINT=5 METHOD=1 INTER MSFO=45153.MSF NOABORT

$COVARIANCE PRINT=E
Ki, S.‐H. , Rhim, J.‐H. , Park, J.‐H. , Han, Y.‐J. , Cho, Y.‐P. , Kwon, T.‐W. , Choi, B.‐M. , and Noh, G.‐J. (2018) Quantitative analysis of the effect of end‐tidal carbon dioxide on regional cerebral oxygen saturation in patients undergoing carotid endarterectomy under general anaesthesia. Br J Clin Pharmacol, 84: 292–300. doi: 10.1111/bcp.13441.
References
- 1. Eckstein HH, Ringleb P, Allenberg JR, Berger J, Fraedrich G, Hacke W, et al Results of the Stent‐Protected Angioplasty versus Carotid Endarterectomy (SPACE) study to treat symptomatic stenoses at 2 years: a multinational, prospective, randomised trial. Lancet Neurol 2008; 7: 893–902. [DOI] [PubMed] [Google Scholar]
- 2. Choi BM, Park SK, Shin S, Cho YP, Kwon TW, Choi YJ, et al Neurologic derangement and regional cerebral oxygen desaturation associated with patency of the circle of Willis during carotid endarterectomy. J Cardiothorac Vasc Anesth 2015; 29: 1200–1205. [DOI] [PubMed] [Google Scholar]
- 3. Pennekamp CW, Moll FL, de Borst GJ. The potential benefits and the role of cerebral monitoring in carotid endarterectomy. Curr Opin Anaesthesiol 2011; 24: 693–697. [DOI] [PubMed] [Google Scholar]
- 4. Samra SK, Dy EA, Welch K, Dorje P, Zelenock GB, Stanley JC. Evaluation of a cerebral oximeter as a monitor of cerebral ischemia during carotid endarterectomy. Anesthesiology 2000; 93: 964–970. [DOI] [PubMed] [Google Scholar]
- 5. Mille T, Tachimiri ME, Klersy C, Ticozzelli G, Bellinzona G, Blangetti I, et al Near infrared spectroscopy monitoring during carotid endarterectomy: which threshold value is critical? Eur J Vasc Endovasc Surg 2004; 27: 646–650. [DOI] [PubMed] [Google Scholar]
- 6. Picton P, Chambers J, Shanks A, Dorje P. The influence of inspired oxygen fraction and end‐tidal carbon dioxide on post‐cross‐clamp cerebral oxygenation during carotid endarterectomy under general anesthesia. Anesth Analg 2010; 110: 581–587. [DOI] [PubMed] [Google Scholar]
- 7. Kim SY, Chae DW, Chun YM, Jeong KH, Park K, Han DW. Modelling of the effect of end‐tidal carbon dioxide on cerebral oxygen saturation in beach chair position under general anaesthesia. Basic Clin Pharmacol Toxicol 2016; 119: 85–92. [DOI] [PubMed] [Google Scholar]
- 8. Upton RN, Mould DR. Basic concepts in population modeling, simulation, and model‐based drug development: part 3‐introduction to pharmacodynamic modeling methods. CPT Pharmacometrics Syst Pharmacol 2014; 3: e88. [DOI] [PMC free article] [PubMed] [Google Scholar]
- 9. Gabrielsson J, Weiner D. Pharmacokinetic and Pharmacodynamic Data Analysis: Concepts and Applications, 5th edn. Sweden: Apotekarsocieteten, 2015; 235–255. [Google Scholar]
- 10. Beal S, Sheiner L. NONMEM User's Guides In: Part V Introductory Guide. San Francisco: NONMEM Project Group, University of California, 1992; 48. [Google Scholar]
- 11. Choi BM, Lee YH, An SM, Lee SH, Lee EK, Noh GJ. Population pharmacokinetics and analgesic potency of oxycodone. Br J Clin Pharmacol 2017; 83: 314–325. [DOI] [PMC free article] [PubMed] [Google Scholar]
- 12. Howell SJ. Carotid endarterectomy. Br J Anaesth 2007; 99: 119–131. [DOI] [PubMed] [Google Scholar]
- 13. Maeda H, Matsumoto M, Handa N, Hougaku H, Ogawa S, Itoh T, et al Reactivity of cerebral blood flow to carbon dioxide in hypertensive patients: evaluation by the transcranial Doppler method. J Hypertens 1994; 12: 191–197. [PubMed] [Google Scholar]
- 14. Settakis G, Pall D, Molnar C, Bereczki D, Csiba L, Fulesdi B. Cerebrovascular reactivity in hypertensive and healthy adolescents: TCD with vasodilatory challenge. J Neuroimaging 2003; 13: 106–112. [PubMed] [Google Scholar]
- 15. Heagerty AM, Aalkjaer C, Bund SJ, Korsgaard N, Mulvany MJ. Small artery structure in hypertension. Dual processes of remodeling and growth. Hypertension 1993; 21: 391–397. [DOI] [PubMed] [Google Scholar]
- 16. Reich DL, Wood RK Jr, Emre S, Bodian CA, Hossain S, Krol M, et al Association of intraoperative hypotension and pulmonary hypertension with adverse outcomes after orthotopic liver transplantation. J Cardiothorac Vasc Anesth 2003; 17: 699–702. [DOI] [PubMed] [Google Scholar]
- 17. Paulson OB, Strandgaard S, Edvinsson L. Cerebral autoregulation. Cerebrovasc Brain Metab Rev 1990; 2: 161–192. [PubMed] [Google Scholar]
- 18. Larsen FS, Olsen KS, Hansen BA, Paulson OB, Knudsen GM. Transcranial Doppler is valid for determination of the lower limit of cerebral blood flow autoregulation. Stroke 1994; 25: 1985–1988. [DOI] [PubMed] [Google Scholar]
- 19. White RP, Markus HS. Impaired dynamic cerebral autoregulation in carotid artery stenosis. Stroke 1997; 28: 1340–1344. [DOI] [PubMed] [Google Scholar]
- 20. Aaslid R, Lindegaard KF, Sorteberg W, Nornes H. Cerebral autoregulation dynamics in humans. Stroke 1989; 20: 45–52. [DOI] [PubMed] [Google Scholar]
- 21. Schieve JF, Wilson WP. The influence of age, anesthesia and cerebral arteriosclerosis on cerebral vascular activity to CO2 . Am J Med 1953; 15: 171–174. [DOI] [PubMed] [Google Scholar]
- 22. Forrest JB, Rehder K, Cahalan MK, Goldsmith CH. Multicenter study of general anesthesia. III. Predictors of severe perioperative adverse outcomes. Anesthesiology 1992; 76: 3–15. [DOI] [PubMed] [Google Scholar]
- 23. Chung F, Mezei G, Tong D. Pre‐existing medical conditions as predictors of adverse events in day‐case surgery. Br J Anaesth 1999; 83: 262–270. [DOI] [PubMed] [Google Scholar]
- 24. O'Connor CJ, Tuman KJ. Anesthetic considerations for carotid artery surgery In: Vascular Anaesthesia, 2nd edn, eds Kaplan JA, Lake CL, Murray MJ. Philadelphia: Churchill Livingstone, 2004; 187–198. [Google Scholar]
- 25. Contreras M, Masterson C, Laffey JG. Permissive hypercapnia: what to remember. Curr Opin Anaesthesiol 2015; 28: 26–37. [DOI] [PubMed] [Google Scholar]
- 26. Nishiyama T, Matsukawa T, Yokoyama T, Hanaoka K. Cerebrovascular carbon dioxide reactivity during general anesthesia: a comparison between sevoflurane and isoflurane. Anesth Analg 1999; 89: 1437–1441. [DOI] [PubMed] [Google Scholar]
- 27. Bass A, Krupski WC, Schneider PA, Otis SM, Dilley RB, Bernstein EF. Intraoperative transcranial Doppler: limitations of the method. J Vasc Surg 1989; 10: 549–553. [DOI] [PubMed] [Google Scholar]
- 28. Yoshitani K, Kawaguchi M, Miura N, Okuno T, Kanoda T, Ohnishi Y, et al Effects of hemoglobin concentration, skull thickness, and the area of the cerebrospinal fluid layer on near‐infrared spectroscopy measurements. Anesthesiology 2007; 106: 458–462. [DOI] [PubMed] [Google Scholar]
- 29. Song JG, Jeong SM, Shin WJ, Jun IG, Shin K, Huh IY, et al Laboratory variables associated with low near‐infrared cerebral oxygen saturation in icteric patients before liver transplantation surgery. Anesth Analg 2011; 112: 1347–1352. [DOI] [PubMed] [Google Scholar]