

Abstract
Aims
Inflammation and organ failure have been reported to have an impact on cytochrome P450 (CYP) 3A‐mediated clearance of midazolam in critically ill children. Our aim was to evaluate a previously developed population pharmacokinetic model both in critically ill children and other populations, in order to allow the model to be used to guide dosing in clinical practice.
Methods
The model was evaluated externally in 136 individuals, including (pre)term neonates, infants, children and adults (body weight 0.77–90 kg, C‐reactive protein level 0.1–341 mg l–1 and 0–4 failing organs) using graphical and numerical diagnostics.
Results
The pharmacokinetic model predicted midazolam clearance and plasma concentrations without bias in postoperative or critically ill paediatric patients and term neonates [median prediction error (MPE) <30%]. Using the model for extrapolation resulted in well‐predicted clearance values in critically ill and healthy adults (MPE <30%), while clearance in preterm neonates was over predicted (MPE >180%).
Conclusion
The recently published pharmacokinetic model for midazolam, quantifying the influence of maturation, inflammation and organ failure in children, yields unbiased clearance predictions and can therefore be used for dosing instructions in term neonates, children and adults with varying levels of critical illness, including healthy adults, but not for extrapolation to preterm neonates.
Keywords: children, cytochrome P450, drug metabolism
What is Already Known about this Subject
Recently, the impact of inflammation and organ failure on cytochrome P450 (CYP) 3A‐mediated midazolam metabolism has been quantified in critically ill children.
Before population pharmacokinetic models can be used for clinical decision making and deriving dosing recommendations, they should be thoroughly evaluated in external datasets.
What this Study Adds
Metabolic midazolam clearance can be accurately predicted in critically ill term neonates, infants and children using C‐reactive protein level and the number of failing organs.
While extrapolation to preterm neonates on the basis of this model leads to considerable overprediction of metabolic midazolam clearance, extrapolation to adults and patients beyond the studied disease severity levels yielded unbiased midazolam clearance predictions.
Introduction
Various studies suggest that cytochrome P450 3A (CYP3A)‐mediated drug metabolism may be reduced by inflammation and disease 1, 2, 3, 4, 5. Decreases in CYP3A‐mediated clearance may result in overdosing and side effects in certain patient populations. A previous study in critically ill children showed substantially reduced CYP3A‐mediated clearance of midazolam in patients with inflammation and organ failure 6. A population pharmacokinetic (PK) model for midazolam was developed, based on data both from critically ill term neonates and children between 0 and 17 years of age who were on mechanical ventilator support 6. Increased inflammation, reflected by a 10‐fold increase in the inflammatory marker C‐reactive protein (CRP) concentrations from 32 mg l–1 to 300 mg l–1, was found to correlate with a 50% reduction in midazolam clearance in this population. Furthermore, an increase in disease severity, reflected by the number of failing organs (cardiovascular, renal, respiratory, haematological and/or hepatic failure), e.g. increasing from one to three or >3, correlates with 35% or 47% reduced midazolam clearance, respectively (Figure 1).
Figure 1.
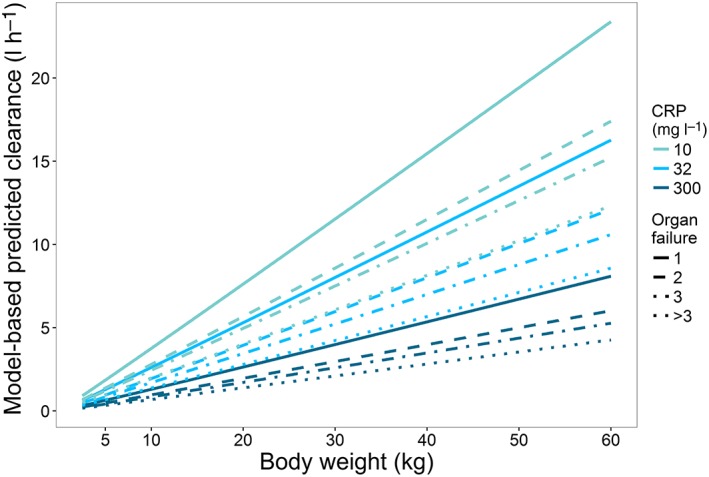
Model‐predicted paediatric midazolam clearance for different levels of inflammation, as reflected by C‐reactive protein (CRP) concentrations of 10 mg l–1, 32 mg l–1 and 300 mg l–1 (top to bottom), and disease severity scenarios, reflected by number of organ failures
To allow population models to be used for clinical decision making (e.g. for deriving dosing recommendations), they should be evaluated thoroughly 7, 8, 9. Without proper validation and evaluation, models can only be regarded as descriptive rather than predictive, thereby limiting their safe use for clinical and research applications 8. Three categories in model evaluation with increasing order of quality have been described 9, 10, 11: basic internal methods, advanced internal methods and external model evaluation. Marsot et al. 10 found that only 10% of the population models in paediatric subjects from neonates to 2 years of age developed up to 2010 were evaluated externally, even though this step is essential if the model is to be used to predict adequate dosing regimens in routine clinical practice. An external validation is based on new data that were not used for model development. A valid population model should at least be able to predict accurately data from patients with a distribution of characteristics (e.g. weight/age range or disease severity) comparable with those of the patient population included in model development 8. When a model is applied to predict pharmacokinetics in individuals with characteristics outside the range of the population used in model development, this not an external validation, but a form of extrapolation and this may affect the model's predictions in the new population 12.
The previously developed PK model for quantifying CYP3A‐mediated midazolam clearance in critically ill children 6 has the potential to define midazolam dosing regimens that reliably achieve target plasma concentrations. The aim of the present study was to evaluate the predictive performance of the population PK model in external data from patients with the same patient characteristics as in the original model (i.e. critically ill children, infants and term neonates). Moreover, the extrapolation potential of the model was investigated by evaluating its predictive performance in populations beyond the studied age range (i.e. preterm neonates or adults) and disease severity (healthy state).
Methods
Patients and data
From the literature, data from six studies were available that could be used for this external validation and extrapolation study 13, 14, 15, 16, 17, 18. These studies covered different patient populations, ranging largely in age from preterm neonates to adults with different disease severity levels. All studies had been approved by ethics committees, and informed (parental) consent had been obtained. Table 1 gives an overview of the patient and study characteristics of the available data for external validation 13, 14 and extrapolation 15, 16, 17, 18 as well as of the internal data from the original model development 6 as a comparison. The new data included 136 preterm neonates, infants, children and adults, all of whom received intravenous midazolam. Organ failure, scored from 0–5, was defined based on a maximum sub‐score for cardiovascular, renal, respiratory, haematological and hepatic failure on the paediatric logistic organ dysfunction (PELOD) score 19 for the paediatric subjects or on the Sequential Organ Failure Assessment (SOFA) score 20 for the adult subjects. For all study participants, information on respiratory function was known, while information on the function of other organs or on CRP levels was not always reported. For missing CRP data in preterm neonates and healthy adult volunteers, values for a healthy individual were assumed (i.e. a CRP concentration of 10 mg l–1). In the case of missing sub‐scores on organ dysfunction, it was assumed that there was no organ failure. For missing CRP values in critically ill adults 18, a CRP concentration of 32 mg l–1 was assumed, which was the median CRP value in the previously reported model 6 (Table 1; see section on original model, below). In total, 10 observations from two individuals were discarded because of a substantial increase in the plasma midazolam concentration without a recorded prior dosing event; for at least one individual, this was known to be due to flushing of the intravenous line in the contralateral arm before sampling.
Table 1.
Patient and study characteristics of datasets used for external validation 13, 14, and extrapolation 15, 16, 17, 18, compared with model building data 6
| Model building | New data for external validation | New data for extrapolation | |||||
|---|---|---|---|---|---|---|---|
| Study | Vet et al. 6 | De Wildt et al. 13 | Valkenburg et al. 14 | De Wildt et al. 15 | Jacqz‐Aigrain et al. 16 | van Gerven et al. 17 | Swart et al. 18 |
| Patient population | Critically ill children | Critically ill children | Infants after cardiac bypass surgery | Preterm neonates | Preterm neonates | Healthy male adults | Critically ill adults |
| Indication for midazolam | Mechanical ventilation in intensive care unit | Conscious sedation in intensive care unit | Postoperative sedation | Sedation for invasive procedure | Mechanical ventilation in intensive care unit | Healthy volunteers | Sedation in intensive care |
| Number of patients | 83 | 18 | 26 | 31 | 24 | 20 | 17 |
| Samples [n (median/patient)] | 523 (6) | 262 (11) | 153 (6) | 231 (8) | 63 (3) | 336 (16) | 238 (13) |
| Postnatal age [median (range)] | 5.1 months (1 day to 17 years) | 30 months (1 day to 17 years) | 6 months (3–31 months) | 5 days (3–44 days) | 3 days (1–7 days) | 24 years (20–31 years) | 56 years (21–84 years) |
| Body weight (kg) [median (range)] | 5.6 (2.5–63) | 13 (2.8–60) | 6.7 (3.6–12.9) | 1.1 (0.77–1.6) | 1.6 (0.96–3.7) | 72.5 (64–89) | 75 (63–90) |
| C‐reactive protein (mg l –1 ) [median (range)] | 32.0 (0.3–385) | 40.2 (0.1–341) | 47.5 (0.1–259) | NA | NA | NA | NA |
| Number of failing organs [median (range)] | 2 (0–5) | 2 (0–4) | 1 (1–2) | 1 (0–2) | 1 (1) | 0 (0) | 1 (1–3) |
| Administered dose during study | 0.15 (0.02–0.6) mg kg–1 h–1 infusion with 0.1 (0.02–0.6) mg kg–1 loading dose | 0.05–0.4 mg kg–1 h–1 infusion with 0.1 (0.05–0.35) mg kg–1 loading dose | 0.12 (0.02–0.3) mg kg–1 h–1 infusion with 0.05 (0.025–0.5) mg kg–1 loading dose titrated for effect | 0.1 mg kg–1 (0.05–0.25) 30‐min infusion | 0.06 mg kg–1 h–1 infusion. If GA <33weeks, after 24 h 0.03 mg kg–1 h–1 | 0.1 mg kg–1 20‐min infusion | 0.2 (0.03–0.85) mg kg–1 h–1 infusion with 0.1 (0.04–0.4) mg kg–1 loading dose titrated for effect |
GA, gestational age; NA, not available
Original model
The original population PK model consisted of a two‐compartment model in which the effect of body weight, inflammation, and organ failure on midazolam clearance in critically ill term neonates and children up to the age of 17 years was quantified 6. For a median patient of 5 kg body weight, with a CRP concentration of 32 mg l–1 and one failing organ, clearance was 1.29 l h–1 6. Individual clearance (CL) was quantified as follows:
| (1) |
in which CL5 kg varies for different numbers of failing organs, with a value of 1.29 l h–1, 0.96 l h–1, 0.83 l h–1 or 0.67 l h–1 for one, two, three or >3 failing organs, respectively, WTi is the body weight (in kg) of individual i, and CRPi is the CRP concentration (in mg l–1) of this individual. This corresponds to a clearance of 19.0 l h–1 for an individual with a body weight of 70 kg, a CRP concentration of 32 mg l–1 and one failing organ. The volume of distribution in the central compartment for individual i was:
| (2) |
corresponding to 113 l for a 70 kg individual, and the peripheral distribution volume and intercompartmental clearance were 5.44 l and 1.52 l h–1, respectively.
Model evaluation
The predictive performance of the PK model was evaluated using several tools. First, we obtained population and individual concentration predictions using the model and its published model parameters in NONMEM (version 7.3, ICON, Ellicott City, MD, USA). Using R (version 3.2.2) and R‐studio (version 0.98.1078), goodness‐of‐fit plots were constructed. Concentration predictions were compared visually with the observed concentrations, and the distribution of conditionally weighted residuals (CWRES) vs. the population prediction of the plasma concentrations and vs. time were assessed visually. When model predictions are unbiased, CWRES are randomly distributed around zero. Additionally, we plotted individual and population clearance predictions vs. the most dominant covariate (i.e. body weight), to assess the accuracy of the covariate model. Furthermore, bias was calculated per dataset by taking the median of the prediction error (PE):
| (3) |
in which pred is the predicted concentration or the individually predicted clearance, and obs the observed concentration or the population‐predicted clearance to evaluate the PE in concentration and clearance, respectively. An MPE of <30% was considered to be an accurate prediction. Moreover, a normalized prediction distribution error (NPDE) analysis was performed using the NPDE package in R 21. For each observed concentration in the external datasets, 1000 midazolam concentrations were simulated. The simulations were based on the dosing regimen, body weight, CRP concentrations and level of organ failure of the patients, and on the parameter values, including interindividual and residual variability, that were obtained for the original model (Table 2). These 1000 predicted concentrations were compared with the observed concentrations in the external datasets. For accurate concentration predictions, the mean of the NPDE is expected to be 0 and an adequate description of the variability in the model is expected to yield a variance in the NPDE distribution of 1.
Table 2.
Median prediction error (MPE) for predicted concentrations vs. observed concentrations, and individual predicted clearance vs. population‐predicted clearance
| Study | MPE (%)a | ||
|---|---|---|---|
| Plasma concentrations | Clearance | ||
| Model building | Vet et al. 6 | −13.7 | 5.27 |
| New data for external validation | De Wildt et al. 13 | −14.1 | 25.4 |
| Valkenburg et al. 14 | 3.1 | 22.0 | |
| New data for extrapolation | De Wildt et al. 15 | −63.5 | 1746 |
| Jacqz‐Aigrain et al. 16 | −68.3 | 186 | |
| van Gerven et al. 17 | −35.6 | 1.48 | |
| Swart et al. 18 | −40.6 | −1.67 | |
The MPE is the median of the prediction error, which reflects for plasma concentrations the difference in observed and predicted concentrations (see Methods, Eq. (3)). For clearance, the difference in individual predicted and population‐predicted clearance is calculated
Results
Overall, 1045 plasma concentrations from 136 subjects, aged between 1 day and 84 years, with a body weight ranging from 0.77 kg to 90 kg, were available for the external validation and extrapolation (Table 1) 13, 14, 15, 16, 17, 18. To compare, Table 1 also shows the data used for development of the original model, which were collected in 83 critically ill term neonates and children, ranging in age from 1 day to 17 years 6. The subjects for the external validation included 18 critically ill children 13 and 26 children following cardiac bypass surgery 14, who were within the age and body weight range of the model building dataset and had comparable CRP concentrations and levels of organ failure. Furthermore, 55 preterm neonates ranging in age between 1 day and 44 days 15, 16, 17 critically ill adults without alcohol abuse 18 and 20 healthy adults 17 were included to evaluate the extrapolation potential of the model predictions to patients outside the studied age and weight range and with different levels of disease severity.
The model described midazolam concentrations in the original dataset (Figure 2, panels A and B) and was able to predict midazolam clearance and plasma concentrations without bias in critically ill children 13 and children after cardiac bypass surgery 14 (Figure 2, panels C–F). In addition, no trends were observed in CWRES vs. predicted plasma concentrations (plot not shown), confirming that there was no bias in the peak and trough concentration predictions. In addition, the MPE was <30% for both concentrations and clearances (Table 2). The NPDE results indicated that model predictions are accurate without trends over time or concentration range (see Figure S1). The mean of the NPDE for both populations was not significantly different from 0 (0.034 and −0.062, respectively), while the variance of the variability in the external data was statistically significantly larger than predicted by the model (2.24 and 1.95, respectively). This indicates that the concentrations in the population were accurately predicted, but that more variability is observed in the new data than is predicted by the model. Figure 3 shows that the individual clearance predictions (data points), which are based on the patient's level of inflammation and organ failure, are scattered around the population clearance predictions for patients with varying body weight and a CRP concentration of 32 mg l–1 and one failing organ (black line).
Figure 2.
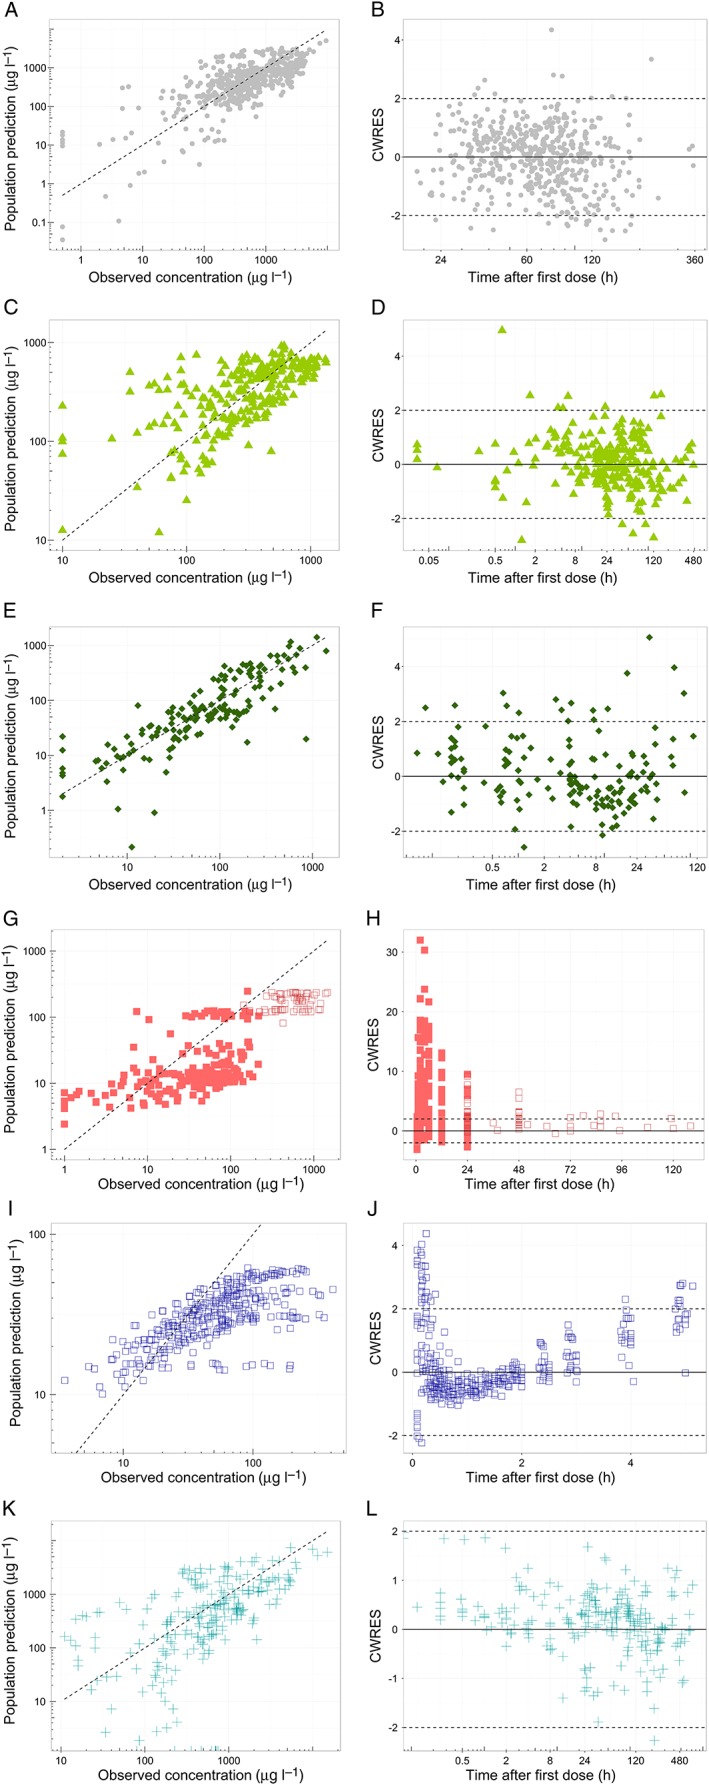
Goodness‐of‐fit plots, stratified per study. First column (A, C, E, G, I, K) shows the population predicted concentrations versus the observed concentrations and the second column (B, D, F, H, J, L) shows the conditionally weighted residuals (CWRES) over time for the different indicated patient populations. For panels G‐H, closed squares (◼) represent predictions from preterm neonates from the study of De Wildt et al. 15, while open squares (◻) are data from preterm neonates from the study of Jacqz‐Aigrain et al. 16
Figure 3.
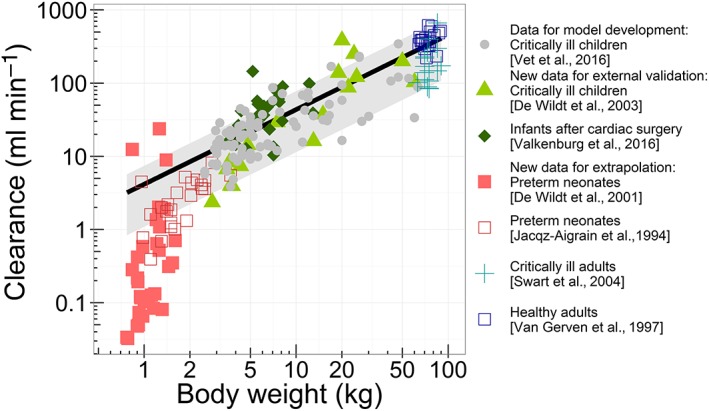
Population (line) and individual (symbols) predicted clearance vs. the patient's body weight. The population prediction assumes an individual with a C‐reactive protein (CRP) concentration of 32 mg l–1 and one failing organ. The grey shaded area indicates the range of population‐predicted clearance values from the healthiest patients [without inflammation (CRP 10 mg l–1) and without organ failure] (upper boundary) to the patient with the most severe disease state (CRP 300 mg l–1 and >3 failing organs) (lower boundary)
The model building dataset included term neonates, but no preterm neonates 22. Extrapolation of model predictions to preterm neonates without inflammation or organ failure resulted in underprediction of the high plasma concentrations at early time points (Figure 2, panels G and H), with an MPE >60% for both datasets (Table 2). The NPDE results also indicated biased model predictions and an underprediction of the variability (Figure S1, panels J–L). Figure 3 shows that clearance was generally overpredicted for this population.
When the model was used for extrapolation to healthy adults without organ failure and an assumed CRP concentration of 10 mg l–1, midazolam clearances were within the predicted range (MPE <30%), albeit at the upper range, which may be expected given their normal CRP concentrations and lack of organ failure (Figure 3). However, in the population‐predicted vs. observed plot (Figure 2I), the CWRES vs. time plot (Figure 2J) and the CWRES vs. population‐predicted concentration plot (not shown), a biphasic trend was observed, causing a large overprediction of peak and trough concentrations, and underprediction of other plasma concentrations, which is suggestive of a misspecification of drug distribution. The NPDE (Figure S1, panels M–O) also indicated this model misspecification for healthy adults. For critically ill adults with varying levels of organ failure and an assumed CRP concentration of 32 mg l–1, midazolam clearances were also predicted within the range (MPE <30%), although in the lower range (Figure 3). Furthermore, the plasma concentrations were predicted with reasonable accuracy (Figure 2, panels K and L). However, the NPDE also showed some model misspecification (the mean distribution error is significantly different from 0; see Figure S1), which may result from inappropriate information on drug distribution.
Discussion
In the present analysis, the predictive performance and extrapolation potential of a recently developed population PK model for midazolam, quantifying CYP3A‐mediated clearance in critically ill children 6, were evaluated. According to the applied model evaluation methods, midazolam clearance and plasma concentrations are well predicted in external data from critically ill children, infants and term neonates, and children after cardiac bypass surgery who are in the same age range and have similar levels of inflammation and organ failure. Extrapolation to subjects outside the age range and with different levels of disease severity resulted in biased clearance for preterm neonates and biased concentration predictions in healthy adults. Extrapolation to subjects outside the age range with similar levels of disease severity (e.g. critically ill adults) resulted in adequate clearance predictions (Figure 3).
To our knowledge, the evaluated PK model 6 in the present study is the first model to describe and quantify the relationship between inflammation and organ failure on midazolam clearance in children. As in the model, besides maturation, both inflammation and organ failure proved to be of relevance, and these factors could be relevant for the dosing of CYP3A substrates. However, model evaluation is essential before a model can be used for clinical decision making, such as developing dosing recommendations 7, 8, 9, 10. Ideally, a prospective study, with more subjects for external evaluation, should be undertaken, to ensure that patient characteristics and covariate information are recorded in a standard way. However, with literature data available 13, 14, 15, 16, 17, 18, it would be unethical and unnecessary to put additional burden on these vulnerable paediatric critically ill patients by performing another PK study 23.
The external validation of this model in cohorts of critically ill paediatric patients and infants after cardiac bypass surgery also confirmed the accuracy of the relationships obtained in patients who were not included in model building. The PK model predicted a 30% decrease in midazolam clearance when CRP concentrations that reflect the presence of inflammation increase threefold from 32 mg l–1 to 100 mg l–1, irrespective of the cause of elevated CRP concentrations, which could be respiratory disorders, cardiac disorders, sepsis or (non‐)cardiac surgery 6. Clearance decreased by 26% when disease severity, expressed as the number of failing organs, increased from one to two (Figure 1). Cardiovascular, renal, respiratory, haematological and hepatic failure each contributed to the number of failing organs, in which e.g. cardiac failure and mechanical ventilation may cause changes in cardiac output, thereby having an impact on midazolam clearance. As during an intensive care unit (ICU) stay, the number of failing organs and CRP concentrations may change over time, thereby influencing midazolam clearance, so drug dosing in clinical practice may require adjustments over time, assuming the same effective concentration. In any case, it seems advisable to monitor the effects of midazolam during the ICU stay in patients with major inflammation and/or organ failure. This may be especially relevant in preterm neonates, as there are known risks for adverse neurological effects due to the immaturity of γ‐aminobutyric acid (GABA) receptors. By evaluating the effects both in children and adults, the fact that target plasma concentrations may be influenced by inflammation or organ failure is also taken into account. Whether these results for midazolam also apply to other CYP3A substrates needs further study, and therapeutic drug monitoring may be required in the case of a small therapeutic window for the CYP3A substrate involved.
Many PK studies on the CYP3A substrate midazolam 24, 25, 26 have been performed in children over the past two decades 27, 28, 29, 30, 31, 32, 33, 34, 35, 36, 37, ranging from critically ill children to relatively healthy children undergoing elective surgery, and we compared our clearance predictions to the reported clearance values in the literature, from studies up to 25 years ago (Figure 4). The clearance values predicted by our model were within the reported ranges, albeit in the lower range and with high variability. High interindividual variability in clearance in children is partly due to maturation of CYP3A‐mediated metabolism 38, but CYP3A activity is also known to be downregulated by inflammatory cytokines in vitro 3. The reasons for our model predictions being generally lower than the paediatric values reported in the literature (Figure 4) might have been due to differences in disease states, as the ‘healthiest’ children in our study still had one failing organ and were still admitted to the ICU, while reported values in the literature mainly originated from non‐ICU children. This suggests that within a certain age and weight range, the disease state is relevant for drug dosing. For example, for paediatric oncology patients with acute‐phase inflammatory disease, a decreased midazolam clearance has been reported 39, while for relatively healthy children undergoing elective craniofacial surgery, a much higher midazolam clearance has been reported 28.
Figure 4.
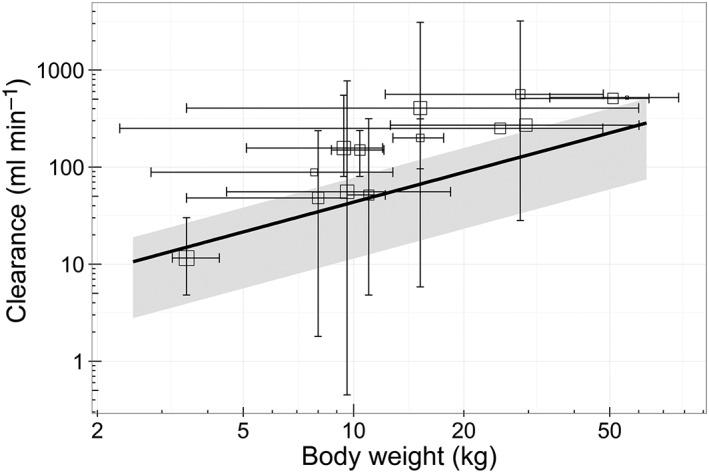
Population predicted clearance (oblique line) vs. the patient's body weight compared with literature‐reported clearance values (open squares with error bars) 28, 29, 30, 31, 32, 33, 34, 35, 36, 37. The population prediction assumes an individual with a C‐reactive protein (CRP) concentration of 32 mg l–1 and one failing organ. The grey shaded area indicates the range of population‐predicted clearance values from the healthiest patients [without inflammation (CRP 10 mg l–1) and without organ failure] (upper boundary) to the patient with the most severe disease state (CRP 300 mg l–1 and >3 failing organs) (lower boundary). The squares represent the reported clearance for a mean body weight. The horizontal error bars represent the included body weight range or the body weight range derived from the patient's age 42, 43, 44. Vertical error bars represent the total range of reported clearances or, in the case of one study, the 95% confidence interval. Literature data were obtained after a search of PubMed, with keywords including midazolam, clearance, paediatric, children and pharmacokinetics, and additional studies were identified from reviews and summarizing studies 27, 45, 46, 47, 48, 49, 50. Studies published up to 25 years ago were included if paediatric subjects in the study received intravenously administered midazolam. Studies with only preterm neonates and patients receiving extracorporeal membrane oxygenation treatment were excluded
A limitation of comparing results with literature values is that some studies report only summarized clearance data, which are less informative than individual data. Moreover, the clearance values described in the literature are mostly reported per kg body weight 29, 30, 31, 32, 33, 34, 35, 36, 37, without reporting the individual body weight values or body weight ranges 32, 33, 35, 37. Furthermore, detailed information on inflammation and/or organ failure is missing in these studies.
The external validation of our model confirmed accurate predictions of the pharmacokinetics of midazolam in critically ill children. However, the results also showed that the model should not be used for extrapolations to younger populations or populations with different levels of disease severity. Clearance was largely overpredicted in preterm neonates with a body weight below 3.5 kg and a gestational age of less than 37 weeks, which is likely to be due to biased maturation predictions of CYP3A activity and/or abundance in these young patients, or possibly the lower level of inflammation and organ failure in this patient group. Owing to rapid maturation after birth, which is not accounted for in our model, CYP3A capacity is likely to be overpredicted in our model. Based on the current data, however, it is not possible to discriminate between maturation and disease severity in this population. The disease state in the neonatal ICU population is known to be highly diverse, and, unfortunately, information on CRP levels was not available for most of the preterm infants. Assuming CRP values lower than 10 mg l–1 would result in higher predictions of clearance, rather than lower clearance, and with more failing organs (e.g. 1–4), the predicted clearance would be up to 47.3% lower, while the observed clearances in this population are even lower. Therefore, until the additional maturation processes in preterm neonates are accounted for in the model, it should not be used for extrapolation to this very young and critically ill population.
The extrapolation to adults included healthy and critically ill subjects alike. In the healthy adult population, clearance was well predicted, assuming normal CRP levels and the lack of organ failure that would be expected (Figure 3); however, the drug distribution was misspecified, resulting in a clear trend in the CWRES vs. time plot (Figure 2J). This biphasic trend suggests that an additional peripheral compartment is required to describe the distribution after a single (semi‐) bolus dose applied in adults. In the healthy volunteer study, more samples were taken directly after dosing, possibly allowing for the identification of relatively fast‐equilibrating peripheral compartments (Figure 2J). In critically ill adults who were less densely sampled, this trend in CWRES was indeed not observed (Figure 2L). Other possible explanations for these observations could be altered plasma protein binding in critically ill patients, which may alter drug distribution or capillary leaking in such patients 40; this may result in ultra‐fast equilibration of central and peripheral compartments. This ultra‐fast equilibration in these patients prevents the identification of peripheral compartments that can be identified in healthy patients without capillary leaking.
In critically ill adults, midazolam clearance values were predicted in the lower range of the expected clearance values (Figure 3). This indicates that, despite the different age and weight range in the external validation data, the model was able to predict clearance in the critically ill adults with similar levels of inflammation and organ failure.
Some limitations of the present extrapolation study should be acknowledged. As CRP concentrations were not available for all studies, the assumption was made that in healthy adults and preterm neonates, CRP was 10 mg l–1 and that in critically ill adults this inflammation marker had the median value of the internal dataset, of 32 mg l–1. To assess the impact of different CRP concentrations on clearance predictions, model‐based simulations were performed, with CRP values of 10 mg l–1 and 300 mg l–1 (see Figure 3, outer boundaries of the grey area). For preterm neonates in the neonatal ICU, assuming CRP values of 1 mg l–1 or 300 mg l–1 would both result in the overprediction of midazolam clearance (probably due to immature CYP3A in this population), while for critically ill adults, assuming a value of 10 mg l–1 or 300 mg l–1, yields an prediction of their clearance values within the predicted range (Figure 3, grey area). The model should therefore not be extrapolated to preterm infants. In our study, we could not account for genetic variation in CYP3A4/5 activity, as in the original dataset the variability in genotype was too low to identify a statistically significant impact of CYP3A4/5 genotype on midazolam clearance, and in the datasets of the current study, information on genotype was not available. However, in the literature it has been suggested that patients with expression of functional CYP3A5 metabolize midazolam faster and may compensate for the suppression of CYP3A4 activity due to inflammation or organ failure 41. These genotypes may also be of relevance in the different populations studied here but, given the data obtained in the present study, this could neither be confirmed nor rejected.
Finally, despite the adequate extrapolation potential of our model to the patient populations included in the current study, it should be noted that extrapolation to (special) populations not included in the current analysis (e.g. obese patients, pregnant women) is not warranted without first formally evaluating the extrapolation potential to these populations.
Conclusion
The recently published paediatric PK model for midazolam, quantifying the influence of maturation, inflammation and organ failure, can be used for predictions of CYP3A‐mediated midazolam clearance in term neonates, children and adults with varying levels of critical illness, including infants after cardiac bypass surgery and healthy adults. Using the model for extrapolation resulted in biased predictions of clearance in preterm neonates. The predictive performance of our model and its value for the development of paediatric dosing regimens for midazolam and potentially other CYP3A substrates was therefore confirmed for term neonates, infants, children and adults with varying levels of critical illness.
Competing Interests
This study was supported by a NWO/Vidi grant to Catherijne A. J. Knibbe (2013), and project grants from the Netherlands Organization for Health Research and Development, ZonMw Priority Medicines for Children (grant numbers 113 202 002 and 92 003 549), and Erasmus MC Cost‐Effectiveness Research.
The authors would like to thank Dr Cormac Breatnach for supervision of the study in infants after cardiac surgery and sharing the data for this external validation study.
Contributors
J.M.B. was involved in conceptualizing the data analysis, performing the data analysis and writing the manuscript. N.J.V., A.J.V., E.J.‐A., J.M.A., E.L.S., J.N.v.d.A., D.T. and M.d.H. were involved in the clinical studies and contributed to writing the manuscript. S.N.d.W. was involved in the clinical studies and conceptualizing the data analysis, and contributed to writing the manuscript. E.H.J.K. and C.A.J.K. were involved in conceptualizing the data analysis and contributed to writing the manuscript.
Supporting information
Figure S1 Normalized prediction distribution error (NPDE) results, stratified per subpopulation. The histograms in the first column show the overall distribution of the NPDE, and the second and third columns show the NPDE vs. time and the population‐predicted plasma concentrations, respectively. Mean and variance are tested for significant difference from 0 and 1, respectively
*P < 0.05
**P < 0.001
Brussee, J. M. , Vet, N. J. , Krekels, E. H. J. , Valkenburg, A. J. , Jacqz‐Aigrain, E. , van Gerven, J. M. A. , Swart, E. L. , van den Anker, J. N. , Tibboel, D. , de Hoog, M. , de Wildt, S. N. , and Knibbe, C. A. J. (2018) Predicting CYP3A‐mediated midazolam metabolism in critically ill neonates, infants, children and adults with inflammation and organ failure. Br J Clin Pharmacol, 84: 358–368. doi: 10.1111/bcp.13459.
References
- 1. Vet NJ, de Hoog M, Tibboel D, de Wildt SN. The effect of inflammation on drug metabolism: a focus on pediatrics. Drug Discov Today 2011; 16: 435–442. [DOI] [PubMed] [Google Scholar]
- 2. Zuppa AF, Barrett JS. Pharmacokinetics and pharmacodynamics in the critically ill child. Pediatr Clin North Am 2008; 55: 735–755. [DOI] [PubMed] [Google Scholar]
- 3. Aitken AE, Morgan ET. Gene‐specific effects of inflammatory cytokines on cytochrome P450 2C, 2B6 and 3A4 mRNA levels in human hepatocytes. Drug Metab Dispos 2007; 35: 1687–1693. [DOI] [PMC free article] [PubMed] [Google Scholar]
- 4. Aitken AE, Richardson TA, Morgan ET. Regulation of drug‐metabolizing enzymes and transporters in inflammation. Annu Rev Pharmacol Toxicol 2006; 46: 123–149. [DOI] [PubMed] [Google Scholar]
- 5. Carcillo JA, Doughty L, Kofos D, Frye RF, Kaplan SS, Sasser H, et al Cytochrome P450 mediated‐drug metabolism is reduced in children with sepsis‐induced multiple organ failure. Intensive Care Med 2003; 29: 980–984. [DOI] [PubMed] [Google Scholar]
- 6. Vet NJ, Brussee JM, de Hoog M, Mooij MG, Verlaat CW, Jerchel IS, et al Inflammation and organ failure severely affect midazolam clearance in critically ill children. Am J Respir Crit Care Med 2016; 194: 58–66. [DOI] [PubMed] [Google Scholar]
- 7. Brussee JM, Calvier EA, Krekels EH, Valitalo PA, Tibboel D, Allegaert K, et al Children in clinical trials: towards evidence‐based pediatric pharmacotherapy using pharmacokinetic–pharmacodynamic modeling. Expert Rev Clin Pharmacol 2016; 9: 1235–1244. [DOI] [PubMed] [Google Scholar]
- 8. Krekels EH, van Hasselt JG, Tibboel D, Danhof M, Knibbe CA. Systematic evaluation of the descriptive and predictive performance of paediatric morphine population models. Pharm Res 2011; 28: 797–811. [DOI] [PMC free article] [PubMed] [Google Scholar]
- 9. Brendel K, Dartois C, Comets E, Lemenuel‐Diot A, Laveille C, Tranchand B, et al Are population pharmacokinetic and/or pharmacodynamic models adequately evaluated? A survey of the literature from 2002 to 2004. Clin Pharmacokinet 2007; 46: 221–234. [DOI] [PMC free article] [PubMed] [Google Scholar]
- 10. Marsot A, Boulamery A, Bruguerolle B, Simon N. Population pharmacokinetic analysis during the first 2 years of life: an overview. Clin Pharmacokinet 2012; 51: 787–798. [DOI] [PubMed] [Google Scholar]
- 11. Tod M, Jullien V, Pons G. Facilitation of drug evaluation in children by population methods and modelling. Clin Pharmacokinet 2008; 47: 231–243. [DOI] [PubMed] [Google Scholar]
- 12. Collins GS, de Groot JA, Dutton S, Omar O, Shanyinde M, Tajar A, et al External validation of multivariable prediction models: a systematic review of methodological conduct and reporting. BMC Med Res Methodol 2014; 14: 40. [DOI] [PMC free article] [PubMed] [Google Scholar]
- 13. de Wildt SN, de Hoog M, Vinks AA, van der Giesen E, van den Anker JN. Population pharmacokinetics and metabolism of midazolam in pediatric intensive care patients. Crit Care Med 2003; 31: 1952–1958. [DOI] [PubMed] [Google Scholar]
- 14. Valkenburg AJ, Calvier EA, van Dijk M, Krekels EH, O'Hare BP, Casey WF, et al Pharmacodynamics and pharmacokinetics of morphine after cardiac surgery in children with and without down syndrome. Pediatr Crit Care Med 2016; 17: 930–938. [DOI] [PubMed] [Google Scholar]
- 15. de Wildt SN, Kearns GL, Hop WC, Murry DJ, Abdel‐Rahman SM, van den Anker JN. Pharmacokinetics and metabolism of intravenous midazolam in preterm infants. Clin Pharmacol Ther 2001; 70: 525–531. [DOI] [PubMed] [Google Scholar]
- 16. Jacqz‐Aigrain E, Daoud P, Burtin P, Desplanques L, Beaufils F. Placebo‐controlled trial of midazolam sedation in mechanically ventilated newborn babies. Lancet 1994; 344: 646–650. [DOI] [PubMed] [Google Scholar]
- 17. van Gerven JM, Roncari G, Schoemaker RC, Massarella J, Keesmaat P, Kooyman H, et al Integrated pharmacokinetics and pharmacodynamics of Ro 48‐8684, a new benzodiazepine, in comparison with midazolam during first administration to healthy male subjects. Br J Clin Pharmacol 1997; 44: 487–493. [DOI] [PMC free article] [PubMed] [Google Scholar]
- 18. Swart EL, Zuideveld KP, de Jongh J, Danhof M, Thijs LG, Strack van Schijndel RM. Comparative population pharmacokinetics of lorazepam and midazolam during long‐term continuous infusion in critically ill patients. Br J Clin Pharmacol 2004; 57: 135–145. [DOI] [PMC free article] [PubMed] [Google Scholar]
- 19. Leteurtre S, Martinot A, Duhamel A, Proulx F, Grandbastien B, Cotting J, et al Validation of the paediatric logistic organ dysfunction (PELOD) score: prospective, observational, multicentre study. Lancet 2003; 362: 192–197. [DOI] [PubMed] [Google Scholar]
- 20. Vincent JL, Moreno R, Takala J, Willatts S, De Mendonca A, Bruining H, et al The SOFA (sepsis‐related organ failure assessment) score to describe organ dysfunction/failure. On behalf of the working group on sepsis‐related problems of the European Society of Intensive Care Medicine. Intensive Care Med 1996; 22: 707–710. [DOI] [PubMed] [Google Scholar]
- 21. Comets E, Brendel K, Mentre F. Computing normalised prediction distribution errors to evaluate nonlinear mixed‐effect models: the npde add‐on package for R. Comput Methods Programs Biomed 2008; 90: 154–166. [DOI] [PubMed] [Google Scholar]
- 22. Vet NJ, de Wildt SN, Verlaat CW, Knibbe CA, Mooij MG, Hop WC, et al Daily interruption of sedation in critically ill children: study protocol for a randomized controlled trial. Trials 2014; 15: 55. [DOI] [PMC free article] [PubMed] [Google Scholar]
- 23. Knibbe CAJ, Krekels EH, Danhof M. Advances in paediatric pharmacokinetics. Expert Opin Drug Metab Toxicol 2011; 7: 1–8. [DOI] [PubMed] [Google Scholar]
- 24. Gorski JC, Hall SD, Jones DR, VandenBranden M, Wrighton SA. Regioselective biotransformation of midazolam by members of the human cytochrome P450 3A (CYP3A) subfamily. Biochem Pharmacol 1994; 47: 1643–1653. [DOI] [PubMed] [Google Scholar]
- 25. Thummel KE, Shen DD, Podoll TD, Kunze KL, Trager WF, Bacchi CE, et al Use of midazolam as a human cytochrome P450 3A probe: II. Characterization of inter‐ and intraindividual hepatic CYP3A variability after liver transplantation. J Pharmacol Exp Ther 1994; 271: 557–566. [PubMed] [Google Scholar]
- 26. Thummel KE, Shen DD, Podoll TD, Kunze KL, Trager WF, Hartwell PS, et al Use of midazolam as a human cytochrome P450 3A probe: I. In vitro–in vivo correlations in liver transplant patients. J Pharmacol Exp Ther 1994; 271: 549–556. [PubMed] [Google Scholar]
- 27. Anderson BJ, Larsson P. A maturation model for midazolam clearance. Paediatr Anaesth 2011; 21: 302–308. [DOI] [PubMed] [Google Scholar]
- 28. Peeters MY, Prins SA, Knibbe CA, Dejongh J, Mathot RA, Warris C, et al Pharmacokinetics and pharmacodynamics of midazolam and metabolites in nonventilated infants after craniofacial surgery. Anesthesiology 2006; 105: 1135–1146. [DOI] [PubMed] [Google Scholar]
- 29. Muchohi SN, Kokwaro GO, Ogutu BR, Edwards G, Ward SA, Newton CR. Pharmacokinetics and clinical efficacy of midazolam in children with severe malaria and convulsions. Br J Clin Pharmacol 2008; 66: 529–538. [DOI] [PMC free article] [PubMed] [Google Scholar]
- 30. Reed MD, Rodarte A, Blumer JL, Khoo KC, Akbari B, Pou S, et al The single‐dose pharmacokinetics of midazolam and its primary metabolite in pediatric patients after oral and intravenous administration. J Clin Pharmacol 2001; 41: 1359–1369. [DOI] [PubMed] [Google Scholar]
- 31. De Wildt SN, Riva L, van den Anker JN, Murray DJ. Does age alter the pharmacokinetics of midazolam and I‐OH‐midazolam in paediatric patients? Clin Pharmacol Ther 2000; 67: 104. [Google Scholar]
- 32. Nahara MC, McMorrow J, Jones PR, Anglin D, Rosenberg R. Pharmacokinetics of midazolam in critically ill pediatric patients. Eur J Drug Metab Pharmacokinet 2000; 25: 219–221. [DOI] [PubMed] [Google Scholar]
- 33. Hughes J, Gill AM, Mulhearn H, Powell E, Choonara I. Steady‐state plasma concentrations of midazolam in critically ill infants and children. Ann Pharmacother 1996; 30: 27–30. [DOI] [PubMed] [Google Scholar]
- 34. Burtin P, Jacqz‐Aigrain E, Girard P, Lenclen R, Magny JF, Betremieux P, et al Population pharmacokinetics of midazolam in neonates. Clin Pharmacol Ther 1994; 56 (6 Pt 1): 615–625. [DOI] [PubMed] [Google Scholar]
- 35. Tolia V, Brennan S, Aravind MK, Kauffman RE. Pharmacokinetic and pharmacodynamic study of midazolam in children during esophagogastroduodenoscopy. J Pediatr 1991; 119: 467–471. [DOI] [PubMed] [Google Scholar]
- 36. Rey E, Delaunay L, Pons G, Murat I, Richard MO, Saint‐Maurice C, et al Pharmacokinetics of midazolam in children: comparative study of intranasal and intravenous administration. Eur J Clin Pharmacol 1991; 41: 355–357. [DOI] [PubMed] [Google Scholar]
- 37. Hartwig S, Roth B, Theisohn M. Clinical experience with continuous intravenous sedation using midazolam and fentanyl in the paediatric intensive care unit. Eur J Pediatr 1991; 150: 784–788. [DOI] [PubMed] [Google Scholar]
- 38. Ince I, Knibbe CA, Danhof M, de Wildt SN. Developmental changes in the expression and function of cytochrome P450 3A isoforms: evidence from in vitro and in vivo investigations. Clin Pharmacokinet 2013; 52: 333–345. [DOI] [PubMed] [Google Scholar]
- 39. Rivory LP, Slaviero KA, Clarke SJ. Hepatic cytochrome P450 3A drug metabolism is reduced in cancer patients who have an acute‐phase response. Br J Cancer 2002; 87: 277–280. [DOI] [PMC free article] [PubMed] [Google Scholar]
- 40. Cordemans C, De Laet I, van Regenmortel N, Schoonheydt K, Dits H, Huber W, et al Fluid management in critically ill patients: the role of extravascular lung water, abdominal hypertension, capillary leak, and fluid balance. Ann Intensive Care 2012; 2: (Suppl 1): S1. [DOI] [PMC free article] [PubMed] [Google Scholar]
- 41. Kirwan CJ, MacPhee IA, Lee T, Holt DW, Philips BJ. Acute kidney injury reduces the hepatic metabolism of midazolam in critically ill patients. Intensive Care Med 2012; 38: 76–84. [DOI] [PubMed] [Google Scholar]
- 42. World Health Organization (WHO) . Child growth standards, weight‐for‐age: boys 2–5 years [online]. Available at http://www.who.int/childgrowth/standards/cht_wfa_boys_z_2_5.pdf (last accessed 31 October 2016).
- 43. World Health Organization (WHO) . Child growth standards, weight‐for‐age: boys birth‐2 years [online]. Available at http://www.who.int/childgrowth/standards/cht_wfa_boys_z_0_2.pdf (last accessed 31 October 2016).
- 44. Royal College of Paediatrics and Child Health (RCPCH) and Department of Health . UK growth chart boys 2‐18 years. 2nd Edition [online]; Available at http://www.rcpch.ac.uk/child‐health/research‐projects/uk‐who‐growth‐charts/uk‐growth‐chart‐resources‐2‐18‐years/school‐age2013 (last accessed 31 October 2016)
- 45. Altamimi MI, Sammons H, Choonara I. Inter‐individual variation in midazolam clearance in children. Arch Dis Child 2015; 100: 95–100. [DOI] [PMC free article] [PubMed] [Google Scholar]
- 46. Pacifici GM. Clinical pharmacology of midazolam in neonates and children: effect of disease – a review. Int J Pediatr 2014; 2014: 309342. [DOI] [PMC free article] [PubMed] [Google Scholar]
- 47. Ng E, Taddio A, Ohlsson A. Intravenous midazolam infusion for sedation of infants in the neonatal intensive care unit. Cochrane Database Syst Rev 2012; (6): CD002052. [DOI] [PubMed] [Google Scholar]
- 48. Swart EL, Slort PR, Plotz FB. Growing up with midazolam in the neonatal and pediatric intensive care. Curr Drug Metab 2012; 13: 760–766. [DOI] [PubMed] [Google Scholar]
- 49. Bjorkman S. Prediction of drug disposition in infants and children by means of physiologically based pharmacokinetic (PBPK) modelling: theophylline and midazolam as model drugs. Br J Clin Pharmacol 2005; 59: 691–704. [DOI] [PMC free article] [PubMed] [Google Scholar]
- 50. Blumer JL. Clinical pharmacology of midazolam in infants and children. Clin Pharmacokinet 1998; 35 (1): 37–47. [DOI] [PubMed] [Google Scholar]
Associated Data
This section collects any data citations, data availability statements, or supplementary materials included in this article.
Supplementary Materials
Figure S1 Normalized prediction distribution error (NPDE) results, stratified per subpopulation. The histograms in the first column show the overall distribution of the NPDE, and the second and third columns show the NPDE vs. time and the population‐predicted plasma concentrations, respectively. Mean and variance are tested for significant difference from 0 and 1, respectively
*P < 0.05
**P < 0.001