

Abstract
Aims
Preclinical results suggest therapeutic potential of mild hyperbilirubinemia in T2DM and cardiovascular disease. Translational data are limited, because an appropriate bilirubin formulation for parenteral human use is lacking. Considering its use in both clinical practice and medical research in the past, we explored the feasibility to reintroduce parenteral bilirubin for translational experiments.
Methods
We developed a preparation method in accordance with good manufacturing practice and evaluated the parenteral applicability in healthy volunteers (n = 8). Explorative pharmacokinetic and safety data were compared to the results from a literature study on the former parenteral use of bilirubin. Bilirubin was administered intra‐arterially to raise the local plasma concentration in the forearm vascular bed (n = 4) and intravenously to raise the systemic plasma concentration (n = 4). Finally, pharmacokinetic characteristics were studied following a single bolus infusion (n = 3).
Results
During parenteral application, no side effects occurred. Adverse events mentioned during the two‐week observation period were in general mild and self‐limiting. Three more significant adverse events (appendicitis, asymptomatic cardiac arrhythmia and atopic eczema) were judged unrelated by independent physicians.
A dose–concentration relationship appeared sufficiently predictable for both intra‐arterial and intravenous administration. In line with existing knowledge, bilirubin pharmacokinetics could be described best according to a two‐compartment model with a volume of distribution of 9.9 (±2.0) l and a total plasma clearance of 36 (±16) ml per minute.
Conclusions
Supported by previous reports, our data suggest that it is both feasible and safe to perform translational experiments with parenteral albumin bound bilirubin.
Keywords: bilirubin, human use, parenteral, pharmacokinetics, safety, translational research
What is Already Known about this Subject
Multiple preclinical experiments demonstrate beneficial effects of bilirubin administration for both type 2 diabetes mellitus and cardiovascular disease.
Parenteral administration of bilirubin used to be part of daily clinical practice and medical research in the past.
Reintroduction of bilirubin for parenteral human use is needed for the translation of promising preclinical findings.
What this Study Adds
If produced under Good Manufacturing Practice (GMP) guidelines and applied in an albumin‐bound formulation, parenterally administered bilirubin appears safe up to plasma concentrations of 86 μmol l−1.
Exploratory pharmacokinetic experiments demonstrate sufficiently predictable dose–concentration curves.
Introduction
Though commonly seen as a harmful residual product from the breakdown of haeme, bilirubin was already demonstrated to possess antioxidant capacities in 1954 1. Ever since, a wide variety of in vitro and animal studies have been published on the protecting antioxidant, anti‐inflammatory and antifibrotic effects of both bilirubin and haeme oxygenase (HO), the rate‐limiting enzyme in bilirubin formation 2, 3. Numerous observational studies have demonstrated an inverse association between bilirubin concentrations and cardiovascular disease in humans 4. Therefore, both the induction of a mild hyperbilirubinaemia and the enhancement of HO activity have been suggested for the treatment of a variety of diseases, including type 2 diabetes mellitus (T2DM) and related cardiovascular disorders 2, 5, 6. In the case of cardiovascular disease, translational research is enabled by several well‐established measures of endothelium function as surrogate endpoints 7. Using the perfused forearm technique, we previously succeeded to improve endothelial function and plasma antioxidant capacity in subjects with T2DM by a short‐term treatment with the plasma bilirubin‐increasing drug atazanavir 8. Additional experiments are needed to invigorate these promising findings in the atazanavir model.
Though opportune for translational and clinical studies that require a steady elevation of bilirubin plasma levels, in proof of concept studies the use of atazanavir hampers the attribution of observed effects to bilirubin as atazanavir itself might influence the outcome too. In addition, the atazanavir model does not enable the dose–response relationship of bilirubin to be investigated. The availability of a bilirubin formulation that is suitable for parenteral human use would significantly facilitate the design of such experiments.
In the past, intravenous administration of bilirubin was commonly applied in human research and clinical practice (see Table 1). After 1981, however, no new data on the experimental use of bilirubin in humans was published. Subsequent to an extensive literature study on the former preparation and parenteral use of bilirubin, we developed a production method meeting current standards of good manufacturing practice (GMP). In addition to the intravenous use of the preparation, we also studied its applicability for intra‐arterial administration in the perfused forearm model. Here, we present the method of preparation and the first results on its intravenous and intra‐arterial application in healthy volunteers, including data on its pharmacokinetics and safety. For their exploratory nature, these data are supported by the context of extensive pharmacokinetic and safety data from former reports on the parenteral human use of bilirubin.
Table 1.
Overview of publications on parenteral human use of bilirubin
| Author(s) | Year | Number of subjects | Number of infusions | Dose | Bilirubin level | AE | |
|---|---|---|---|---|---|---|---|
| 1 | Von Bergmann 9, 32 | 1927 | 108 | 120 | 70 mg | 31 (24–38) | Yb |
| 2 | Boshamer 42 | 1928 | 20 | > 46 | 50 mg | NR | NR |
| 3 | Harrop and Barron 43 | 1931 | 27 | 27 | 1 mg kg−1 | NR | NR |
| 4 | Stroebe 44 | 1932 | 16 | 16 | 50 mg | NR | NR |
| 5 | Zadek 45 | 1932 | 10 | 10 | 50 mg | NR | NR |
| 6 | Hofbauer 46 | 1933 | 20 | 20 | 1 mg kg−1 | NR | NR |
| 7 | Dietel 47, 48 | 1933 | 45 | 45 | 50 mg | NR | NR |
| 8 | Binswanger 49 | 1933 | 111 | 111 | 50 mg | NR | NR |
| 9 | Fuge 50 | 1933 | 44 | 54 | 50 mg | 31 (12–63) | NR |
| 10 | Soffer 35 | 1933 | 21 | 31 | 1 mg kg−1 | NR | N |
| 11 | Nürnberger 51 | 1933 | 25 | 25 | 50 mg | 15 (9–22) | NR |
| 12 | Schindel 52 | 1934 | NR | 50 | 50 mg | NR (12–44) | NR |
| 13 | Sullivan 36 | 1934 | 101 | 147 | 1 mg kg−1 | NR | N |
| 14 | Bröchner 53 | 1935 | 65 | 68 | 50 mg | 27 (11–48) | NR |
| 15 | Bröchner 54 | 1935 | 50 | 52 | 50 mg | 31 (17–45) | NRb |
| 16 | Ruhbaum 55 | 1935 | 44 | 44 | 50 mg | NR | NR |
| 17 | Fulde 56 | 1935 | 35 | 36 | 50 mg | NR | NR |
| 18 | Lin 57 | 1937 | 26 | 26 | 10 mg | NR | NR |
| 3 mg kg−1 | |||||||
| 19 | Thompson 33 | 1938 | 10 | 85 | 5–20 mg kg−1 | 250 (38–607) | Yb |
| 20 | Lyon 58 | 1938 | 20 | 20 | 1 mg kg−1 | NR | Yb |
| 21 | Rawls 59 | 1938 | NR | NR | <3 mg kg−1 | NR | NR |
| 22 | Hench 34 | 1938 | 13 | >78 | 1–4 g | NR (342–599) | Yb |
| 23 | Weech 37 | 1941 | 35 | 35 | 5 mg kg−1 | NR (103–151)a | N |
| 24 | Kornberg 38 | 1942 | 65 | 65 | 1.5 mg kg−1 | 63 (37–123) | N |
| 25 | With 25 | 1943 | 63 | 56 | 50 mg | 65 (22–380) | NR |
| 1 | 75 mg | ||||||
| 7 | 100 mg | ||||||
| 4 | 150 mg | ||||||
| 26 | Arpe 60 | 1946 | 19 | 19 | NR | NR | NR |
| 27 | Tisdale 61 | 1959 | 11 | 11 | 15 mg kg−1 | 268 (96–323) | NR |
| 28 | Billing 26 | 1964 | 38 | 38 | 2 mg kg−1 | NR (51–68)a | NR |
| 29 | Schmidt 62 | 1966 | 8 | 8 | 4–6 mg | 46 (19–82) | NR |
| 30 | Raymond 63 | 1966 | 10 | 10 | NR | NR | NRb |
| 31 | Nixon 64 | 1967 | 1 | 1 | 2 mg kg−1 | 84 | NR |
| 32 | Engstedt 65 | 1967 | 21 | 21 | 50 mg | NR | NR |
| 33 | Barrett 31 | 1968 | 29 | 29 | <0.4 mg | NR | NR |
| 8 | 2 mg kg−1 | NR | |||||
| 34 | Berk 11, 24 | 1969–1970 | 53 | 53 | <0.4 mg | NR | NR |
| 35 | Okolicsanyi 27 | 1978 | 119 | 119 | 2 mg kg−1 | NR | Yb |
| 14 | 540 mg | NR (68–154) | |||||
| 36 | Goresky 28 | 1978 | 11 | 11 | 2 mg kg−1 | NR (75–91)a | NR |
| 8 | 6 mg kg−1 | NR (221–275)a | |||||
| 5 | 12 mg kg−1 | NR (426–559)a | |||||
| 37 | Okolicsanyi 29 | 1981 | 29 | 36 | 2 mg kg−1 | NR | NR |
| 38 | Zenerolli 30 | 1982 | 100 | 100 | 2 mg kg−1 | NR | NR |
| Total | 1423 | >1770 | |||||
| Additional information on adverse events | |||||||
| 1 | Fever and chills, 30–45 min after injection, avoidable by use of freshly prepared bilirubin | ||||||
| 15 | 10 patients died of severe infections | ||||||
| 19 | Co‐administration of bile salts; 15 reactions in six patients; Local reactions after repetitive infusions; Systemic reactions both immediate (flushing, tachycardia and headache) and delayed (nausea, vomiting, chills and fever 1 h after administration) | ||||||
| 20 | Two deaths (days 6 and 32 after administration), likely related to a complicated pregnancy | ||||||
| 22 | Venous thrombosis; Strong alkaline mixture; 6–30 infusions per subject | ||||||
| 30 | Authors state that ‘The procedure is safe…’ | ||||||
| 35 | Well tolerated except for mild soreness in the arm after high dose in a few instances | ||||||
Bilirubin plasma levels are expressed in μmol l−1 and depicted as average (range). AE, adverse event; N, no; NR, not reported; Y, yes.
Estimated from incompletely published data.
Additional information on adverse events.
Methods
Preparation
Bilirubin concentrate for infusion (6 mg ml−1, 10 ml vials) for parenteral use in the clinical trial was produced compliant with GMP at the Department of Pharmacy of the Radboud University Medical Center, Nijmegen, The Netherlands. All chemicals were commercially available and used as obtained. All materials were approved on the basis of in‐house quality controls and their suppliers were qualified. The aseptic production process was validated by means of media fills. The drug substance was acquired from Sigma Aldrich (Zwijndrecht, The Netherlands) as bilirubin ≥98% powder. The drug substance was tested for identity, purity, content with spectrophotometric and chemical analysis, and endotoxins with the Limulus Amoebocyte Lysate (LAL) test. The drug product was prepared by dissolving 6 g of bilirubin and 4 g of sodium hydroxide (Spruyt Hillen, IJsselstein, The Netherlands) in 1 l of water for injections. After dissolving, the solution was purged with nitrogen, filtered through a Sartopore 2 XLI (0.35 + 0.2 μm) sterile filter (Sartorius AG, Goettingen, Germany) and, subsequently, sterile vials were filled with 10.2 ml of liquid under a continuous flow of nitrogen. This was carried out at the Department of Pharmacy at the Erasmus Medical Center in Rotterdam, The Netherlands. Quality control and release of the product was performed at the Department of Clinical Pharmacy, Radboud University Medical Center. The drug product was tested for the microbiological aspects bioburden, sterility and endotoxins. Furthermore, labelling, volume, pH, identity and content as well particulate contamination were assessed compliant with European Pharmacopoeia requirements for parenteral preparations. The identity and content was assessed by means of a validated high performance liquid chromatography assay with ultraviolet detection (HPLC‐UV). Prospective stability studies showed a stability of the product for 12 months at −20°C. The final formulation consisted of bilirubin at 6 mg ml−1 in 0.1 m sodium hydroxide with a pH >10. Shortly before administration, the product was passed through a 0.2 μm filter and diluted with human albumin 200 mg ml−1 intravenous solution (Albuman®, Sanquin Plasma Products, Amsterdam, The Netherlands) to a concentration of 1.2 mg ml−1 for intravenous infusion (pH 8.1) and to a concentration of 0.6 mg ml−1 for intra‐arterial infusion (pH 7.6). Based on the molecular weight of bilirubin (584.66 g mol−1) and albumin (66.5 kg mol−1), the molarity for bilirubin and albumin was 2.05 and 2.41 mmol l−1, respectively, for the intravenous solution, and 1.03 and 2.71 mmol l−1, respectively, for the intra‐arterial solution.
Study design
The applicability of our final bilirubin formulation was evaluated in eight healthy volunteers and included the exploration of its pharmacokinetics and safety to verify the results from our review of former reports. Subjects had to be at least 18 and no older than 65 years of age and were not allowed to have a positive history of smoking, drug abuse or liver disease. Women of child‐bearing potential were included only if adequate contraceptive measures had been taken. Except for contraceptives, any use of medication was prohibited. After signing informed consent, all volunteers were screened by means of a complete medical history, physical examination and a limited laboratory evaluation including blood count, renal function and liver enzymes. Subjects with any sign of active disease or laboratory results exceeding twice the upper limit of normal range were excluded. To avoid inclusion of subjects with Gilbert syndrome, baseline plasma levels of total bilirubin were not allowed to surpass 10 μmol l−1 (0.58 mg dl−1).
The experimental design is depicted in Figure 1. For safety reasons, the study protocol initially consisted of a two‐stage design. Both stages were separated by a safety evaluation to enable adjustment of the second stage protocol if needed. During the experiment, a third stage was added to explore bilirubin plasma kinetics after a short high dose intravenous infusion. Intra‐arterial and intravenous dose schedules were adjusted to forearm volume and total body weight, respectively. In all three stages of the protocol, subjects were studied in succession with at least 1 week in between.
Figure 1.
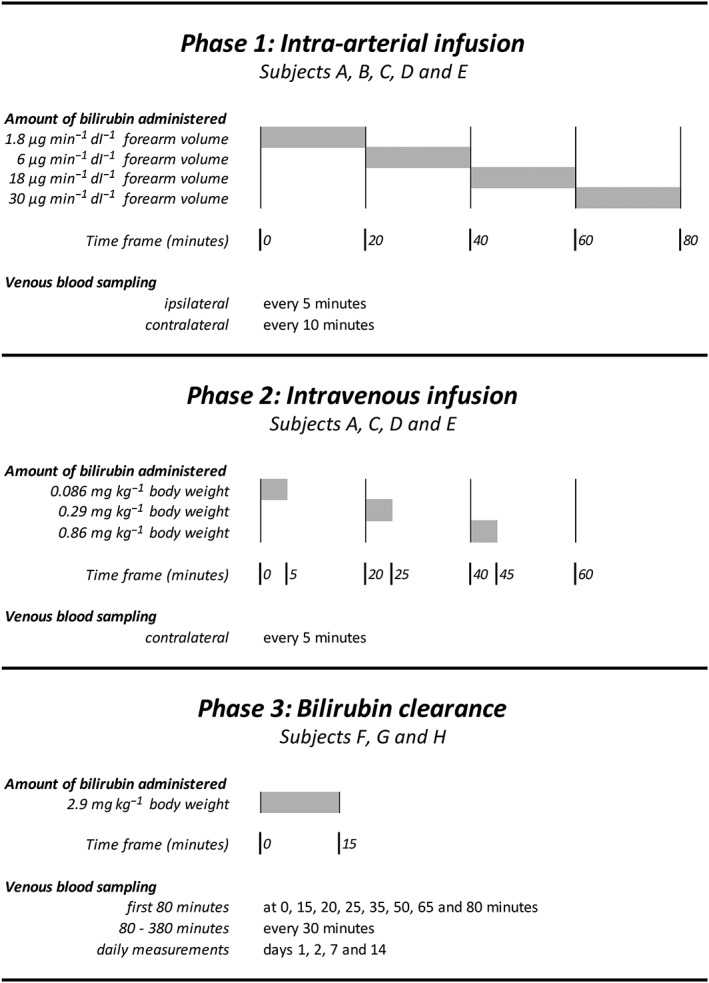
Study design. Bilirubin dosage was adjusted to individual forearm volume in phase 1 and body weight in phases 2 and 3. Grey bars indicate the time of infusion of bilirubin. Venous blood was sampled from the contralateral arm and in phase 1 also from the ipsilateral arm
During the first intra‐arterial stage of the protocol, we aimed for a local increase in bilirubin concentration in the forearm vascular bed without a significant rise of systemic levels. Four increasing doses of bilirubin were infused in the brachial artery, each during 20 min. Based on the assumption of an average brachial artery flow of 2 ml−1 min dl−1 of forearm volume, the lowest intra‐arterial dosage of 1.8 μg min−1 dl−1 of forearm volume was estimated to give an ipsilateral rise of plasma bilirubin concentration of 3 μmol l−1 (0.18 mg dl−1). For the highest intra‐arterial dosage of 30 μg min−1 dl−1 of forearm volume, we expected an ipsilateral rise of plasma bilirubin concentration of 50 μmol l−1 (2.92 mg dl−1). Venous plasma samples were taken every 5 min from both the ipsilateral and the contralateral arm to assess local as well as systemic changes of bilirubin plasma concentration.
During the second stage we aimed for a systemic hyperbilirubinemia. Each of the three intravenous bolus injections was administered over a period of 5 min, followed by a 15 min pause. As others have reported an increase of approximately 30 (range 24–38) μmol l−1 after a single bolus injection of 70 mg 9, we estimated that a single bolus of 233 mg bilirubin would cause an increase in plasma bilirubin level of 100 μmol l−1. For safety reasons and the reported range, we lowered this maximum dose to 200 mg corresponding to an expected average rise of 88 μmol l−1. To enable adjustment to body weight we redefined this maximum dose to 2.9 mg kg−1 body weight assuming an average body weight of 70 kg. The lowest intravenous dosage of 0.086 mg kg−1 body weight was estimated to cause a systemic rise of 2.6 μmol l−1 (0.15 mg dl−1). For the highest intravenous dosage during the second phase, we expected a rise of 26 μmol l−1 (1.52 mg dl−1). Every 5 min, a plasma sample was taken from the contralateral arm.
During the third phase, we explored the pharmacokinetics of bilirubin upon a single intravenous bolus of the maximum dosage of 2.9 mg kg−1 body weight administered over 15 min. Subsequently, plasma bilirubin concentrations were measured frequently over a total period of 6 h. The length of interval between sampling was increased during observation and varied from 5 min immediately upon administration to a maximum of 30 min from the second hour of observation.
During all three stages, heart rate, blood pressure, respiratory rate and body temperature were monitored. All complaints mentioned during participation were listed. After treatment, subjects visited the research unit on days 1, 2 and 7 to check for side effects. Two weeks after participation, subjects underwent a complete medical screening.
Haematological parameters were assessed using an ADVIA 120 Hemalog (Bayer Diagnostic, Tarrytown, NY, USA) and chemical parameters including both direct (i.e. conjugated) and total bilirubin concentrations were determined using an Aeroset (Abbott Laboratories, Abbott Park, IL, USA). For bilirubin concentrations above 5 μmol l−1, precision of the measurement was characterized by a coefficient of variation (CV) of 20%. Below 5 μmol l−1, which concerned seven samples of total bilirubin, the CV was much higher than 20% and therefore these results were excluded.
The initial study protocol and all interim modifications were approved by the local medical research ethics committee (CMO Regio Arnhem‐Nijmegen) and consistent with the Declaration of Helsinki. In addition, we appointed an independent safety monitor and scheduled frequent meetings to discuss all safety data.
Statistics
In general, descriptive data are presented as mean (±SD). All plasma concentrations of bilirubin presented are total (conjugated and unconjugated) bilirubin plasma concentrations. Changes in plasma concentration of total bilirubin upon intra‐arterial or intravenous infusion are depicted as delta. For the intra‐arterial infusion in the first phase of our experiment, the delta reflects the local rise in plasma bilirubin in the forearm vascular bed per dose calculated by the difference between the venous bilirubin concentration in the forearm of administration and the contemporary systemic bilirubin concentration (i.e. the venous bilirubin concentration in the contralateral forearm) at the end of the 20 min infusion period of the dose concerned. For the intravenous infusion in the second phase of our experiment, the delta reflects the systemic rise in plasma bilirubin upon each of the three bolus infusions calculated by the difference between the highest plasma bilirubin concentration observed after each bolus infusion and the baseline concentration observed at the start of the 5 min infusion period of the dose concerned. The individual plasma concentration–time profiles obtained during the third phase of our experiment are depicted in Figure 2.
Figure 2.
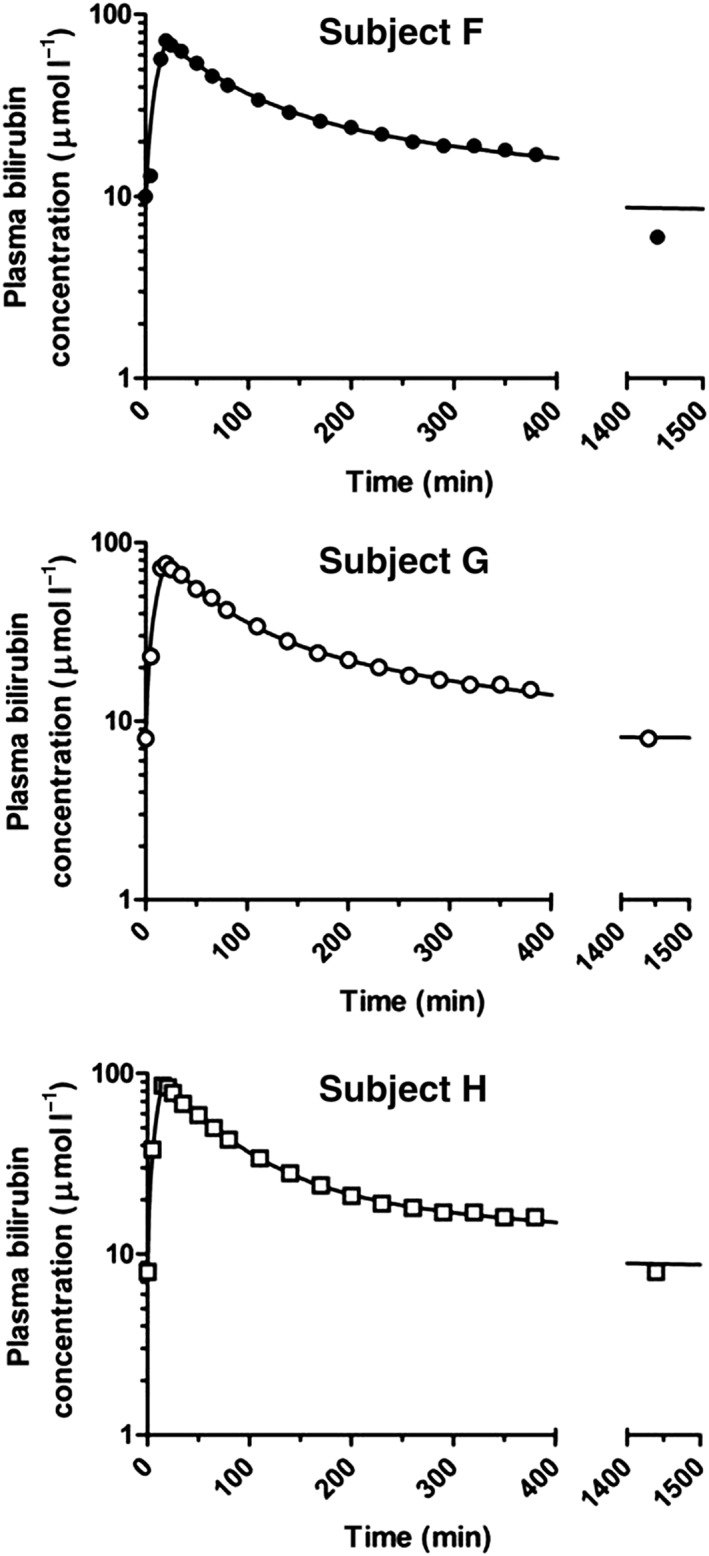
Plasma concentration–time curves of bilirubin after short intravenous infusion of 2.9 mg kg−1 in three healthy male subjects (F, G and H)
For pharmacokinetic analysis, plasma concentration–time data of total bilirubin were analysed with use of WinNonlin (version 6.3; Pharsight, Mountain View, CA, USA) by weighted (1/y) nonlinear regression analysis according to a two‐compartment model with short intravenous infusion, first‐order elimination, and a constant endogenous baseline concentration of bilirubin. The following pharmacokinetic parameters were obtained (Table 4): total area under the curve (AUC), total area under the first moment curve (AUMC), volume of the central compartment (V1), half‐life of the distribution phase (t 1/2,α), half‐life of the elimination phase (t 1/2,β), mean residence time (MRT = AUMC/AUC – T inf/2, where T inf = infusion time), total plasma clearance (CL = D/AUC), and volume of distribution at steady‐state (Vss = CL × MRT).
A summary of supporting pharmacokinetic and safety information from the prior parenteral human use of bilirubin is provided in Table 1.
Nomenclature of targets and ligands
Key ligands in this article are hyperlinked to corresponding entries in http://www.guidetopharmacology.org, the common portal for data from the IUPHAR/BPS Guide to PHARMACOLOGY 10.
Results
Subject screening
As a result of the interim amendment of our protocol, subjects were recruited on two occasions prior to both the first and the additional third phase of the study. In total, 13 subjects were screened, four of which were excluded because of an elevated plasma bilirubin concentration at baseline. The remaining nine subjects were all suitable for inclusion in our study. Eight of them actually participated in the experiments. Five subjects (2 male, 3 female) participated in the intra‐arterial dosing experiment (phase 1) and four (1 male, 3 female) also participated in the intravenous dosing experiment (phase 2). Subject B (male) was willing but, for logistical reasons, unable to participate in phase 2. The course of the plasma concentration of bilirubin upon a single intravenous bolus infusion (phase 3) was studied in three other subjects (all male). All participating subjects were without any active disease. All three female participants used oral contraceptive medication. The average age of the subjects was 21.5 years (range 19–27).
Intra‐arterial (phase 1) and intravenous (phase 2) dosing studies
Although both total and direct bilirubin levels were measured, parenteral administration of our formulation consisting of unconjugated bilirubin bound to albumin, almost exclusively increased total bilirubin levels and hardly affected the plasma levels of direct (conjugated) bilirubin. The local rise of plasma total bilirubin concentration in the forearm vascular bed in response to intra‐arterial administration is depicted in Table 2. During the first intra‐arterial experiments, we experienced technical difficulties. Because of unsuccessful cannulation of the brachial artery during the very first experiment, we decided to administer bilirubin intravenously instead. Consequently, only systemic concentrations and safety data are presented for the first subject. Dislocation of the intra‐arterial needle (second experiment) and temporary obstruction of the sampling system (third experiment) accounted for the remainder of missing values. The intra‐arterial bilirubin dosage needed to increase the local plasma bilirubin concentration in the forearm vascular bed by 1 μmol l−1 amounted to 1.44, 0.75, 0.82 and 0.71 μg min−1 dl−1 of forearm tissue on average for the four subsequent intra‐arterial infusions, respectively. The systemic rise of plasma bilirubin concentration in response to intravenous bolus infusion is depicted in Table 3. The intravenous dosage needed to increase the systemic plasma concentration by 1 μmol l−1 amounted to 0.041 (0.005) mg bilirubin per kg body weight on average.
Table 2.
Individual bilirubin plasma concentrations during intra‐arterial administration
| Subject | Dose (μg min −1 dl −1 ) | Expected rise (μmol l −1 ) | Delta bilirubin concentration (μmol l −1 ) | Average delta (SD; μmol l −1 ) | Increase per 1 μg min −1 dl −1 | ||||
|---|---|---|---|---|---|---|---|---|---|
| A | B | C | D | E | |||||
| FAV (dL) | 10 | 13 | 11 | 11 | 10 | ||||
| Dose 1 | 1.8 | 3 | 1 | 0 | 3 | 1.3 (1.5) | 0.7 | ||
| Dose 2 | 6 | 10 | 5 | 11 | 8.0 (4.2) | 1.3 | |||
| Dose 3 | 18 | 30 | 23 | 18 | 25 | 22.0 (3.6) | 1.2 | ||
| Dose 4 | 30 | 50 | 45 | 27 | 54 | 42.0 (13.7) | 1.4 | ||
The delta resembles the local rise of plasma bilirubin concentration in the forearm per intra‐arterial dose and is depicted by the difference between the venous bilirubin concentration in the forearm of administration and the contemporary systemic bilirubin concentration in the contralateral forearm at the end of the 20 min infusion period of the dose concerned. FAV, forearm volume.
Table 3.
Individual bilirubin plasma concentrations during intravenous administration
| Subject | Dose (mg kg −1 ) | Expected rise (μmol l −1 ) | Delta bilirubin concentration (μmol l −1 ) | Average delta (SD, μmol l −1 ) | Increase per 1 mg kg −1 | |||
|---|---|---|---|---|---|---|---|---|
| A | C | D | E | |||||
| BW (kg) | 62 | 63.5 | 64 | 61.5 | ||||
| Dose 1 | 0.086 | 2.6 | 3 | 2 | 2 | 2.3 (0.6) | 27.1 | |
| Dose 2 | 0.29 | 8.8 | 8 | 6 | 7 | 7 | 7.0 (0.8) | 24.1 |
| Dose 3 | 0.86 | 26.4 | 24 | 21 | 22 | 19 | 21.5 (2.1) | 25.0 |
The delta resembles the systemic rise of plasma bilirubin per intravenous dose and is depicted by the difference between the highest plasma bilirubin concentration observed upon each bolus infusion and the baseline bilirubin concentration observed prior to the administration of the intravenous bolus infusion concerned. BW, body weight.
Pharmacokinetic parameters (phase 3)
The pharmacokinetic characteristics of total bilirubin obtained during the third and final phase of our experiments are depicted in Figure 2 and Table 4. The plasma concentration–time curves could be described best by an open two‐compartment model, taking the endogenous baseline concentration of total bilirubin into account. Figure 2 displays the fitted individual curves of total plasma bilirubin concentrations upon the administration of the single intravenous bolus infusion of 2.9 mg bilirubin per kg body weight. Maximum total bilirubin plasma concentrations of 72, 76 and 86 μmol l−1 were observed in the three subjects studied, respectively. Pharmacokinetic parameters obtained from this analysis are listed in Table 4.
Table 4.
Pharmacokinetic parameters of bilirubin after a single intravenous bolus infusion of 2.9 mg kg−1 of body weight
| Subject (all male) | Individual subjects | Mean (SD) | ||
|---|---|---|---|---|
| F | G | H | ||
| BW (kg) | 82 | 87 | 71 | |
| Dosage (μmol) | 406 | 429 | 351 | |
| Tinf (min) | 15 | 15 | 12 | |
| Cbaseline (μmol l −1 ) | 8 | 8 | 8 | |
| AUC (μmol*min l −1 ) | 1.17 × 10⁴ | 0.97 × 10⁴ | 1.19 × 10⁴ | 1,11 (0.12) × 104 |
| AUMC (μmol*min −2 l −1 ) | 11.0 × 10⁶ | 2.41 × 10⁶ | 3.72 × 10⁶ | 5.71(4.63) × 106 |
| V 1 (l) | 5.8 | 5.2 | 4.0 | 5.0 (0.9) |
| t 1/2,α (min) | 43 | 34 | 42 | 40 (5) |
| t 1/2,β (min) | 280 | 184 | 343 | 270 (80) |
| MRT (min) | 315 | 204 | 333 | 280 (70) |
| CL (ml min −1 ) | 35 | 44 | 29 | 36 (8) |
| Vss (l) | 10.9 | 9.0 | 9.8 | 9.9 (1.0) |
Data are presented as mean (SD). AUC, total area under the plasma concentration–time curve; AUMC, total area under the first moment of the plasma concentration–time curve; BW, body weight; CL, total plasma clearance; t 1/2,α, half‐life of the distribution phase; t 1/2,β, half‐life of the elimination phase; MRT, mean residence time; V1, volume of the central compartment; and Vss, volume of distribution at steady‐state.
Safety
In general, the administration of bilirubin was well tolerated. None of the experiments, including the one that was complicated by displacement of the intra‐arterial needle and consequent extravasation of bilirubin, was associated with side effects during the administration. During the observation period, several adverse events were noted. An overview of all 13 adverse events is provided in the supporting information (Table S1). The majority of these events was mild, self‐limiting and/or clearly unrelated. Three events deserve additional attention. First, one of the subjects suffered from a necrotizing appendicitis 10 days after the intra‐arterial administration of bilirubin. The subject underwent surgery and fully recovered. The event was considered unrelated to our study by both the safety monitor and the independent surgeon. Although the possibility to withdraw informed consent was explicitly discussed, the subject decided to continue participation and did not show any adverse event during the second phase of the experiments. Second, one of the subjects demonstrated an asymptomatic self‐limiting atrial rhythm with a right bundle branch block during the post‐infusion observation period in the second phase of the study. An independent cardiology consultant considered the arrhythmia to be physiologic and unrelated to our study. Additional visits did not reveal any sign of side effects. Third, one of the subjects developed a rash 50 h after a single high dose intravenous bolus injection of bilirubin and albumin. An independent dermatology consultant considered the eruption due to atopic eczema and unrelated to our study. Additional haematological tests and clinical chemistry did not show any sign of systemic side effects. The rash vanished within days after topical application of corticosteroids and symptomatic treatment with cetirizine.
Discussion
Promising preclinical and observational human reports on bilirubin encourage a reintroduction of its parenteral human use for the purpose of translational research 6. Despite a reasonable amount of data on pharmacokinetics and safety of parenteral human use of bilirubin from the past, the compound is currently not commercially available in a proper formulation for human use. Our data demonstrate that it is nevertheless feasible to prepare and apply bilirubin solutions for parenteral human use in accordance with GMP standards. Due to the exploratory nature of our experiments and the associated low number of subjects studied, our pharmacokinetics and safety results should be discussed in the context of previously reported data. Table 1 provides an overview of all available data on the former human use of bilirubin.
Production
The majority of previous publications on the human use of bilirubin report the use of sodium carbonate solutions with high alkalinity. In contrast to these reports, we dissolved bilirubin in sodium hydroxide and diluted this product in a solution with albumin in excess. Similar procedures have been published before for animal experiments and a few human studies 11, 12, 13, 14, 15, 16, 17, 18, 19. Apart from the beneficial reduction of alkalinity, this strategy is consistent with normal in vivo physiologic conditions in which unconjugated bilirubin is tightly bound to albumin 20. In addition, albumin binding has been shown to augment the antioxidant activity of unconjugated bilirubin in vitro 21, 22.
Pharmacokinetics
In preparation of future translational studies on the supposed beneficial impact of bilirubin, we aimed to explore the intra‐arterial use of unconjugated bilirubin and verify the previously reported pharmacokinetic characteristics of intravenously administered unconjugated bilirubin. Our data demonstrate a predictable dose–concentration relationship for both routes of administration, facilitating the design of future translational studies on the therapeutic potential of bilirubin.
During the third phase of our experiments, we studied the pharmacokinetics of unconjugated bilirubin upon a single intravenous bolus infusion. The disposition of unconjugated bilirubin is highly determined by its strong binding to albumin. Its exchange between albumin in plasma and albumin in the interstitial fluid is allowed by a small free fraction, which is estimated to amount only 1/50 000 of total serum bilirubin 20. The volume of distribution (Vss) found in our experiments (Table 4) corresponds to a normal albumin space of 9 l 23. The two phases of the two‐compartment model that was fitted to the plasma concentration–time curve relate to the initial distribution within the albumin space and the true bilirubin clearance by the liver. The corresponding half‐lives are in agreement with values recently predicted by a theoretical model based on the consequences of its strong albumin binding 20. In the past, multiple studies on the clearance of intravenously administered bilirubin have been performed using either small trace‐labelled amounts 11, 24, larger non‐radioactive dosages 25, 26, 27, 28, 29, 30, such as in our experiments, or both 31. Two‐ and three‐compartment models with varying pharmacokinetic characteristics have been proposed. Comparison of data is complicated by the fact that the interpretation of the disappearance curve and selection of the most appropriate compartment model in these older reports was hampered by the lack of current insight into bilirubin physiology. Most authors falsely assumed the presence of a hepatic bilirubin pool 24, 26, 28 and did not consider the importance of the small free fraction of unconjugated bilirubin enabling exchange to albumin within the interstitial space. Notably, our experiments were not designed to gain detailed insight into the pharmacokinetics of bilirubin, but aimed to assess the applicability of our formulation for parenteral human use and explore its pharmacokinetic characteristics in comparison with existing data.
Safety
Whereas the actual administration of bilirubin was well tolerated, several adverse events occurred during the subsequent observation including an appendicitis, an asymptomatic cardiac arrhythmia and a pruritic rash. Although independent expert clinicians considered these events to be unrelated to our experiment, it should be stated that we cannot exclude a causal association between the events and the combined administration of bilirubin and albumin. Moreover, the limited size of our study does not allow any definite conclusion on safety issues. We therefore performed an extensive review of the literature covering over 1750 individual bilirubin infusions over the last century (Table 1). The earliest reports on the human use of bilirubin mentioned the occurrence of side effects consisting of transient chills and fever 32, 33. Hinting at microbial contamination, these effects could be avoided by a switch to the exclusive use of fresh sterile solutions 32. Moreover, immediate effects like flushing, tachycardia and headache have been mentioned upon the combined infusion of bilirubin and bile acids 33. The contemporary use of bile acids obviously complicates the definite attribution of the side effects reported in this study. Importantly, no other study on the human use of bilirubin has mentioned the occurrence of these immediate effects. Finally, the use of large amounts of bilirubin dissolved in an unbuffered alkaline solution has been associated with the frequent occurrence of venous thrombosis 34. These authors reported up to 30 infusions per subject and bilirubin plasma concentrations up to 500 μmol l−1. Though less severe, others have reported mild soreness at the injection site in a few cases of highly dosed bilirubin infusions 27. Notably, the vast majority of reports on the parenteral use of bilirubin have not mentioned any side effect related to its infusion. Several of these reports explicitly mentioned the absence of side effects, covering a total of 278 bilirubin infusions with plasma concentrations up to 150 μmol l−1 35, 36, 37, 38, 39.
In view of the available data, we feel confident to state that parenteral use of bilirubin is safe if produced under GMP conditions and applied in its current dosage and albumin bound formulation. Obviously, future studies should maintain focus on the early detection of side effects and it should be noted that bilirubin pigments currently available on the market are purified from either porcine or bovine gallstones. In our opinion only products of porcine origin should be used to nullify the theoretical risk of prion transmission.
Limitations
Several limitations of this study should be mentioned. First, the number of subjects included to test the applicability of our formulation is too low to permit conclusions on pharmacokinetics and safety characteristics on its own. In view of the yet available knowledge from former experiments and a recent theoretical model, we felt it was more appropriate to perform a thorough review of prior reports than to increase the sample size purely to confirm existing knowledge on these topics.
Second, we adjusted the bilirubin dosage to forearm volume for intra‐arterial administration and to body weight for intravenous administration in order to minimize variability. This strategy resulted in fairly predictable and consistent bilirubin plasma concentrations. It should be noted though that both the forearm volumes and body weights of our subjects were quite similar and within normal range. Additional experiments are needed to confirm the applicability of our dose adjustment strategies in a study population with a larger inter‐individual variability in forearm volume and body weight.
Third, the clearance of bilirubin demonstrates a significant inter‐individual variability which is related to several genetic polymorphisms 39. Most common is the Gilbert syndrome, which is due to a TA‐insertion in the UGT1A1 promotor region and accompanied by a significantly reduced glucuronidation activity to approximately 30% of normal 40. To avoid outliers as a result of the Gilbert syndrome, we excluded subjects with a plasma bilirubin concentration exceeding 10 μmol l−1 during the screening visit. Though less sensitive than the assessment of individual genetic polymorphisms, this approach sufficiently excludes subjects with the Gilbert syndrome 41. In view of the relatively high prevalence of the Gilbert syndrome in the general population, the avoidance of outliers by the exclusion of subjects with high baseline bilirubin concentrations may have caused our clearance data to overestimate the average clearance capacity within the general population.
Finally, we did not assess the impact of our formulation on endothelial function. Additional experiments in healthy volunteers are needed to compare endothelial function during the intra‐arterial infusion of bilirubin and saline as control. To discern the effect of bilirubin from possible interference of co‐administered albumin, subsequent proof of concept studies in subjects with endothelial dysfunction should ideally be performed with an albumin solution as control.
Conclusion
In conclusion, our study reopens the gate to the human parenteral use of bilirubin for the purpose of translational research. Larger studies are needed to evaluate the usefulness of adjusting dose regimens to either forearm volume or body weight and to study the influence of genetic variation on the elimination rate of bilirubin from plasma. Nevertheless, it appears feasible to corroborate the promising preclinical and observational data of bilirubin in human disease models. As such, our data provide a basis for further experiments on the beneficial antioxidant and anti‐inflammatory effects attributed to bilirubin.
Competing Interests
There are no competing interests to declare.
This work was supported by the Dutch Diabetes Research Foundation [grant number 2006.00.055 ]; and the Dutch Burns Foundation [grant number #09.110]. Both funding sources had no role in the conduct of the research and the preparation of the article. David Burger has received honoraria for serving on advisory boards, speaker's fees and educational grants for clinical research from Bristol‐Myers Squibb, the manufacturer of atazanavir. Bristol‐Myers Squibb was not involved in any aspect of the present study. Frank Wagener, Douwe Dekker and Paul Smits have applied for a European patent (European application number 09171529.2) with regard to the therapeutic use of the anti‐inflammatory and anti‐oxidative potential of atazanavir. All authors have read the journal's authorship agreement and policy on disclosure of potential conflicts of interest. We are very grateful to Rob Ter Heine, who contributed to the methods section of our manuscript.
Supporting information
Table S1 Safety data including all adverse events noted during the 2‐week observation period following each phase of the experiments
Dekker, D. , Dorresteijn, M. J. , Welzen, M. E. B. , Timman, S. , Pickkers, P. , Burger, D. M. , Smits, P. , Wagener, F. A. D. T. G. , and Russel, F. G. M. (2018) Parenteral bilirubin in healthy volunteers: a reintroduction in translational research. Br J Clin Pharmacol, 84: 268–279. doi: 10.1111/bcp.13458.
References
- 1. von Bernhard K, Ritzel G, Steiner KU. Über eine biologische Bedeutung der Gallenfarbstoffe. Bilirubin und Biliverdin als Antioxydantien für das Vitamin A und die essentiellen Fettsäuren. Helv Chim Acta 1954; 37: 306–313. [Google Scholar]
- 2. Abraham NG, Kappas A. Pharmacological and clinical aspects of heme oxygenase. Pharmacol Rev 2008; 60: 79–127. [DOI] [PubMed] [Google Scholar]
- 3. Wagener FA, Volk HD, Willis D, Abraham NG, Soares MP, Adema GJ, et al Different faces of the heme‐heme oxygenase system in inflammation. Pharmacol Rev 2003; 55: 551–571. [DOI] [PubMed] [Google Scholar]
- 4. Vitek L. The role of bilirubin in diabetes, metabolic syndrome, and cardiovascular diseases. Front Pharmacol 2012; 3: 55. [DOI] [PMC free article] [PubMed] [Google Scholar]
- 5. McCarty MF. ‘Iatrogenic Gilbert syndrome’ – a strategy for reducing vascular and cancer risk by increasing plasma unconjugated bilirubin. Med Hypotheses 2007; 69: 974–994. [DOI] [PubMed] [Google Scholar]
- 6. Durante W. Bilirubin: striking gold in diabetic vasculopathy? Diabetes 2015; 64: 1506–1508. [DOI] [PMC free article] [PubMed] [Google Scholar]
- 7. Anderson TJ, Phillips SA. Assessment and prognosis of peripheral artery measures of vascular function. Prog Cardiovasc Dis 2015; 57: 497–509. [DOI] [PubMed] [Google Scholar]
- 8. Dekker D, Dorresteijn MJ, Pijnenburg M, Heemskerk S, Rasing‐Hoogveld A, Burger DM, et al The bilirubin‐increasing drug atazanavir improves endothelial function in patients with type 2 diabetes mellitus. Arterioscler Thromb Vasc Biol 2011; 31: 458–463. [DOI] [PubMed] [Google Scholar]
- 9. Eilbott W, von Bergmann G. Funktionsprüfung der Leber mittels Bilirubinbelastung. Z klinische Med 1927; 106: 520–560. [Google Scholar]
- 10. Southan C, Sharman JL, Benson HE, Faccenda E, Pawson AJ, Alexander SPH, et al The IUPHAR/BPS Guide to PHARMACOLOGY in 2016: towards curated quantitative interactions between 1300 protein targets and 6000 ligands. Nucl Acids Res 2016; 44: D1054–68. [DOI] [PMC free article] [PubMed] [Google Scholar]
- 11. Berk PD, Howe RB, Bloomer JR, Berlin NI. Studies of bilirubin kinetics in normal adults. J Clin Invest 1969; 48: 2176–2190. [DOI] [PMC free article] [PubMed] [Google Scholar]
- 12. Bjornbeth BA, Villanger O, Christensen T, Lyberg T, Raeder MG. Large intravenous loads of bilirubin photoconversion products, in contrast to bilirubin, do not cause cholestasis in bile acid‐depleted pigs. Scand J Gastroenterol 1997; 32: 246–253. [DOI] [PubMed] [Google Scholar]
- 13. Bjornbeth BA, Endresen M, Hvattum E, Lyberg T, Villanger O, Raeder MG. Large intravenous bilirubin loads increase the cytotoxicity of bile and lower the resistance of the canalicular membrane to cytotoxic injury and cause cholestasis in pigs. Scand J Gastroenterol 1998; 33: 201–208. [DOI] [PubMed] [Google Scholar]
- 14. Bjornbeth BA, Labori KJ, Hvattum E, Lyberg T, Christensen T, Woldseth B, et al Effect of intravenous bilirubin infusion on biliary phospholipid secretion, hepatic P‐glycoprotein expression, and biliary cytotoxicity in pigs. Scand J Gastroenterol 1999; 34: 1042–1049. [DOI] [PubMed] [Google Scholar]
- 15. Labori KJ, Bjornbeth BA, Hvattum E, Lyberg T, Raeder MG. Intravenous bilirubin, dibromosulfophthalein, and bromosulfophthalein infusions uncouple biliary phospholipid and cholesterol secretion from bile acid secretion by inhibiting hepatic phosphoglycoprotein‐3 activity in pigs. Scand J Gastroenterol 2000; 35: 873–882. [DOI] [PubMed] [Google Scholar]
- 16. Labori KJ, Arnkvaern K, Bjornbeth BA, Press CM, Raeder MG. Cholestatic effect of large bilirubin loads and cholestasis protection conferred by cholic acid co‐infusion: a molecular and ultrastructural study. Scand J Gastroenterol 2002; 37: 585–596. [DOI] [PubMed] [Google Scholar]
- 17. Rozdilsky B. Toxicity of bilirubin in adult animals. An experimental study. Arch Pathol 1961; 72: 8–17. [PubMed] [Google Scholar]
- 18. Veel T, Villanger O, Holthe MR, Skjorten FS, Raeder MG. Intravenous bilirubin infusion causes vacuolization of the cytoplasm of hepatocytes and canalicular cholestasis. Acta Physiol Scand 1991; 143: 421–429. [DOI] [PubMed] [Google Scholar]
- 19. Villanger O, Bjornbeth BA, Lyberg T, Raeder MG. Bile acids protect the liver against the cholestatic effect of large bilirubin loads. Scand J Gastroenterol 1995; 30: 1186–1193. [DOI] [PubMed] [Google Scholar]
- 20. Levitt DG, Levitt MD. Quantitative assessment of the multiple processes responsible for bilirubin homeostasis in health and disease. Clin Exp Gastroenterol 2014; 7: 307–328. [DOI] [PMC free article] [PubMed] [Google Scholar]
- 21. Stocker R, Yamamoto Y, McDonagh AF, Glazer AN, Ames BN. Bilirubin is an antioxidant of possible physiological importance. Science 1987; 235: 1043–1046. [DOI] [PubMed] [Google Scholar]
- 22. Stocker R, Glazer AN, Ames BN. Antioxidant activity of albumin‐bound bilirubin. Proc Natl Acad Sci U S A 1987; 84: 5918–5922. [DOI] [PMC free article] [PubMed] [Google Scholar]
- 23. Levitt DG. The pharmacokinetics of the interstitial space in humans. BMC Clin Pharmacol 2003; 3: 3. [DOI] [PMC free article] [PubMed] [Google Scholar]
- 24. Berk PD, Bloomer JR, Howe RB, Berlin NI. Constitutional hepatic dysfunction (Gilbert's syndrome). A new definition based on kinetic studies with unconjugated radiobilirubin. Am J Med 1970; 49: 296–305. [DOI] [PubMed] [Google Scholar]
- 25. With TK. The bilirubin excretion test as a functional liver test. With remarks on the course of the curve of the serum bilirubin. Acta Med Scand 1943; 116: 96–114. [Google Scholar]
- 26. Billing BH, Williams R, Richards TG. Defects in hepatic transport of bilirubin in congenital hyperbilirubinaemia: an analysis of plasma bilirubin disappearance curves. Clin Sci (Lond) 1954; 27: 245–257. [PubMed] [Google Scholar]
- 27. Okolicsanyi L, Ghidini O, Orlando R, Cortelazzo S, Benedetti G, Naccarato R, et al An evaluation of bilirubin kinetics with respect to the diagnosis of Gilbert's syndrome. Clin Sci Mol Med 1978; 54: 539–547. [DOI] [PubMed] [Google Scholar]
- 28. Goresky CA, Gordon ER, Shaffer EA, Pare P, Carassavas D, Aronoff A. Definition of a conjugation of dysfunction in Gilbert's syndrome: studies of the handling of bilirubin loads and of the pattern of bilirubin conjugates secreted in bile. Clin Sci Mol Med 1978; 55: 63–71. [DOI] [PubMed] [Google Scholar]
- 29. Okolicsanyi L, Orlando R, Venuti M, Dal BG, Cobelli C, Ruggeri A, et al A modeling study of the effect of fasting on bilirubin kinetics in Gilbert's syndrome. Am J Physiol 1981; 240: R266–RR71. [DOI] [PubMed] [Google Scholar]
- 30. Zeneroli ML, Piaggi V, Cremonini C, Gozzi C, Ventura E. Sources of bile pigment overproduction in Gilbert's syndrome: studies with non‐radioactive bilirubin kinetics and with delta‐[3,5‐3H]aminolaevulinic acid and [2‐14C]glycine. Clin Sci (Lond) 1982; 62: 643–649. [DOI] [PubMed] [Google Scholar]
- 31. Barrett V, Berk PD, Menken M, Berlin NI. Bilirubin turnover studies in normal and pathologic states using bilirubin‐14C. Ann Intern Med 1968; 68: 355–377. [DOI] [PubMed] [Google Scholar]
- 32. von Bergmann G. Der functionellen Pathologie der Leber. Klin Wochenschr 1927; 16: 776–780. [Google Scholar]
- 33. Thompson HE, Wyatt BL. Experimentally induced jaundice (hyperbilirubinaemia). Report of animal experimentation and of the physiologic effect of jaundice in patients with atrophic arthritis. Arch Intern Med 1938; 61: 481–495. [Google Scholar]
- 34. Hench PS. Effect of spontaneous jaundice on rheumatoid (atrophic) arthritis. Attempts to reproduce the phenomenon. BMJ 1938; 2: 394–398. [DOI] [PMC free article] [PubMed] [Google Scholar]
- 35. Soffer L. Bilirubin excretion as a test for liver function during normal pregnancy. Bull Johns Hopkins Hosp 1933; 52: 365–375. [Google Scholar]
- 36. Sullivan CF, Tew WP, Watson EM. The bilirubin excretion test of liver function in pregnancy. J Obstet Gynaecol 1934; 41: 347–367. [Google Scholar]
- 37. Weech AA, Vann D, Grillo RA. The clearance of bilirubin from the plasma. A measure of the excreting power of the liver. J Clin Invest 1941; 20: 323–332. [DOI] [PMC free article] [PubMed] [Google Scholar]
- 38. Kornberg A. Latent liver disease in persons recovered from catarrhal jaundice and in otherwise normal medical students as revealed by the bilirubine excretion test. J Clin Invest 1942; 21: 299–308. [DOI] [PMC free article] [PubMed] [Google Scholar]
- 39. Kringen MK, Piehler AP, Grimholt RM, Opdal MS, Haug KB, Urdal P. Serum bilirubin concentration in healthy adult North‐Europeans is strictly controlled by the UGT1A1 TA‐repeat variants. PLoS One 2014; 9: e90248. [DOI] [PMC free article] [PubMed] [Google Scholar]
- 40. Hirschfield GM, Alexander GJ. Gilbert's syndrome: an overview for clinical biochemists. Ann Clin Biochem 2006; 43: 340–343. [DOI] [PubMed] [Google Scholar]
- 41. Borlak J, Thum T, Landt O, Erb K, Hermann R. Molecular diagnosis of a familial nonhemolytic hyperbilirubinemia (Gilbert's syndrome) in healthy subjects. Hepatology 2000; 32: 792–795. [DOI] [PubMed] [Google Scholar]
- 42. Boshamer K. Untersuchungen über die Einwirkung von Äthernarkosen auf die Leberfunktion. J Mol Med 1928; 7: 445–447. [Google Scholar]
- 43. Harrop GA, Barron ESG. The excretion of intravenously injected bilirubin as a test of liver function. J Clin Invest 1931; 9: 577–587. [DOI] [PMC free article] [PubMed] [Google Scholar]
- 44. Stroebe F. Latente Hepatopathie nach Schangerschaftstoxikose. Klin Wochenschr 1932; 11: 495–497. [Google Scholar]
- 45. Zadek E, Tietze A, Gebert K. Zur Wertung der Leberfunktionsprüfungen am Krankenbett. Klin Wochenschr 1933; 12: 60–62. [Google Scholar]
- 46. Hofbauer J. Fortschritte in der Ergründung des Wesens und der ätiologischen Behandlung der Graviditätstoxikosen. Klin Wochenschr 1933; 12: 366–373. [Google Scholar]
- 47. Dietel FG, Polak A. Latente Störung von Leberfunktion und Reticuloendothel nach Eklampsie. Arch Gynecol Obstet 1933; 152: 469–478. [Google Scholar]
- 48. Dietel FG, Polak A. Funktionszustand von Leber und Reticuloendothel nach Nephropathie. Arch Gynecol Obstet 1933; 154: 122–128. [Google Scholar]
- 49. Binswanger H. Leberuntersuchungen bei Alkoholpsychosen, gleichzeitig ein Beitrag zur funktionellen Pathologie der Leber. Eur Arch Psychiatry Clin Neurosci 1933; 100: 619–669. [Google Scholar]
- 50. Fuge K. Die Bilirubinbelastungsprobe der Leber bei der Diagnose der Hepatopathia gravidarum. Arch Gynecol Obstet 1933; 154: 507–521. [Google Scholar]
- 51. Nürnberger L. Zur Kenntnis der Leberfunktion am Ende der normalen Schwangerschaft. Arch Gynecol Obstet 1933; 153: 1–25. [Google Scholar]
- 52. Schindel L, Barth E. Die Bedeutung der Takata‐Reaktion für die Diagnose der Lebererkrankungen in ihrem Verhältnis zur Galaktose‐ und Bilirubin‐Belastung. Klin Wochenschr 1934; 13: 1355–1359. [Google Scholar]
- 53. Bröchner‐Mortensen K. Über Bilirubinbelastung als Leberfunktionsprobe. Acta Med Scand 1935; 85: 1–32. [Google Scholar]
- 54. Bröchner‐Mortensen K. Untersuchung der Leberfunktion bei Patienten mit akuten febrilen Leiden. Acta Med Scand 1935; 14: 229–243. [Google Scholar]
- 55. Ruhbaum W, Matheja W. Leberfunktionsproben bei latenter Leberschädigung. Klin Wochenschr 1935; 14: 1568–1570. [Google Scholar]
- 56. Fulde W. Wert und Methodik verschiedener Leberfunktionsprüfungen für Klinik und Praxis. Klin Wochenschr 1935; 14: 1201–1206. [Google Scholar]
- 57. Lin H, Eastman N. The behavior of intravenously injected bilirubin in newborn infants. Am J Obstet Gynecol 1937; 33: 317–324. [Google Scholar]
- 58. Lyon RA. The bilirubin liver function test in the toxemias of pregnancy. Am J Obstet Gynecol 1938; 36: 99–103. [Google Scholar]
- 59. Rawls WB. Experimentally induced jaundice (comment). Arch Intern Med 1938; 61: 495–496. [Google Scholar]
- 60. Arpe H. Vergleichende Untersuchungen über Leberfunktionsprüfungen nach Felix‐Teske und Von Bergmann‐Eilbott (Belastung mittels p‐Oxyphenylbrenztraubensäure bzw. Bilirubin). Klin Wochenschr 1946; 24–25: 364–366. [DOI] [PubMed] [Google Scholar]
- 61. Tisdale WA, Klatskin G, Kinsella ED. The significance of the direct‐reacting fraction of serum bilirubin in hemolytic jaundice. Am J Med 1959; 26: 214–227. [DOI] [PubMed] [Google Scholar]
- 62. Schmidt D, Grauel EL, Syllm‐Rapoport I. Bilirubinbelastugen bei prämaturen Neugeborenen. Z Kinderheilkd 1966; 69: 19–29. [PubMed] [Google Scholar]
- 63. Raymond GD, Galambos JT. Study of bilirubin clearance of the human liver. Gastroenterology 1966; 50: 862–863. [Google Scholar]
- 64. Nixon JC, Monahan GJ. Gilbert's disease and the bilirubin tolerance test. Can Med Assoc J 1967; 96: 370–373. [PMC free article] [PubMed] [Google Scholar]
- 65. Engstedt L, Johansson S, Nyberg A. Estimation of human erythrocyte life‐span from bilirubin turnover. J Lab Clin Med 1967; 70: 195–203. [PubMed] [Google Scholar]
Associated Data
This section collects any data citations, data availability statements, or supplementary materials included in this article.
Supplementary Materials
Table S1 Safety data including all adverse events noted during the 2‐week observation period following each phase of the experiments