

Abstract
Cell adhesion to neighbouring cells and to the underlying extracellular matrix (ECM) is a fundamental requirement for the existence of multicellular organisms. As such, the formation, stability and dissociation of cell adhesions are subject to tight control in space and time and perturbations within the sophisticated adhesion machinery are associated with a variety of human pathologies. Here, we outline a simple protocol to monitor alterations in cell adhesion to the ECM, for example, following genetic manipulations or overexpression of a protein of interest or in response to drug treatment, using the xCELLigence real-time cell analysis (RTCA) system.
Keywords: xCELLigence, Real-time cell analysis, Cell adhesion, Extracellular matrix, Integrins
Background
The principal molecules responsible for cell adhesion to the underlying ECM are a family of transmembrane heterodimeric receptors named integrins. Integrin activation and binding to the ECM triggers the recruitment of a vast array of signalling, scaffolding and cytoskeletal proteins to the integrin cytoplasmic tails. Together, these adhesion constituents represent a complex and highly dynamic machinery responsible for regulating many important cellular processes including cell proliferation, survival, migration and differentiation. In line with significant roles in maintaining normal physiological functions, dysregulated integrin-mediated adhesion and signalling is a forerunner in the pathogenesis of many human ailments, including bleeding disorders, cardiovascular disease and cancer (Giancotti and Ruoslahti, 1999; Bökel and Brown, 2002; Huveneers and Danen, 2009; Legate et al., 2009 ; Bouvard et al., 2013 ; Calderwood et al., 2013 ; Horton et al., 2015 ; Seguin et al., 2015 ). Therefore, investigation of integrin-dependent cell-ECM adhesions is an intensely studied research topic and of broad interest to many biological fields.
In addition to a variety of other techniques, we ( Georgiadou et al., 2017 ; Lilja et al., 2017 ; Närvä et al., 2017 ) and others ( Kiely et al., 2015 ; Böhm et al., 2016 ; Salmela et al., 2016 ) have used the xCELLigence RTCA system as a simple, yet quantitative, method to monitor changes in cell-ECM adhesion. This technology works by measuring electron flow transmitted between gold microelectrodes, fused to the bottom surface of a microtiter plate, in the presence of an electrically conductive solution such as tissue culture medium (Figure 1). Adhering cells disrupt the interaction between the electrodes and the bulk solution and thus impede electron flow. This impedance (resistance to alternating current) is expressed as arbitrary units called cell index (Figure 1), the magnitude of which is dependent on cell number, cell morphology and cell size and on the strength of cell attachment to the substrate coating the plate. The advantage of using xCELLigence RTCA, as opposed to traditional dye- or microscopy-based analysis of cell adhesion ( Chen et al., 2009 ; Humphries, 2009; Humphries et al., 2009; Chen, 2012), is that a continuous readout, rather than a single time-point or end-point analysis, of cell adhesion can be obtained from the moment the cells begin to attach to the substrate. Moreover, measurements are based on the whole cell population rather than individually selected cells and therefore results are less likely to be subject to bias. However, there are situations where analysing adhesion based on a cell population is flawed. For example, when the effects of protein overexpression or knockdown are being investigated and the transfection efficiency is extremely low, the xCELLigence system will not provide a true reflection of the experimental manipulation on cell adhesion. Indeed, in these cases microscopy based imaging of known adhesion components, to monitor changes in the size and/or morphology of cell-ECM contacts, and the actin cytoskeleton, to monitor cell size and cell spreading, in individual transfected cells would be a more suitable approach. Nevertheless, the inclusion of a 96-well E-plate format within the xCELLigence RTCA single plate (SP) model enables testing of multiple experimental conditions at the same time and in the same plate, thus reducing experimental variability and allowing quick deduction of optimal assay parameters (e.g., ECM ligand concentration or time-point/s of adhesion) for more comprehensive analyses that may require more costly reagents and additional optimisation.
Figure 1. Using the xCELLigence RTCA system to monitor cell adhesion.

A. A simplified cartoon of an E-plate 96 and the gold microelectrodes embedded within each well (top view of a single well) is shown on the left. The number and size of the gold microelectrodes are not representative of the actual set-up and are for illustrative purposes only. The E-plate 96 is placed within the RTCA SP Station (1), which is kept in a humidified incubator and is connected to the RTCA Analyzer (2) and RTCA Control Unit (3). B. Workflow of an xCELLigence adhesion assay. Here, the example assay sets out to determine the optimal concentration of two different ECM ligands (purple and green) needed to promote efficient cell adhesion and to be used for further analyses. 1. The wells in the E-plate 96 are coated with serial dilutions of the ECM ligands or with BSA (yellow) as a negative control. All conditions are performed in triplicate. 2. Coating solutions are removed, wells are washed with PBS and blocked with 0.1% BSA (yellow tube) to prevent non-specific cell adhesion and then incubated with the base medium (pink) that is specific for the cell line of interest. 3. The plate is then placed in the RTCA SP station in the incubator and a reading is taken. Here, a side view of a single well in the E-plate demonstrates unimpeded electron flow from the negative to the positive terminal in the presence of medium alone, which results in a low background reading. 4. Cells are then added to the coated wells (Note: Some wells can be kept cell-free (medium-only wells) as another negative control that should only give background readings). 5. The plate is then placed back into the xCELLigence system and cell adhesion is monitored over time. Here, a side view of a single well in the E-plate demonstrates impeded electron flow from the negative to the positive terminal in the presence of adhering cells, which results in increasing impedance over time as more cells adhere and spread on the microelectrodes. *Impedance in electron flow (resistance to an alternating current) is plotted as arbitrary units called cell index. Background readings: obtained from medium alone (pink line) or from BSA-coated (yellow line) wells. Experimental readings: for simplicity, cell adhesion is shown for one of the ECM ligands (dark to light purple; high to low concentration of ligand) and for one technical replicate only. In this graphical illustration, two concentrations of the ECM ligand resulted in overlapping curves and similarly high cell index values. Therefore, the lower of these two concentrations could be used in subsequent experiments to preserve on material and reduce costs.
We have in the past used xCELLigence RTCA to analyse cell adhesion in MDA-MB-231 (triple-negative human breast adenocarcinoma) cells and HEK293 (human embryonic kidney) cells ( Lilja et al., 2017 ), in MEFs (mouse embryonic fibroblasts) ( Georgiadou et al., 2017 ) and in human iPSCs (induced pluripotent stem cells) ( Närvä et al., 2017 ). We found that loss of the metabolic regulator AMPK ( Georgiadou et al., 2017 ) or the postsynaptic density scaffolding protein Shank ( Lilja et al., 2017 ) promotes cell adhesion to ECM molecules over time, supporting a role for these two proteins as novel inhibitors of integrin function. We have also used xCELLigence to demonstrate the different adhesive properties of human iPSCs following differentiation ( Närvä et al., 2017 ). Here, we will describe the xCELLigence RTCA cell adhesion protocol for HEK293 cells ( Lilja et al., 2017 ) and indicate, where appropriate, the optimisation steps required for other cell types.
Materials and Reagents
Pipette tips
Tissue culture treated dishes (CELLSTAR® 100 x 20 mm, Greiner Bio One International, catalog number: 664160; 6-well, Greiner Bio One International, catalog number: 657160; 96-well, Greiner Bio One International, catalog number: 655160)
Falcon 15-ml conical centrifuge tubes (Corning, Falcon®, catalog number: 352196)
Falcon 50-ml conical centrifuge tubes (Corning, Falcon®, catalog number: 352070)
Microcentrifuge tubes, 1.5 ml (SARSTEDT, catalog number: 72.690.001)
Minisart® 0.45 µm single-use filters (Sartorius, catalog number: 16537-K)
60 ml syringes (BD, catalog number: 300866)
96-well E-plates (E-plate 96) (ACEA Bio, catalog number: 5232368001)
Cell line of interest, e.g., HEK293 cells (ATCC, catalog number: CRL-1573)
Phosphate buffered saline (PBS) (Sigma-Aldrich, catalog number: D1408)
ECM molecule of choice e.g., fibronectin (bovine plasma) (Sigma-Aldrich, catalog number: 341631); collagen (collagen from calf skin) (Sigma-Aldrich, catalog number: C8919)
HyCloneTM HyQTase cell detachment reagent (GE Healthcare, HyCloneTM, catalog number: SV30030.01)
Dulbecco’s modified Eagle’s medium (DMEM) with high glucose (4,500 mg/L) (Sigma-Aldrich, catalog number: D5671)
L-Glutamine (Thermo Fisher Scientific, GibcoTM, catalog number: 25030149)
Fetal bovine serum (FBS) (Sigma-Aldrich, catalog number: F7524)
Trypsin-EDTA for cell culture (Sigma-Aldrich, catalog number: T4049)
≥ 96% pure bovine serum albumin (BSA) (Sigma-Aldrich, catalog number: A8022)
Appropriate growth medium for culturing cell line of interest (see Recipes)
Appropriate base medium to be used in experiment (see Recipes)
Fibronectin-collagen mix (see Recipes)
0.1% BSA (see Recipes)
Equipment
Adjustable-volume pipettes (e.g., Fisher Scientific, model: FisherbrandTM EliteTM)
Water bath
Multichannel pipettes (e.g., Fisher Scientific, model: FisherbrandTM EliteTM)
37 °C, 5% CO2 water jacketed incubator (e.g., Thermo Fisher Scientific, Thermo ScientificTM, model: Series 8000 Water-Jacketed CO2 Incubators)
Cell culture laminar hood (e.g., NuAire CellGardTM)
Tabletop centrifuge for 15 ml and 50 ml conical tubes (e.g., Eppendorf, model: 5804)
Burker cell-counting chamber (e.g., BRAND, catalog number: 719520)
Bright-field microscope (e.g., Olympus, model: CKX41 or ZEISS Axio Vert)
-
xCELLigence RTCA SP Instrument (ACEA Bio, catalog number for complete system: 00380601030) which consists of:
RTCA Analyzer (ACEA Bio, model W830, catalog number: 05228972001)–an electronic analyser that measures, processes and analyses the impedance detected by sensor electrodes
RTCA SP Station (ACEA Bio, catalog number: 05229057001)–E-plate holder that is placed inside the incubator and connects the E-plate to the RTCA Analyzer
RTCA Control Unit (ACEA Bio, catalog number: 05454417001)–laptop with pre-installed RTCA Software
Software
RTCA Software (version number 1.2.1.1002)
Microsoft Excel
GraphPad Prism 6 (version 6.05)
Procedure
Notes:
Perform all steps under sterile conditions.
Avoid touching the underside of the plate where the detectors are located.
Avoid scratching the electrodes located at the bottom of the well. This can occur by pipette tips coming into contact with the electrodes. When removing solutions, tilt the plate slightly and place pipette at the side of the well and gently pipette the solution up.
Pre-warm HyQTase (for detaching cells) and base medium (see Recipes) at 37 °C in a water bath prior to the experiment.
Use at least 3-4 wells as technical replicates for each condition being tested.
Avoid errors in cell counting and/or cell clumping in the E-plate 96 wells by thoroughly mixing the cell suspension and ensuring sufficient cell-cell dissociation prior to counting/seeding. Use multichannel pipettes, where appropriate, to ensure even addition of cells to each well.
Optimise the number of cells plated for every cell line being tested; for monitoring cell adhesion to the ECM, it is best to avoid overcrowding of cells/confluent monolayers.
The maximum recommended volume for each well of an E-plate 96 is 200 μl.
Refer to the troubleshooting guide (see Table 1 in Notes section) for more information.
Table 1. Troubleshooting guide for the xCELLigence cell adhesion assay.
This table contains some advice for common problems that the user may encounter during the assay. However, this table is not exhaustive and users should refer to the manufacturer’s manual for further advice if necessary.
| PROBLEM | Possible reason | Solution | |
|---|---|---|---|
| Abnormal background reading–Step-Status displays error message for some wells | Debris in wells | Wash wells gently with base medium and replace base medium. | |
| Faulty connection |
Check that the RTCA station (E-plate holder) connection to the E-plate 96 is intact. Remove the plate from the E-plate holder, ensure that the contact pads on the E-plate 96 are clean and free of dust and re-insert the E-plate 96. Make sure the E-plate holder has been in the incubator for some time before beginning the experiment. Condensation on the E-plate holder may interfere with the connection to the plate. Make sure the base medium is fully covering the bottom surface of the well. |
||
| Electrodes have become damaged in the process of plate preparation | Exclude well from analysis. Always have at least 3 technical replicates per condition being tested. | ||
| Cell index remains low throughout experiment | Number of cells plated is too low | Plate more cells. Optimise cell numbers using a normal tissue-culture treated 96-well plate first. | |
| Cells did not attach and are floating in the wells (can be observed with a light microscope at the end of the experiment) | Cells may be sensitive to an experimental treatment that manifests after cell detachment and replating. Try performing the assay using normal tissue-culture treated 96-well plates and monitor the toxicity of any treatments towards cells. If cell death cannot be avoided, optimise cell numbers using a normal tissue-culture treated 96-well plate first and plate more cells on the E-plate 96. | ||
| ECM ligand concentration on the plate is not optimal. Use a higher concentration of ligand. Again this can be first tested on a normal tissue-culture treated 96-well plate. | |||
| Cells may take longer to attach | If low cell number is not the cause, it is possible that the chosen cells take longer to attach and spread. If performing the experiment for the first time, record cell adhesion over a longer time frame (3-4 h) to see if the low index values persist. Note, cell index over longer time points may also be influenced by cell proliferation. | ||
| Table 1. Continued | |||
| Cell index is high from the start of the experiment | Too many cells were plated | Optimise cell numbers using a normal tissue-culture treated 96-well plate first and plate fewer cells in the E-plate 96 wells. | |
| Cells were plated in clumps | Thoroughly resuspend cell pellet by pipetting up and down several times and repeat the procedure (pipetting up and down) before adding cells to the E-plate 96 wells. | ||
| Length of sweeps was too long at the beginning of experiment | If high cell number is not the cause, consider the length of the sweeps in the Step after cell addition and add a substep with shorter intervals between sweeps if necessary to observe any fast adhesion events. | ||
| Cell index variable between replicate wells | Cells were plated in clumps | Thoroughly resuspend cell pellet by pipetting up and down several times and repeat the pipetting up and down before adding cells to the E-plate wells. | |
| Cell numbers vary between each replicate | Thoroughly mix the cell suspension as above and consider using a multichannel pipette to dispense the cells in the E-plate 96 wells | ||
-
Preparing the E-plates
Wash wells with 150 μl sterile PBS and then aspirate the buffer.
-
Coat wells with 100 μl ECM molecule of choice or with 100 μl 0.1% BSA (negative control, see Recipes) at 37 °C for 1 h.
Note: The choice of ECM coating will depend on the cells being used. For HEK293 cells, which are weakly adhering cells, we have in the past used a mix of fibronectin and collagen ECM molecules (see Recipes).
Remove coating and wash twice with 150 μl PBS.
Block non-specific cell binding to the E-plate by incubating all wells with 100 μl 0.1% BSA at 37 °C for 1 h.
Remove BSA and wash twice with 150 μl PBS.
Add 50 μl of pre-warmed base medium (see Recipes) into each well and leave the E-plate in the incubator (37 °C), for at least 15 min before starting the experiment, to ensure that the culture medium and E-plate surface achieve equilibrium.
-
Setting up the xCELLigence RTCA program
Note: Program set-up needs to be completed prior to starting the experiment.
Start the RTCA program.
Set up the Exp Notes page (Figure 2A)–select File Directory in which to save the experiment files, fill in the experimental information, such as an experiment date, cell lines and treatments, an experimental procedure, a purpose and any additional information you would like to be saved.
Set up the Layout page (Figure 2B). This page records the experiment layout for the run. Note that unmarked wells will not be scanned. Select a single well or multiple wells (replicates) at once (selected wells will be highlighted). Enter appropriate information for each well, such as cell type, number of cells, used compounds, etc. For example: Cell Type–HEK293, control, Cell number–20,000.
-
Set up the Schedule page (Figure 3) for the plate running procedure. Experiments can be divided into multiple Steps which consist of one or several sweeps. One sweep consists of one scan across all selected wells (one measurement per well).
Step 1 is considered to be the background (baseline) measurement, i.e., a scan of the E-plate prior to addition of cells (wells contain base-medium only). Step 1 is preprogrammed to be one sweep. Do not change the settings for Step 1.
Make a separate Step for each time an E-plate needs to be removed from the RTCA instrument using the Add a Step option (Figure 3) (for example, add Step 2 for cell addition and Step 3 for compound addition).
-
For continuous scanning, without pause, but with different intervals between sweeps, e.g., if measuring events occurring at different rates, use Add a Substep and edit the Interval and Sweeps by entering the appropriate values and click Apply. In the example schedule below the program will pause after Step 1 but will automatically move from Step 2.1 (substep) to Step 2.2 (substep) without the need for manual confirmation. Shorter intervals between sweeps are useful for detecting quick and potentially short-lived events, e.g., initial cell attachment to the substrate.
An example set up for HEK293 cells:
Step 1 (background measurement); 1 sweep (total time 00:00:06).
Step 2.1 (e.g., substep to monitor initial cell attachment to substrate); 16 sweeps, 2 min interval (total time 00:30:06).
Step 2.2 (e.g., substep to monitor subsequent cell spreading and adhesion to substrate); 18 sweeps, 5 min interval (total time 02:00:06).
An example set up for MEFs:
Step 1 (background measurement); 1 sweep (total time 00:00:06).
Step 2 (to monitor cell attachment and spreading); 18 sweeps, 10 min interval (total time 03:00:06).
Note: It is important to optimise the number of sweeps and intervals for your cell line of interest. To avoid wasting E-plates, first use normal 96-well plates to discover the timeline of adhesion for your cells, i.e., while some cells adhere very quickly (few minutes) and spread within 2 h, other cells may take longer to adhere and spread (3-4 h). When performing the xCELLigence adhesion experiment for the first time, you can use short intervals (e.g., as in Step 2.1 above) for 1 h to monitor cell index and then adjust the parameters for the next experiment accordingly.
-
Performing the cell adhesion experiment using xCELLigence RTCA–background reading
Once the program has been set up (see above), place the pre-prepared and pre-warmed E-plate containing 50 μl of base medium into the RTCA SP Station.
Click Start to begin the experiment. This will initiate Step 1 for measuring the background impedance of the base medium. This reading is used as reference impedance for cell index values.
-
A Step-Status will now display TEST. Check the Message page to see if the status and connections of the wells measured are OK.
Important: Exclude any wells that give abnormal readings. Baseline readings are expected to be close to zero. Refer to troubleshooting section (Table 1).
-
After completion of Step 1, the Step-Status displays DONE and the program is ready for the next step.
Note: The RTCA program does not move onto the next Step until it is manually instructed to do so.
Remove the E-plate from the RTCA SP Station and move on to adding cells.
-
Performing the cell adhesion experiment using xCELLigence RTCA–adding cells
Remove the growth medium from HEK293 cells (see Recipes). Wash cells with 5 ml of sterile PBS.
Remove PBS, add 2 ml of pre-warmed HyQtase (volumes are adjusted for a confluent 10 cm culture dish) and incubate plates at 37 °C until all the cells have detached.
-
Add 5 ml of base medium and then collect the cells by centrifugation (180 × g, 4 min).
Note: If you use trypsin to detach cells, it is advised to subsequently inhibit trypsin activity either by using trypsin inhibitors or by adding 5 ml growth medium containing serum. We recommend using HyQtase, or other similar products, rather than digestive enzymes such as trypsin to detach cells for short-term assays where integrin function is under investigation. Integrins are sensitive to trypsin cleavage and therefore use of trypsin can affect the time taken for cells to adhere to the coated E-plates. In some cases, when cells are extremely adherent, the use of trypsin may be unavoidable and required for ECM degradation to break the cell-ECM linkage.
-
Discard the supernatant and re-suspend the remaining cell pellet in 4 ml of base medium.
Important: Pipet up and down gently multiple times to break cell clumps.
Note: If using growth medium to inhibit trypsin, ensure the medium is removed completely following centrifugation, re-wash the pellet with serum-free base medium and repeat the centrifugation step above.
-
Count cells using a method of choice (e.g., Bürker cell counting chamber), prepare a cell suspension of 2 x 10⁵ cells/ml (dilute in base medium) and transfer 100 μl (20,000 cells; optimised for the HEK293 cell line) to each well of the pre-prepared E-plate (already contains 50 μl of base medium; therefore the total volume in each well is now 150 μl).
Note: Cell numbers must be optimised for each cell line of interest so that the cells have enough space to adhere and spread. It is advised to use normal tissue culture treated 96-well plates and a bright-field microscope for this optimisation as the E-plate 96 are more costly. We have in the past used the following cells and cell numbers in xCELLigence cell adhesion assays: MEFs and human telomerase-immortalised fibroblasts: 7,500-10,000; MDA-MB-231 cells: 15,000-20,000; human iPSCs: 50,000. However, these are guidelines only. Different experimental treatments or culture conditions may impact on cell survival or on cell size and it is best to optimise the number of cells accordingly.
Important: When performing a large number of conditions, it is possible that the order in which cells are added to the wells may affect the data. For example, if control cells adhere very quickly, and you expect that treated cells will respond more slowly, this difference may be exaggerated if control cells are always added first to the wells and several minutes have passed before treated cells can be plated. To overcome this potential problem, try using multichannel pipettes whenever possible to speed up cell addition and try changing the order in which cells are added to the wells in biological repeats to see if data are being influenced by the order of cell addition. If this seems to be the case, consider reducing the complexity of the experiment to reduce the intervals between cell plating.
-
Reinsert the E-plate into the RTCA SP Station and click Start to scan Step 2.
Important: The first measurement of Step 2 should be considered as time point 0 when analysing the data.
During the experiment, you can follow the Plot page to see the cell index in real time. To do this, select the well/wells of interest and click Add. By clicking Add All every well included in the experiment is plotted.
After completion of the experiment, open the Plot page, click Add All and select a full-time scale if you wish to collect the data from the entire experiment. If you click Average, the replicate wells (wells with the same name) will be combined and only the average cell index values are exported. Export raw data (cell index versus time) into an Excel spreadsheet by selecting Plate–Export Experiment Info.
Figure 2. Setting up the xCELLigence RTCA program–experimental details.

An example of the Exp Notes (A) and the Layout page (B) for an experiment performed with HEK293 cells is shown. Four technical replicates are included for each condition. Details of the selected well in blue can be seen at the top of the page.
Figure 3. Setting up the xCELLigence RTCA program schedule–Steps and Sweeps.

An example of a Schedule page is shown for HEK293 cells. Step 1 (A) is preprogrammed and should not be changed. Use Add a Step and/or Add a Substep (A) to insert additional experimental steps with different sweeps and intervals in the schedule (B).
Data analysis
For experimental design, to compare two data sets, we perform the xCELLigence adhesion assay a minimum of three independent times. For each experiment, we use a minimum of three technical replicates.
Cell adhesion is presented as changes in mean cell index values in real-time (see graphical illustration in Figure 4). We typically observe standard deviations (SDs) in the range of 0.001-0.15 for technical replicates and 0.02-0.2 for n = 4 biological replicates (the highest SD occurs at the later time points). We perform statistical analysis between the end-point cell index values of the two data sets using GraphPad Prism and the Student’s t-test.
Figure 4. Analysis of xCELLigence cell adhesion results from two data sets.
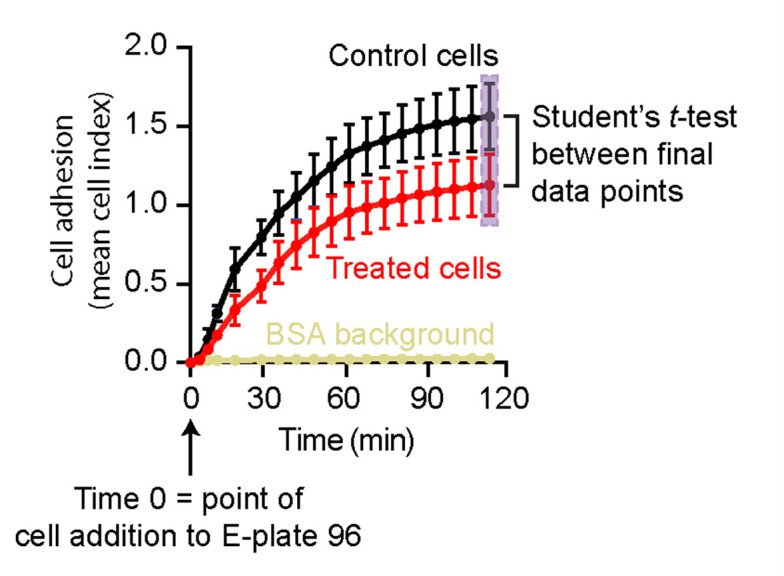
An example analysis of xCELLigence RTCA data shows cell adhesion as mean cell index ± SEM against time. Here, time point 0 denotes the point at which the E-plate 96 was first scanned after cell addition. Initial scanning of the E-plate 96 (Step 1) to monitor background readings in the absence of cells is not included in the analysis. Statistical analyses are performed for the end-point cell index values between two datasets (highlighted by a light purple box).
Notes
The cell adhesion assay is relatively simple and reproducible. However, one common problem associated with this assay is that cells may accumulate in the middle of the well rather than across the whole well after seeding. This will result in inaccurate cell index values and increased variability between experiments. In the xCELLigence manual, it is recommended to keep the plate at RT for 30 min after cell seeding to allow cells to settle to the bottom of the plate; however, this is not an option for the cell adhesion assay as cells will begin to adhere immediately and thus records of these early adhesion events would be lost. Therefore, it is vital that the plate is returned to the RTCA SP Station E-plate holder as soon as possible after cell plating and that Step 2 is started immediately. As outlined in our protocol, we recommend pre-warming the E-plate and medium and thorough mixing of cells before plating and after plating using a multichannel pipette if possible. Additionally, once cells have been seeded, we have found that gentle agitation of the plate on a surface in a clockwise followed by an anti-clockwise direction helps to disperse the cells more evenly across the well. Nevertheless, if performing the assay for the first time or if using a new cell line, in particular epithelial or endothelial cells, which prefer to have cell-cell contacts, we recommend using a normal tissue-culture treated 96-well plate to optimise cell numbers and the technique for cell addition.
The E-plates used here are not suitable for bright-field imaging. Although specialised E-plates can be purchased for the purpose of obtaining phase-contrast images, these are more costly. Moreover, it is not advisable to stop the RTCA program or to remove the E-plate for prolonged periods except for predefined steps such as drug addition. If a visual inspection of the cells is desired, we recommend using a normal tissue-culture treated 96-well plate, set up in exactly the same way (i.e., same coating, blocking and number of cells) and running in parallel to the xCELLigence adhesion assay.
Troubleshooting guide (Table 1)
Recipes
-
HEK293 growth medium
445 ml sterile Dulbecco’s modified Eagle’s medium (DMEM) with high glucose
5 ml sterile 200 mM L-glutamine
50 ml sterile fetal bovine serum (FBS)
Store at 4 °C for up to 1 month
-
HEK293 base medium (growth medium without serum)
495 ml sterile DMEM
5 ml sterile 200 mM L-glutamine
Store at 4 °C for up to 1 month
-
ECM molecule of choice
Fibronectin-collagen mix:
Prepare a mix of 10 μg/ml fibronectin and 20 μg/ml collagen by diluting sterile stock solutions in sterile PBS
Important: Do not filter the working solution as this can lead to the loss of the ECM molecule on the filter. Use only freshly prepared working solutions.
Note: For other cell lines with different adhesive properties, and if using other ECM proteins, it is advised to first test the optimal ECM ligand concentration for your specific experiment (Figure 1).
-
0.1% BSA
Dilute 0.1 g of 96% BSA in 100 ml of sterile PBS and filter sterilise
Use only freshly prepared working solutions
Acknowledgments
This work was supported by grants from the Academy of Finland, ERC Consolidator Grant (615258), the Sigrid Juselius Foundation and the Finnish Cancer Organization. J.L. is supported by Turku Doctoral Programme of Molecular Medicine (TuDMM). This protocol was adapted from procedures published in Georgiadou et al. (2017), Lilja et al. (2017), Närvä et al. (2017). The authors declare no conflicts of interest.
Citation
Readers should cite both the Bio-protocol article and the original research article where this protocol was used.
References
- 1.Böhm M., Apel M., Lowin T., Lorenz J., Jenei-Lanzl Z., Capellino S., Dosoki H., Luger T. A., Straub R. H. and Grässel S.(2016). α-MSH modulates cell adhesion and inflammatory responses of synovial fibroblasts from osteoarthritis patients. Biochem Pharmacol 116: 89-99. [DOI] [PubMed] [Google Scholar]
- 2.Bökel C. and Brown N. H.(2002). Integrins in development: moving on, responding to, and sticking to the extracellular matrix. Dev Cell 3(3): 311-321. [DOI] [PubMed] [Google Scholar]
- 3.Bouvard D., Pouwels J., De Franceschi N. and Ivaska J.(2013). Integrin inactivators: balancing cellular functions in vitro and in vivo . Nat Rev Mol Cell Biol 14(7): 430-442. [DOI] [PubMed] [Google Scholar]
- 4.Calderwood D. A., Campbell I. D. and Critchley D. R.(2013). Talins and kindlins: partners in integrin-mediated adhesion. Nat Rev Mol Cell Biol 14(8): 503-517. [DOI] [PMC free article] [PubMed] [Google Scholar]
- 5.Chen Y.(2012). Cell adhesion assay. Bio Protoc Bio101: e98. [Google Scholar]
- 6.Chen Y., Lu B., Yang Q., Fearns C., Yates J. R. 3rdand Lee J. D.(2009). Combined integrin phosphoproteomic analyses and small interfering RNA-based functional screening identify key regulators for cancer cell adhesion and migration. Cancer Res 69(8): 3713-3720. [DOI] [PMC free article] [PubMed] [Google Scholar]
- 7.Georgiadou M., Lilja J., Jacquemet G., Guzman C., Rafaeva M., Alibert C., Yan Y., Sahgal P., Lerche M., Manneville J. B., Makela T. P. and Ivaska J.(2017). AMPK negatively regulates tensin-dependent integrin activity. J Cell Biol 216(4): 1107-1121. [DOI] [PMC free article] [PubMed] [Google Scholar]
- 8.Giancotti F. G. and Ruoslahti E.(1999). Integrin signaling. Science 285(5430): 1028-1032. [DOI] [PubMed] [Google Scholar]
- 9.Horton E. R., Byron A., Askari J. A., Ng D. H. J., Millon-Fremillon A., Robertson J., Koper E. J., Paul N. R., Warwood S., Knight D., Humphries J. D. and Humphries M. J.(2015). Definition of a consensus integrin adhesome and its dynamics during adhesion complex assembly and disassembly. Nat Cell Biol 17(12): 1577-1587. [DOI] [PMC free article] [PubMed] [Google Scholar]
- 10.Humphries M. J.(2009). Cell adhesion assays. Methods Mol Biol 522: 203-210. [DOI] [PubMed] [Google Scholar]
- 11.Huveneers S. and Danen E. H.(2009). Adhesion signaling- crosstalk between integrins, Src and Rho. J Cell Sci 8): 1059-1069. [DOI] [PubMed] [Google Scholar]
- 12.Humphries J. D., Byron A., Bass M. D., Craig S. E., Pinney J. W., Knight D. and Humphries M. J.(2009). Proteomic analysis of integrin-associated complexes identifies RCC2 as a dual regulator of Rac1 and Arf6. Sci Signal 2(87): ra51. [DOI] [PMC free article] [PubMed] [Google Scholar]
- 13.Kiely M., Hodgins S. J., Merrigan B. A., Tormey S., Kiely P. A. and O'Connor E. M.(2015). Real-time cell analysis of the inhibitory effect of vitamin K2 on adhesion and proliferation of breast cancer cells. Nutr Res 35(8): 736-743. [DOI] [PubMed] [Google Scholar]
- 14.Legate K. R., Wickström S. A. and Fässler R.(2009). Genetic and cell biological analysis of integrin outside-in signaling. Genes Dev 23(4): 397-418. [DOI] [PubMed] [Google Scholar]
- 15.Lilja J., Zacharchenko T., Georgiadou M., Jacquemet G., De Franceschi N., Peuhu E., Hamidi H., Pouwels J., Martens V., Nia F. H., Beifuss M., Boeckers T., Kreienkamp H. J., Barsukov I. L. and Ivaska J.(2017). SHANK proteins limit integrin activation by directly interacting with Rap1 and R-Ras. Nat Cell Biol 19(4): 292-305. [DOI] [PMC free article] [PubMed] [Google Scholar]
- 16.Närvä E., Stubb A., Guzman C., Blomqvist M., Balboa D., Lerche M., Saari M., Otonkoski T. and Ivaska J.(2017). A strong contractile actin fence and large adhesions direct human pluripotent colony morphology and adhesion. Stem Cell Reports 9(1): 67-76. [DOI] [PMC free article] [PubMed] [Google Scholar]
- 17.Salmela M., Rappu P., Lilja J., Niskanen H., Taipalus E., Jokinen J. and Heino J.(2016). Tumor promoter PMA enhances kindlin-2 and decreases vimentin recruitment into cell adhesion sites. Int J Biochem Cell Biol 78: 22-30. [DOI] [PubMed] [Google Scholar]
- 18.Seguin L., Desgrosellier J. S., Weis S. M. and Cheresh D. A.(2015). Integrins and cancer: regulators of cancer stemness, metastasis, and drug resistance. Trends Cell Biol 25(4): 234-240. [DOI] [PMC free article] [PubMed] [Google Scholar]