Summary
RNA polymerase III (Pol III) assembles together with transcription factor IIIB (TFIIIB) on different promoter types to initiate the transcription of small, structured RNAs. Here, we present structures of Pol III pre-initiation complexes comprising the 17-subunit Pol III and hetero-trimeric transcription factor TFIIIB with subunits TATA-binding protein (TBP), B-related factor 1 (Brf1) and B double prime 1 (Bdp1) bound to a natural promoter in different functional states. Electron cryo-microscopy (cryo-EM) reconstructions varying from 3.7 Å to 5.5 Å resolution include two early intermediates in which the DNA duplex is closed, an open DNA complex and an initially transcribing complex with RNA in the active site. Our structures reveal an extremely tight and multivalent interaction of TFIIIB with promoter DNA and explain how TFIIIB recruits Pol III. TFIIIB and Pol III subunit C37 together activate the intrinsic transcription factor-like activity of the Pol III-specific heterotrimer to initiate melting of double-stranded DNA in a mechanism similar as used in the Pol II system.
Keywords: RNA polymerase III, Pol III, TFIIIB, transcription initiation, electron cryo-microscopy
The eukaryotic genome is transcribed by three nuclear DNA-dependent RNA polymerases (RNAPs) with RNA polymerase III (Pol III) transcribing short, structured RNAs, including tRNAs, 5S rRNA and spliceosomal U6 RNA. Large amounts of Pol III transcripts are necessary to allow protein synthesis during cell growth and division, but Pol III must be also carefully regulated1 as increased Pol III transcription has been associated with malignant transformation2–6.
The principal transcription initiation factor of Pol III is TFIIIB consisting of TATA-binding protein (TBP), B-related factor 1 (Brf1) and B double prime (Bdp1). TFIIIB can either be positioned by a strong upstream TATA box, as in the case of the yeast type III genes, or by the six-subunit assembly factor TFIIIC. TFIIIB bound to promoter DNA is capable of directing multiple rounds of transcription in vitro7–9.
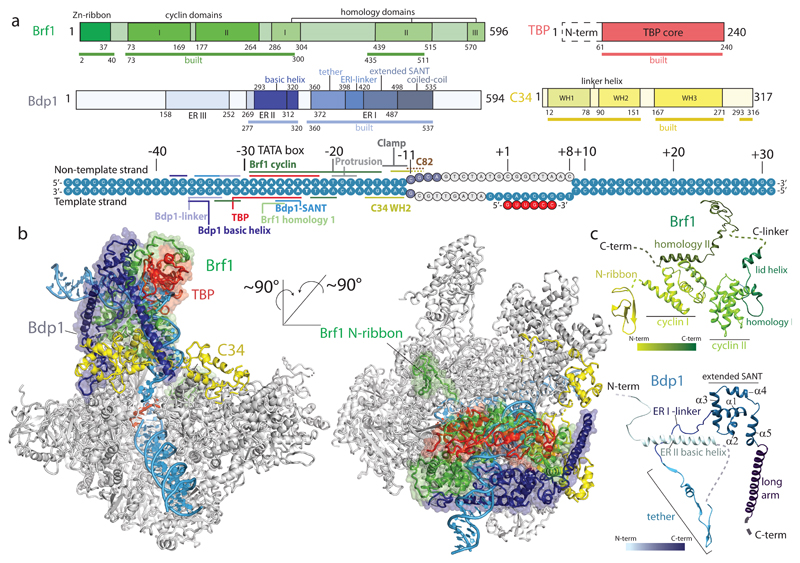
TFIIIB is conserved from yeast to man, and components of TFIIIB show homology to the general transcription factors (TFs) of other RNAPs10. TBP is shared between the Pol I, Pol II and Pol III transcription machineries, although it is dispensable for Pol I in vitro11. The N-terminal half of Brf1 is homologous to the Pol II general transcription factor TFIIB and the Pol I TFIIB-related factor Rrn7, while the C-terminal half of Brf1 is the major interaction hub that holds together the trimeric TBP-Brf1-Bdp1 complex12. Sequence analysis has identified three conserved blocks in the C-terminus13: homology domain I (residues 286-304), homology domain II (residues 439-515) and homology domain III (residues 570-596) (Fig. 1a).
Figure 1. Cryo-EM structure of the Pol III-PIC.
a, Domain organization and conserved regions in TFIIIB and Pol III subunit C34, and DNA transcription scaffold used in this study. Parts of TFIIIB and C34 that are included in the ITC model are underlined and marked as ‘built’. Contacts of TFIIIB and Pol III with the DNA transcription scaffold are indicated. Disordered DNA bases are depicted in light grey. b, Two views of the ITC model. TFIIIB is represented as ribbon and transparent surface, C34 is shown in yellow, other Pol III subunits are colored in grey. c, Ribbon representation of the structures of Brf1 and Bdp1.
Bdp1 contains a highly conserved SANT (Swi3, Ada2, N-Cor, and TFIIIB) domain and a DNA binding linker14 but is predicted to be otherwise disordered. However, three essential regions (ERs) have been defined15 (Fig. 1a). The C-terminal ER I (residues 372-487) contains the SANT domain and flanking regions. ER II (residues 269-312) was cross-linked to promoter DNA16 and is required for TFIIIC-dependent transcription in vitro17. Footprinting and hydroxyl radical probing experiments suggested that ER I and ER II are buried in the PIC, whereas the N-terminal ER III (residues 158-252) is more accessible15,17.
Pol III comprises 17 subunits that include the conserved 10-subunit core, the stalk and two additional subcomplexes, namely the C53-C37 heterodimer and the C82-C34-C31 heterotrimer. The heterodimer is located at the Pol III lobe and is considered to be homologous to the Pol II general transcription factor TFIIF and the Pol I subcomplex A49-A34.5. The heterodimer has been demonstrated to be essential for accurate transcription termination and initiation18–20.
The C82-C34-C31 heterotrimer sits on top of the clamp head and is considered to be homologous to the Pol II general transcription factor TFIIE. C34 contains three winged helix (WH) domains, but the first two domains are disordered in the available cryo-EM structures21. C34 has been shown to be important for the interaction with TFIIIB and open complex (OC) formation22. In order to understand how the Pol III specific subunits interact and facilitate transcription initiation, it is necessary to study them in the context of the pre-initiation complex (PIC) containing TFIIIB.
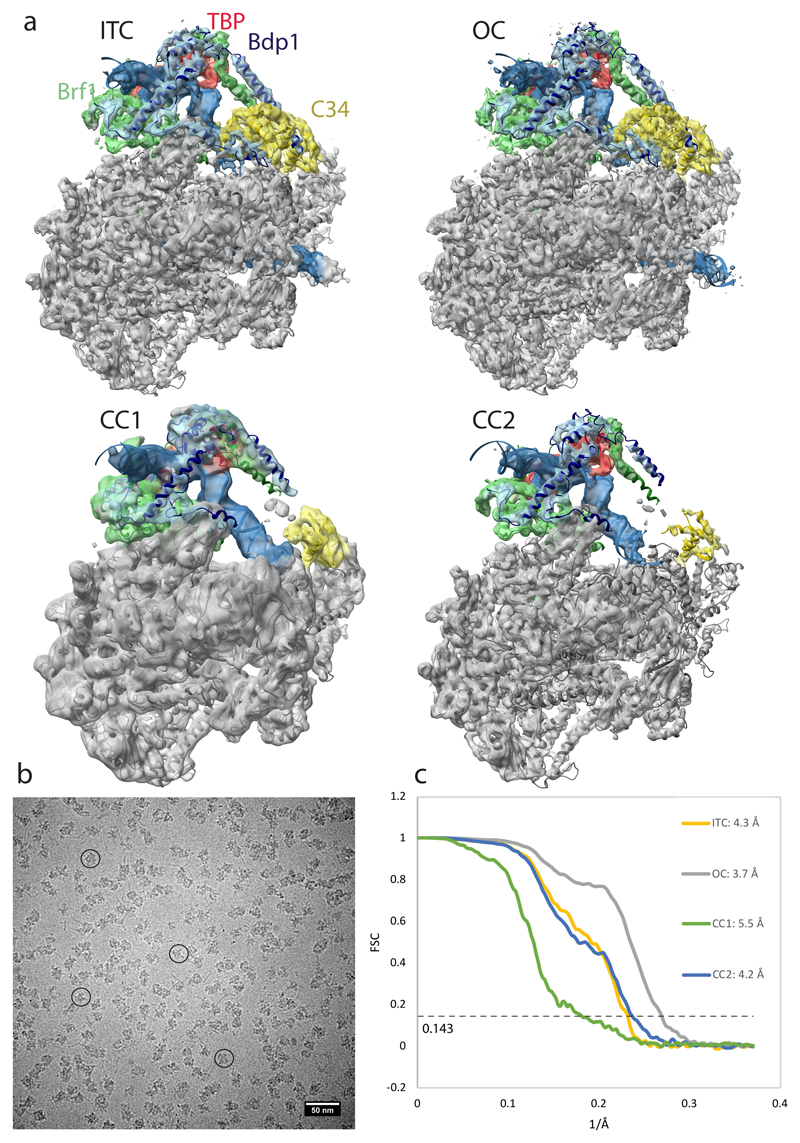
Here, we report the electron cryo-microscopy (cryo-EM) reconstruction of Saccharomyces cerevisiae Pol III-TFIIIB in different functional states. The EM maps range from 3.7 to 5.5 Å resolution (Extended Data Fig. 1) and comprise the PIC bound to a DNA:RNA scaffold (initially transcribing complex, ITC), a spontaneously OC, and two reconstructions of a closed DNA complex (CC). Our results explain how Pol III-specific core subunits and TFIIIB engage in an intricate interaction network to recognize, bind and stabilize upstream promoter DNA, and which structural rearrangements occur during the CC to OC transition.
Cryo-EM of Pol III pre-initiation complexes
Pol III PICs were assembled with recombinant Bdp1, Brf1-TBP fusion protein23 and 81 nucleotide (nt) DNA scaffolds containing the U6 promoter and were crosslinked with glutaraldehyde. Scaffolds were either fully complementary (CC) or contained a mismatch from base pair (bp) -7 to +8 relative to the transcription start site (TSS) and a 6 nt RNA oligonucleotide complementary to +1 to +6 (ITC scaffold, Fig. 1a). After particle classification (Extended Data Fig. 2) the ITC scaffold yielded a reconstruction at 4.3 Å with well-defined DNA and RNA visible at a lower threshold, suggesting partial occupancy due to dissociation during sample preparation or cleavage by C11.
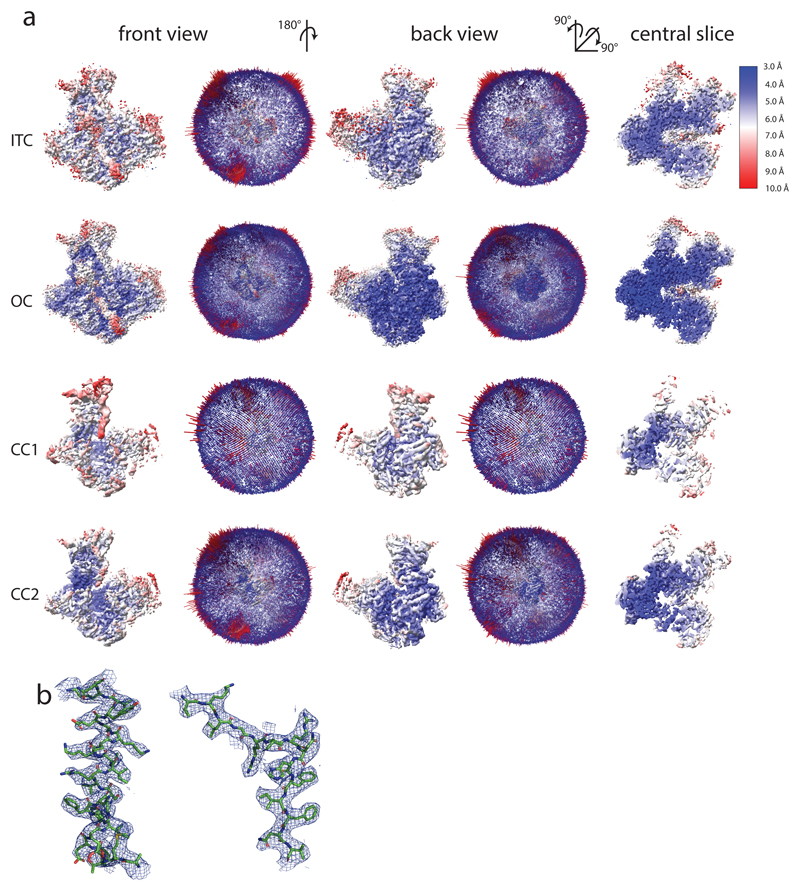
The CC dataset gave rise to reconstructions of a spontaneously formed OC and two CC states. The OC was resolved at 3.7 Å and is almost identical to the ITC, but shows only fragmented density for the template strand in the active site. The two CC reconstructions (CC1 and CC2 at 5.5 Å and 4.2 Å, respectively) differ in the orientation of TFIIIB with respect to Pol III and show a well-defined Pol III core with significantly lower resolution at the periphery (Extended Data Fig. 3).
We built atomic models of the PIC in the CC, OC and ITC states. Local amplitude scaling (LocScale)24 of our maps supported model building. The TFIIIB structure comprises most of Brf1 (Fig. 1a), while for Bdp1 it includes ER II (residues 275-320) and ER I (residues 365-537). In addition, the WH1 and WH2 domains of C34 and a previously disordered “initiation/termination loop” (residues 211-224) in subunit C37, which has been shown to play important roles in both transcription initiation and termination19,20,25,26, become ordered in the ITC and OC structures.
TFIIIB structure in the PIC
TFIIIB adopts an intricate fold in the PIC (Figs 1c, 2). The N-terminus of Brf1 forms a Zn-ribbon that interacts with the Pol III dock (Fig. 1b) and the cyclin domains I and II bind the Pol III wall and upstream promoter DNA (Fig. 1). The Brf1 homology domain I, which follows cyclin II, forms a short “lid” helix that lies on top of the DNA (Figs 1c, 3a). The C-linker connects homology domain I and II but exhibits only weak density in proximity to the Bdp1 SANT domain in agreement with photo-crosslinks and mutagenesis studies27.
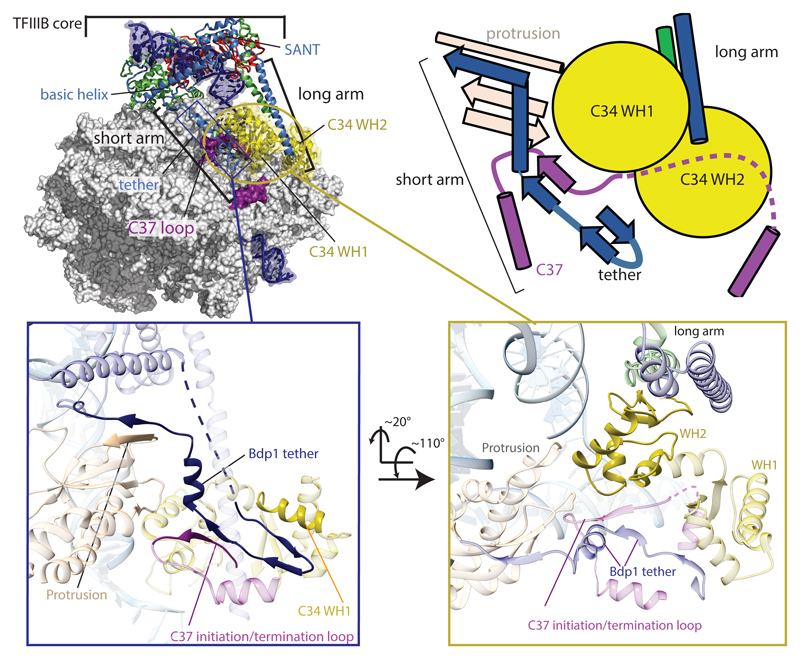
Figure 2. TFIIIB interactions with C34 and C37 in the PIC.
Top panel: Location of TFIIIB on Pol III (left) and schematic view of interactions that stabilize C34 in the position observed in the OC/ITC structures (right). Bottom left: Close up view of the Bdp1 tether. Interactions between Bdp1 tether, Pol III protrusion, C37 initiation/termination loop and C34 WH1 and WH2 are highlighted. Regions that contact the Bdp1 tether are depicted in solid color, other elements are transparent. Bottom right: Close up view of C34 WH2. C34 WH2 is stabilized by both arms of TFIIIB, Pol III protrusion and C37.
Figure 3. Protein-DNA contacts in the Pol III PIC.
a, TFIIIB encircles promoter DNA. Left: Cylinder representation of TFIIIB around the TATA box with DNA represented as surface (left) and electrostatic potential mapped onto the TFIIIB structure (right). b, The transcription bubble is stabilized by Brf1 cyclin I, the Pol III clamp, C34 WH2 and C82 WH4. The non-template DNA strand is stabilized by the C82 cleft loop and C34 WH2.
Brf1 homology domain II is in the same conformation as described in the crystal structure of TBP and Brf1 (residues 437-506)28 (Fig. 3a). We could not model any residues C-terminal of homology domain II, although we observe weak density close to C34 WH3 (Extended Data Fig. 4) that might correspond to Brf1, because Brf1 residue 549 photo-crosslinked to C3427.
The most N-terminal, ordered part of Bdp1 corresponds to ER II, where residues 277-292 interact with cyclin II of Brf1, and residues 293-319 form a “basic” helix containing 14 positively charged residues that runs behind upstream DNA (Figs 1c, 3). The residues connecting ER II to ER I are disordered. ER I is located between C34 WH2 and the heterodimer and forms a β-hairpin that interacts with WH1 and WH2 of C34, and with the C37 initiation/termination loop (Fig. 2), in agreement with photo-crosslinking data25,26. Bdp1 then forms a short helix that runs along the protrusion domain of Pol III followed by a β-strand that extends the anti-parallel β-sheet of the Pol III protrusion by one parallel strand. This part of Bdp1 (residues 360-398), comprising the β-hairpin, the helix, and the β-strand, interacts with three distinct Pol III elements; the protrusion, the previously disordered WH1 and WH2 of C34, and the C37 initiation/termination loop (Fig. 2). We name this element the Bdp1 tether, due to its central position in the PIC that bridges between distant and/or mobile Pol III subunits.
The ER I linker, which is enriched in aromatic residues, inserts into the minor groove of the DNA and connects the tether with the SANT domain (Extended Data Fig. 4). The canonical SANT domain fold is extended by two C-terminal helices (Figs 1, 3a) leading into a long helix (residues 498-536) that forms a coiled-coil with Brf1 homology domain II and ends next to C34 WH2 and WH3.
In summary, TFIIIB forms a compact core centered around the TATA box from which two arms emerge. A short arm, formed by the Bdp1 tether, and a long arm, formed by the Bdp1-Brf1 coiled-coil, bridge the TFIIIB core with the Pol III heterotrimer and heterodimer.
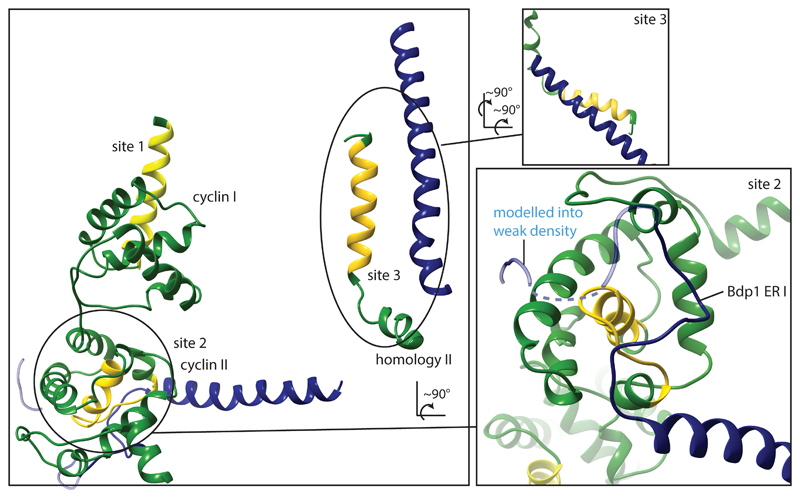
In the TFIIIB structure, Bdp1 appears to compete for the same binding sites on Brf1 as TFIIIC29 (Extended Data Fig. 5) rationalizing the requirement for Bdp1 ER II for TFIIIC-dependent transcription17 and the conformational changes in TFIIIC after incorporation of Bdp130.
Our structure reveals DNA binding elements absent from previous crystallographic studies of TFIIIB14,28 and Pol II paralogues, namely the Brf1 lid helix and the Bdp1 basic helix. Together with the Brf1 cyclin folds, TBP and the Bdp1-SANT and linker domains, they form a positively charged ring around the TATA box (Fig. 3) explaining why promoter bound TFIIIB is so unusually stable8,17,31,32 and can serve as a “roadblock” for Pol II transcription and DNA replication by DNA polymerase33. This “headlock” arrangement illustrates how Bdp1 causes the kinetic trapping of the TFIIIB-DNA complex34. Accordingly, the term “proteinaceous cage” that was coined to describe the TFIIIB-DNA structure almost two decades ago34 is an excellent description of this structure.
TFIIIB coordinates promoter opening
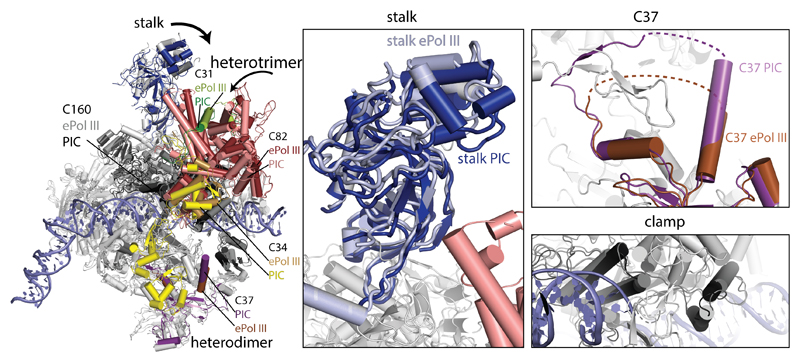
TFIIIB triggers conformational changes in Pol III that are specific to the pre-initiation state and/or render Pol III ready for elongation. In the PIC, Pol III adopts a conformation similar to the “closed clamp”21 state, although the heterotrimer shifts towards upstream DNA, slightly closing the clamp, and the stalk moves towards the heterotrimer, possibly mediated by the proposed C31-stalk contact21 (Extended Data Fig. 6). The C53-C37 heterodimer contributes to stabilizing the PIC by (partial) ordering of the initiation/termination loop, which interacts with the Bdp1 tether and inserts between WH1 and WH2 of C34, concomitant with extension of the adjacent C37-helix (residues 197-202). The C-terminal domain of C11 is disordered, resembling the elongating state. In the active site, the rudder and the trigger loop are disordered and the bridge helix is bent as in elongating Pol III (Extended Data Fig. 7a).
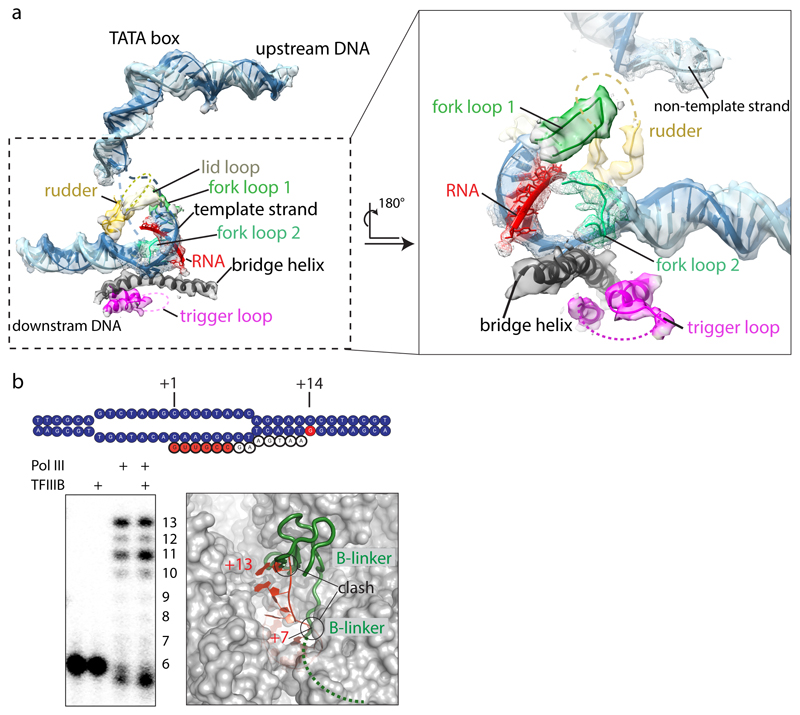
In the ITC, DNA is melted after position -11 relative to the TSS and we could model four nucleotides of the unpaired non-template strand which have been opened in our preparation (Figs 1a, 3b). The upstream bubble edge and adjacent duplex DNA (bp -20 to -10) are stabilized by four different elements: C34 WH2, C82 WH4 including the cleft loop, the clamp core of C160 and Brf1 cyclin I (Fig. 3b). Strikingly, most of these elements are Pol III subunits, with little contribution of TFIIIB.
Our structure explains how in addition to Pol III recruitment DNA-bound TFIIIB also facilitates promoter opening. TFIIIB lacking the Brf1 C-terminal moiety (Δ283-596) is transcriptionally active32, but highly unstable which agrees with our findings that the C-terminal half of Brf1, and Bdp1, have a scaffolding function which stabilizes the C34 WH domains, but are dispensable for DNA melting.
Brf1 and Bdp1 contribute to DNA opening in distinct ways, as has been probed by using mismatched DNA templates that rescue the phenotype of TFIIIB mutants35. Brf1 functions in extending the initial transcription bubble, which is believed to nucleate around bp -936 and propagate towards the TSS; a Brf1 Δ1-68 mutant, lacking the Zn-ribbon and N-linker, can be rescued by introducing a mismatch at bp +2/+6 or -4/+135. These regions are close to the beginning of the N-linker, which is disordered in our structure, but shown to interact with the template strand in TFIIB37,38.
The Bdp1 tether is required for strand separation at the upstream edge of the transcription bubble, as Bdp1Δ355-372 can be rescued by introducing a mismatch in the DNA between bp -9 and -5.
The spatial organization of TFIIIB, with the Brf1 Zn-ribbon and N-linker near the active site, and the Bdp1 tether providing a C34 binding platform near the emerging transcription bubble, together coordinate promoter opening.
Closed DNA complexes
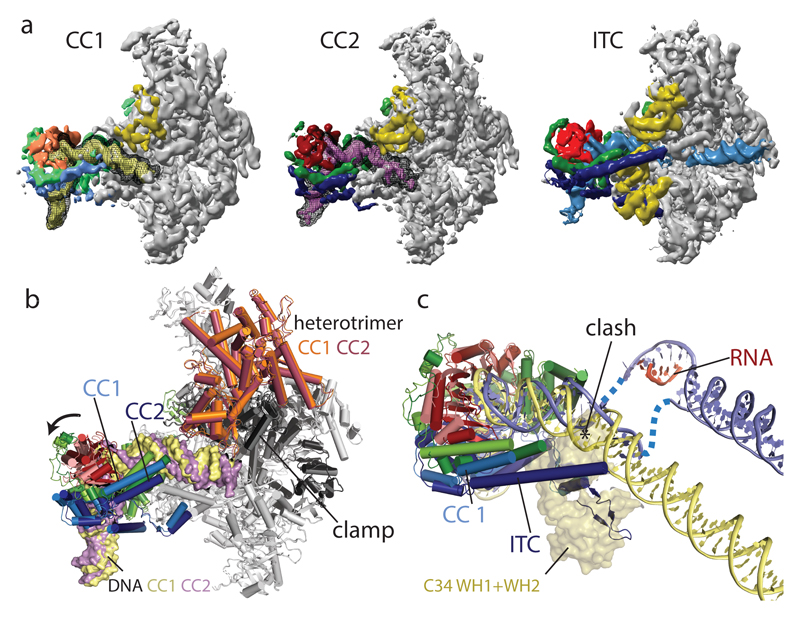
The Pol III closed DNA structures (Fig. 4) show early engagement intermediates of the PIC, as several of the stabilizing interactions seen in the OC and ITC are not established. The C34 WH1 and WH2 are disordered, as are the Bdp1 tether and most of the long arm of TFIIIB and the C37 initiation/termination loop. This suggests that C34 and the TFIIIB arms mutually stabilize each other, and that these interactions can only occur once the DNA has been melted or moved to slightly enter the cleft (discussed below). Accordingly, the resolution in our CC maps declines more strongly in the peripheral regions around the closed DNA and the heterotrimer compared to the OC/ITC maps (Extended Data Fig. 3).
Figure 4. Comparison between Pol III closed complex and open complex structures.
a, EM densities of the CC1, CC2 and ITC with densities corresponding to TBP colored in orange/red, Brf1 colored in green, Bdp1 colored in blue, C34 colored in yellow. CC1 is colored in lighter shades and DNA is colored in pale yellow for CC1 and magenta for CC2. DNA density before B-factor sharpening is shown in addition as black mesh for CC1 and CC2. In the CCs, C34 WH1 and WH2 and the C-terminal part of the Bdp1 coiled-coil helix are disordered. b, Superposition of CC1 and CC2 models shows movement of TFIIIB and the heterotrimer, slightly closing the cleft during the CC1 to CC2 transition. c, Superposition of CC1 and ITC models. DNA for CC1 was further extended with B-DNA to help visualization. The positions of C34 WH1 and WH2 (transparent surface) in the ITC would clash with CC DNA. All models were superimposed on C160.
The upstream DNA is kinked away by the clamp head and the C82 cleft loop in the CCs, resulting in a 30° bend introduced around bp -15. The DNA projects away from Pol III, and no density is visible after bp -2 (bp -5 in CC2), presumably because of the lack of stabilizing protein-DNA contacts (Fig. 4).
The CC1 and CC2 reconstructions differ in the orientations of TFIIIB, upstream DNA, and the heterotrimer. In CC1 the heterotrimer moves away from upstream DNA compared to CC2, slightly opening the clamp (Fig. 4b), and TFIIIB is shifted by up to 6 Å, moving the DNA away from the cleft (Fig. 4c), while CC2 exhibits an overall conformation similar to the OC and ITC states. This suggests that CC2 represents a later stage in the initiation process. Density for DNA extends further in the CC1 map, whereas density for TFIIIB is of better quality in the CC2 map.
The heterotrimer is TFIIF and TFIIE-like
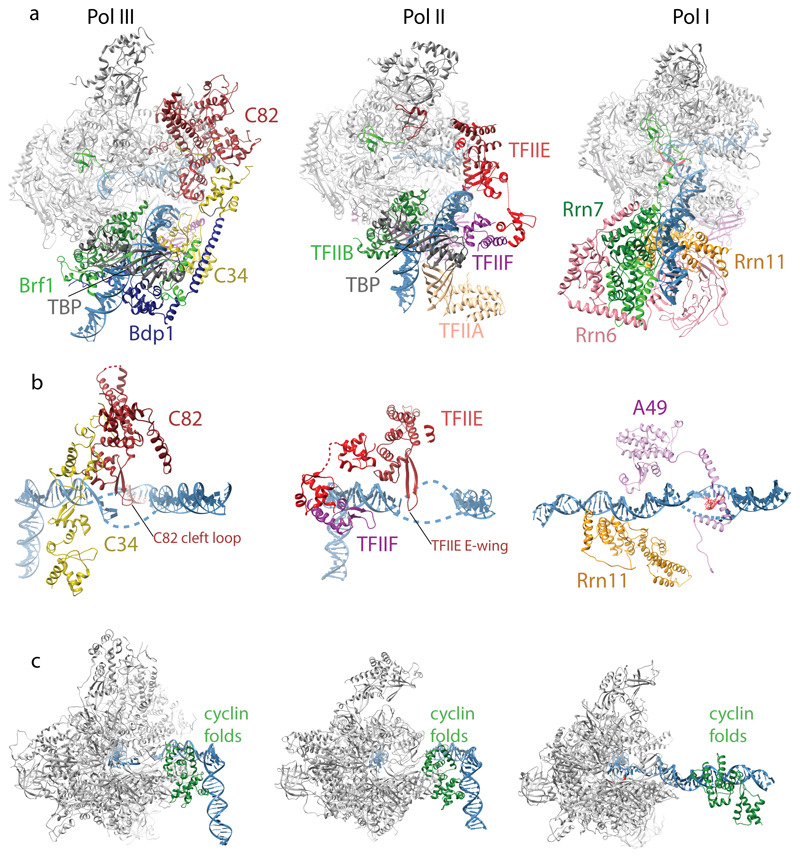
We compared the Pol III OC structure to the yeast Pol II OC (PDB 5fyw) to better understand the roles of general transcription factors and transcription factor-like subcomplexes in both systems (Extended Data Fig. 8). The overall topology of the PICs is highly similar in Pol III and Pol II, as both use an upstream promoter assembly centered on the TATA box that introduces a 90° kink, and a downstream assembly in which several WH domains position the upstream bubble edge along the cleft. In the Pol III PIC, the upstream assembly consists of the TFIIIB core, and in Pol II of TFIIB, TBP (or the much larger TFIID) and TFIIA.
The downstream assembly in Pol III is provided by the heterotrimer where the transcription bubble is stabilized by C34 WH2 and the C82 cleft loop (Fig. 3b, Extended Data Fig. 8b). In the Pol II PIC, TFIIF and TFIIE occupy similar positions as C34 and C82, respectively (Extended Data Fig. 8b). The ‘E-wing’ in TFIIE likely stabilizes the transcription bubble as the C82 cleft loop. Therefore, the overall architecture of the downstream assembly is conserved, further confirming the hypothesis that general transcription factors have been stably incorporated into Pol III during evolution10,39.
Moreover, our structures suggest that the “TFIIE-like” heterotrimer combines functions of both TFIIF and TFIIE, since the heterotrimer contributes equivalent DNA-binding WH-domains as TFIIE and TFIIF. However, similarity between the Pol II and Pol III PICs is restricted to a topological level, as the WH domains in both systems do not superimpose. In particular, the C34 WH2 binds more downstream compared to the Tfg2 WH (Extended Data Fig. 8b), and is thus likely to directly contribute to DNA melting by stabilizing the bubble.
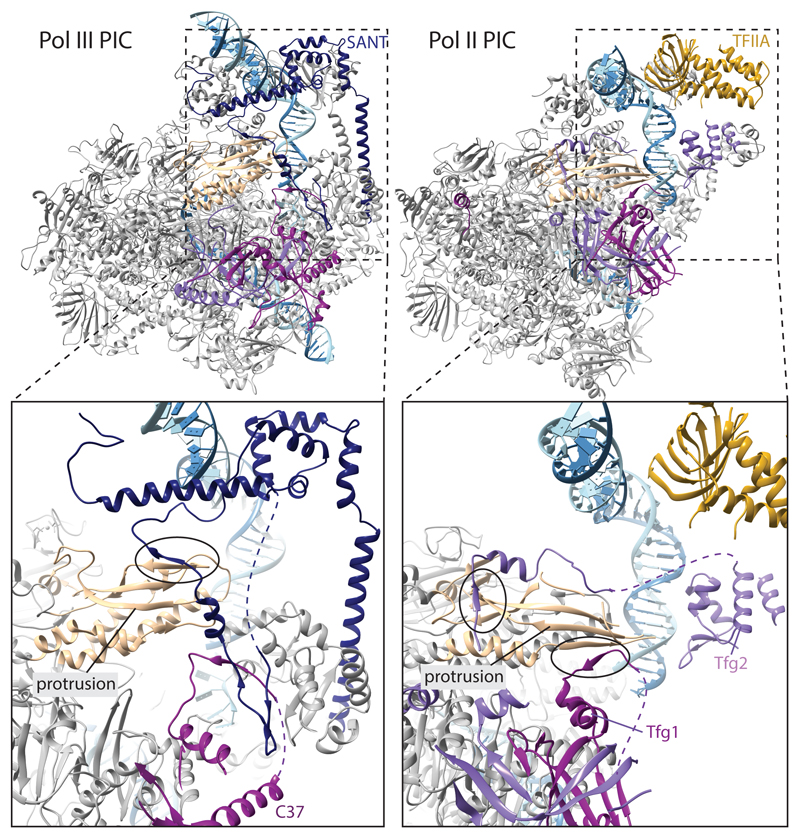
We also notice that the position of the Bdp1 SANT domain in the PIC is similar to TFIIA in the Pol II PIC, and both Bdp1 and TFIIF exchange β-strands with the protrusion (Extended Data Fig. 9), suggesting that Bdp1 combines functions of TFIIF and TFIIA.
Despite the similar overall architecture of the Pol II and Pol III PICs, the way the promoter assemblies are formed is different. Pol III only requires TFIIIB, which forms very stable complexes on promoters and stays bound after each initiation event40, while both arms of TFIIIB provide a scaffold for the inbuilt TF-like subcomplexes of Pol III. This allows Pol III to achieve very high initiation frequencies. In contrast, the minimal Pol II PIC is transient and requires the factors TFIIB, TFIIE, TFIIF and TFIIH, of which TFIIB and pre-formed Pol II-TFIIF have to rebind for each transcription initiation event41–44. This presumably allows for tighter control but results in a lower initiation frequency.
The architecture of the Pol I PIC that comprises the heterotrimeric core factor (CF) and Rrn3 is different from the Pol II and Pol III PICs, as in the Pol I PIC upstream DNA already deeply penetrates the cleft45–47 (Extended Data Fig. 8). In addition, while the cyclin folds of Brf1 and TFIIB contact the polymerase wall, the cyclin folds of Rrn7 do not (Extended Data Fig. 8c). The tWH domain of A49 might provide a ‘downstream assembly’ (Extended Data Fig. 8b) in Pol I, but it is disordered in most cryo-EM reconstructions45–47 and lacks elements equivalent to the C82 cleft loop or the TFIIE E-wing. Therefore, the promoter assembly in Pol I is structurally, and likely mechanistically, different from Pol II and Pol III.
Model of promoter opening
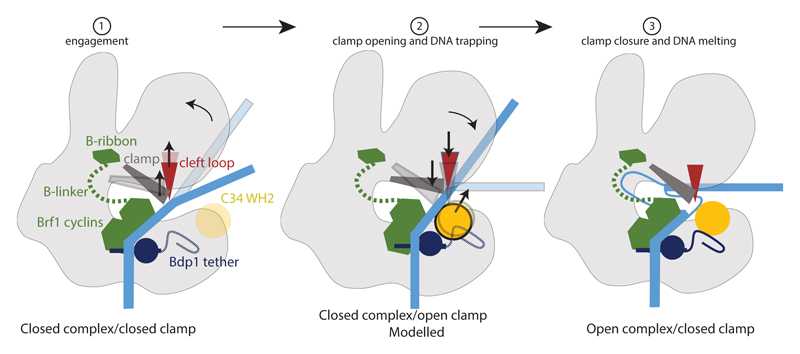
We combined the structures reported here to obtain a model of the DNA melting process (Fig. 5, Supplementary Video 1). We also included a modelled intermediate (CC, open clamp), as we noticed that our CC structure is markedly different from the CCs of yeast and human Pol II. In the Pol II system, DNA runs along the length of the polymerase and interacts with the jaw domain at the downstream end. In our structure, DNA can only be traced until bp -2 and projects away from Pol III. The clamp is in a closed state, the C82 cleft loop blocks access to the cleft, and the C34 WH1 and WH2 are disordered, presumably because they cannot occupy the same position as in the OC because they would clash with DNA (Fig. 4). It is hence likely that the transition from the CC to the OC proceeds via an intermediate in which the clamp is open, similar to human Pol II and bacterial RNAP48,49. We therefore modelled a CC, open clamp intermediate based on the structure of apo Pol III21. In this model, the clamp and the cleft loop move upwards and lie on top of the closed DNA. The C34 WHs can adopt similar positions as in the OC because the steric clash with DNA is removed, but are in closer proximity to the DNA compared to the OC. This would trap DNA in the clamp, and clamp closing would enforce DNA melting by a steric clash of the C82 cleft loop and the DNA duplex, loading the template strand into the active site (Fig. 5, Supplementary Video 1). This process could be driven by the stabilization of the C34 WH2 in the OC conformation by Bdp1, C37 and the protrusion, as described earlier (see Fig. 2).
Figure 5. Mechanism of promoter opening and DNA melting in Pol III.
Schematic drawing of the promoter opening. Initially, the closed DNA is bent away by the C82 cleft loop and the clamp, while the Bdp1 tether and C34 WH1 and WH2 are disordered. Opening of the clamp allows the closed DNA to slide between clamp and lobe. Subsequently, C34 WH1 and WH2 become ordered and enclose double-stranded DNA. Closing of the clamp leads to the downwards movement of the cleft loop and DNA melting, while establishing stabilizing interactions between the Bdp1 tether and C34 WH1 and WH2. The non-template strand is stabilized by Pol III subunits C34 and C82; the template strand is presumably stabilized by the Brf1 linker.
Our model is similar to what has been put forward for Pol II49,50, as both use the coupled movements of the clamp, an extended loop (E-wing/C82 cleft loop) and WH domains (heterotrimer/TFIIE-TFIIF) for promoter opening and nascent bubble stabilization suggesting that basic mechanisms of promoter opening between Pol II and Pol III are conserved.
Methods
Protein expression and purification
Endogenous Pol III was purified as described51 but exchanged into a buffer containing Li2SO4 instead of (NH4)2SO4.
The Brf1-TBP plasmid30 was transformed into BL21 Star (DE3) pRARE E. coli cells. Expression cultures were grown at 37 °C in TB medium to an optical density at 600 nm (OD) of ~1.0, cooled down (for 1 h at 4 °C) and induced with 50 μM IPTG overnight at 16 °C. Cells were pelleted for 5 min at 12,000 g and re-suspended in 3 mL lysis buffer (1M NaCl, 50 mM Tris pH 7.5, 2 mM β-mercaptoethanol (BME), 20% glycerol, 10 μg/mL DNase I, 1 x protease inhibitors (SIGMAFAST protease inhibitor cocktail EDTA free), 30 mM imidazole, 2 mM MgCl2) per gram of pellet. Cells were lysed in an Emulsiflex-C3 homogenizer and the lysate cleared by centrifugation for 1 h at 30,000 g. The supernatant was incubated with 5 mL Ni-NTA resin (Qiagen) for 2 h. Beads were recovered and washed with 100 mL His-A buffer (1 M NaCl, 50 mM Tris pH 7.5, 2 mM BME, 5% glycerol, 30 mM imidazole) and 50 mL His-A low salt (His-A but with 150 mM NaCl) and eluted with 50 mL His-B (200 mM NaCl, 2 mM BME, 5% glycerol, 300 mM imidazole). The eluate was loaded on a 5 mL HiTrap Heparin column (GE healthcare) pre-equilibrated in HepA buffer (like HisB but without imidazole). The column was washed with 6 column volumes (CV) containing 30% HepB (HepA but 1 M NaCl) and eluted with a linear gradient from 30% HepB to 70% HepB over 20 CV. Brf1-TBP eluted at ~600 mM NaCl. Peak fractions were concentrated and applied to a HiLoad 16/600 Superdex 200 size exclusion column equilibrated in 300 mM NaCl, 25 mM HEPES pH 7.5, 5 mM DTT and 5 % glycerol. Purified Brf1-TBP was concentrated to ~6 mg/mL and flash frozen in liquid nitrogen and stored at -80 °C.
The Bdp1 plasmid30 was transformed in BL21 Star (DE3) pRARE E. coli cells and grown in TB medium to an OD of ~1.0, cooled down and induced with 100 μM IPTG overnight at 18 °C. Cell harvesting, lysis and Ni-NTA chromatography were performed as for Brf1-TBP. Eluted proteins were loaded on a 5 mL Heparin column pre-equilibrated in HepA. The column was washed with 6 CV of 20% HepB and eluted with a gradient from 20% HepB to 70% HepB over 30 CV. Peak fractions (~520 mM NaCl) were digested with TEV protease overnight at 4 °C and incubated with 3 mL Ni-NTA for 1 h. The column was washed with 10 mL HepA containing 100 mM imidazole to recover cleaved Bdp1, which bound to Ni-NTA unspecifically. Bdp1 was finally purified by size exclusion chromatography as for Brf1-TBP (but in a buffer containing 150 mM NaCl) and concentrated to ~7 mg/mL. Aliquots were flash frozen in liquid nitrogen and stored at -80 °C.
DNA oligo-nucleotides
For the preparation of pre-initiation complexes, 81-nt long DNA scaffolds based on the U6 gene were used. The sequence contains the U6 promoter from -49 to +31 and, for DNA-RNA hybrid, a 15-nt mismatch from -6 to +8 (template strand: 5’-CCAAATGTCCACGAAGGGTTACTTCGGCAACACATAGTTGCGAAAAAAACATTTATTTATAGTAGCCGAAAATAGTGGACG-3, non-template strand 5’-CGTCCACTATTTTCGGCTACTATAAATAAATGTTTTTTTCGCAGTCTATGCGGTTAACAGTAACCCTTCGTGGACATTTGG-3’, RNA 5’-GUUGCC-3’). For the DNA-RNA scaffold, we scrambled two positions in the template strand that base pair with the RNA (wild type sequence in template strand relative: +1-CAAGCG-+6, scrambled sequence: +1-CAACGG+6) in order to remove an alternative complementary site where the RNA could bind. The closed DNA scaffold contains the wild-type sequence (template strand: 5’-CCAAATGTCCACGAAGGGTTACTTCGCGAACACATAGTTGCGAAAAAAACATTTATTTATAGTAGCCGAAAATAGTGGACG-3’).
Duplex DNA was generated by mixing single-stranded DNA oligo-nucleotides in H2O and heating to 95 °C for 10 min. The reaction was cooled down to 20 °C at a rate of 1.5 °C per min. For the DNA-RNA hybrid, RNA was added to the DNA duplex and heated to 40 °C for 10 min and then cooled down to 4 °C.
Assembly of pre-initiation complexes
For in vitro reconstitution of the Pol III-PIC we resorted to a fusion construct of Brf1 and TBP (Brf1-TBP) that has been shown to substitute Brf1 and TBP function in vitro and in vivo23. For the ITC, we pre-incubated Pol III with the ITC scaffold, which ensures positioning of Pol III with the correct polarity on the transcription bubble due to binding of the DNA-RNA hybrid in the active site. 300 μg of Pol III were incubated with a 1.1x excess of DNA-RNA scaffold for 20 min and Brf1-TBP and Bdp1 were added at a 3x excess for 1 h on ice. Samples were diluted to 0.5 mg/mL (calculated for Pol III) in crosslinking buffer (100 mM Li2SO4, 15 mM HEPES pH 7.5, 10 mM DTT, 5 mM MgCl2, 0.05% glutaraldehyde) and crosslinked on ice for 30 min. Crosslinking was quenched by addition of 40 mM Tris pH 7.5.
For the closed complex, the order was reversed and Brf1-TBP and Bdp1 were incubated with DNA for 20 min to position TFIIIB on the TATA box before Pol III was added. Crosslinked samples were concentrated in spin concentrators (Amicon Ultra, 500 uL, 30 K cutoff) and applied to a Superose 6 increase 3.2/300 column equilibrated in EM buffer (150 mM Li2SO4, 15 mM HEPES pH 7.5, 10 mM DTT, 5 mM MgCl2). 50 uL fractions were collected and the peak fraction was used for cryo-EM grid preparation.
Electron microscopy
Cryo-grids were prepared with a Vitrobot IV set to 100% humidity and 4 °C. Quantifoil 200 mesh Cu 2/1 grids were glow discharged in a Pelco EasyGlow glow discharger and 2.5 μL of sample was applied (blotting parameters: wait time 15 s, blot force 4, blot time 4 s) and plunge-frozen in liquid ethane.
Micrographs were acquired on a Titan Krios operated at 300 keV equipped with a Gatan Quantum energy filter and a K2 Summit direct detector. The detector was operated in super resolution mode at 105,000 magnification and a calibrated physical pixel size of 1.35 Å. Data collection parameters and dataset sizes are shown in Extended Data Table 1.
For all datasets, frame alignment and dose weighting were performed with MotionCor252 and contrast transfer function (CTF) parameters estimated with Gctf53. Particle picking and classification were performed with RELION 2.054.
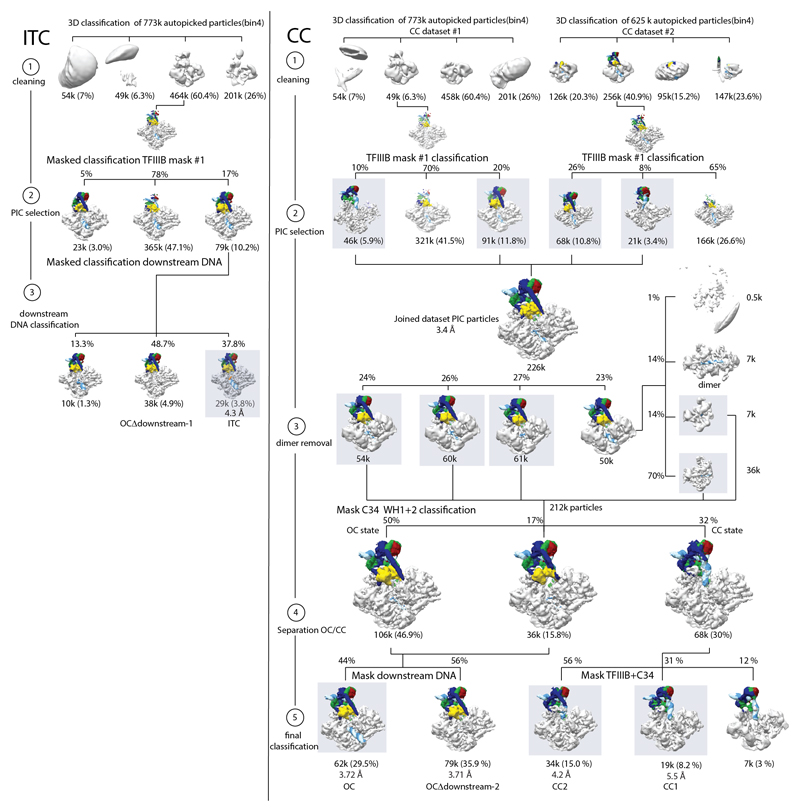
For the ITC dataset 773k auto-picked particles were extracted and binned 4 times to reduce computational costs (Extended Data Fig. 2). Particles were subjected to 3D classification using a 60 Å low-pass filtered model of apo Pol III (PDB 5fj9) without prior 2D classification. The major of the 4 classes contained 60% or 464k particles and showed clear density corresponding to TFIIIB and promoter DNA. Particles of that class were unbinned, extracted in 300 pixel boxes and refined. The resulting volumes showed clearly defined secondary structure elements for TFIIIB, but at a lower threshold compared to the Pol III core. Hence, we performed masked classification using a mask that covers TFIIIB (‘TFIIIB mask #1’), upstream DNA and C34 WH1 and WH2. Out of the three classes, a smaller class with 79k particles (10.2% of autopicked particles) showed very well defined TFIIIB density at the same threshold as the Pol III core. The class had clear density for downstream DNA, but at a lower threshold then upstream DNA. Therefore we performed classification using a mask on downstream DNA. This yielded the OCΔdownstream-1 class (38k particles, 4.9%) and the ITC class (29k particles, 3.8%) maps.
We collected two datasets for the closed complex. Both were initially processed separately as the ITC dataset until the first masked classification using TFIIIB mask #1 (Extended Data Fig. 2). We noticed that a minor class in both datasets had reduced density for C34 WH1 and WH2 and a different path of the upstream DNA. We pooled all particles that had strong TFIIIB density of both CC datasets (particle set “CC_joined”), which contained 226k particles and was refined to 3.4 Å (“Pol III PIC_joined” map). We classified the CC_joined particle set with a global mask (250 Å diameter) and noticed that one class showed stronger DNA density in the cleft as well as additional density adjacent to Pol III. Reclassification of these particles with a 400 Å mask revealed a subset of dimers (3% of CC_joined); in the dimers, two Pol III molecules bind to the same DNA molecule with their cleft (Extended Data Fig. 2). We excluded dimers and pooled all other classes, which we classified using a mask that covered C34 WH1 and WH2. From this we obtained two classes (142k particles, 67% of CC_joined) that exhibited upstream DNA and C34 density as in the ITC/OC1 maps that were pooled was refined to 3.5 Å (not shown), and a minor CC class that had very weak C34 WH1 and WH2 density and showed the path of the upstream DNA (68k particles, 30% of CC_joined). The CC class was further classified using a mask covering TFIIIB and upstream DNA as seen in the CC as well as C34 WH1 and WH2, which yielded the CC2 (34k particles, 15% of CC_joined) and the CC1 reconstructions (19k particles, 8.2% of CC_joined).
We further classified the 3.5 Å OC class using a mask on downstream DNA, which yielded the OC (62k particles, 29% of CC_joined) and a map with disordered downstream DNA OCΔdownstream-2 (79k particles, 35.9% of CC_joined).
Model building
We constructed an initial model by combining the structures of elongating Pol III (PDB 5fj8) and the Brf1-TBP core crystal structure (PDB 1ngm), encompassing TBP residues 61-240 and Brf1 residues 437-506. We next used Phyre255 to calculated homology models of Brf1 (residues 70-270), Brf1 (residues 1-40) and the Bdp1 SANT domain (residues 416-464) and fitted these as well. C34 WH1 and WH2 homology models were based on the NMR structure of the corresponding mouse domains (PDB 2dk8, PDB 2dk5) and generated with Modeller56 and placed into the density. We then extended the Bdp1 structure by manual modelling in COOT57. Towards the C-terminus, we extended the SANT domain with two additional helices that were predicted on a secondary structure level and noticed that a prominent density running in parallel with the Brf1 homology domain II fitted the predicted coiled-coil in Bdp1 perfectly. Towards the N-terminus we manually built the linker and tether regions of Bdp1. Building was aided by secondary structure predictions and bulky side chains that were visible in the EM density (Extended Data Fig. 4). During the preparation of this manuscript, the human TBP-Brf2 (residues 64-407)-Bdp1 (residues 286-407) crystal structure14 became available, giving us additional confidence in assigning the density N-terminal to the Bdp1-SANT domain. Finally, the prominent density running underneath the DNA was assigned to Bdp1 residues 275-320 based on available protein-DNA crosslinks16,58 that placed a region of Bdp1 on the opposite side of TBP and was mapped to Bdp1 residues 299-315. Reported photo-crosslinks of Bdp1 K281 to Brf1 and Bdp1 residues 291-295 to the C128 protrusion gave additional confidence26. Finally, our cryo-EM density in the 3.7 Å map showed side chain density in this region that allowed us to obtain the sequence register (Extended Data Fig. 5). We also used the 3.4 Å “Pol III PIC_joined” map for model building as it showed improved sidechain densities that was helpful especially for building the Bdp1 ER I and Bdp1 tether region.
Local amplitude scaling (LocScale)
LocScale maps were calculated as described24. In brief, unsharpened and unfiltered cryo-EM maps were scaled against simulated model maps using a rolling window corresponding to seven times the average resolution of the cryo-EM map (19 voxels (25.7 Å) for the OC map, 22 voxels (29.7 Å) for the ITC and CC2 map, and 25 voxels (33.8 Å) for the CC1 map). Model maps were simulated from full-sidechain models refined against cryo-EM maps that were sharpened using the relion_postprocess program. The dmin parameter of the LocScale program was set to Nyquist frequency (2.7 Å).
Model refinement and validation
Models were refined against respective EM maps which were B-factor sharpened with relion_postprocess. We used a refinement strategy essentially as described previously21,59 based on PHENIX60 libraries. Geometry statistics were calculated with MolProbity61. The local resolution was calculated with blocres62 using a box size of 20 voxels and a FSC cutoff of 0.5. Figures were prepared with UCSF chimera63 and Pymol 64.
Modelling of the open clamp, closed complex structure
The open clamp, CC model was obtained by combing the structure of open clamp apo Pol III (PDB 5fja) with the DNA of the human Pol II PIC in its closed state (PDB 5iya), which resembles the DNA in the Pol III OC much more than the yeast Pol II OC. The position of C34 was obtained by superimposing C34 from the Pol III OC model (this work) onto the open clamp structure and aligning the WH3 domains. In this model there are only minor clashes between DNA and the Rpb5 subunit in the jaw which could easily be accommodated by a slightly different curvature of the DNA.
RNA extension assay
The RNA extension assay was performed with the DNA oligos and 6-mer RNA described (ITC scaffold). RNA was first radioactively labelled with 32P using T4 polynucleotide kinase and purified over a 15% denaturing urea-polyacrylamide gel. The ITC scaffold was annealed as described above but with the 32P-labelled RNA, and 2 pmol scaffold were pre-incubated with 4 pmol of Pol III for 20 min at 20 °C, followed by incubation with 12 pmol of TFIIIB for 20 min at 20 °C in 20 mM Tris pH 7.5, 200 mM NaCl, 10 mM DTT and 10mM MgCl2. RNA elongation was initiated by addition of 1 mM ATP, GTP and UTP. After incubation for 10 min at 28 °C, RNA extension was stopped by addition of SDS 0.1%, EDTA 30 mM. After phenol extraction and ethanol precipitation, the resulting 32P-labelled RNA products were separated on a denaturing 15 % polyacrylamide-urea gel. RNA bands were detected on an imaging plate (Fujifilm) using a Typhon FLA9500 phosphoimager. The digital image was cropped and contrast was adjusted with the ‘levels’ tool in Photoshop CS6 v13.0.1.
Data availability
Cryo-EM maps of the Pol III ITC, Pol III OC and Pol III CC1 and Pol III CC2 and an intermediate 3.4 Å OC map that aided model building (Pol III PIC_joined, see Methods) have been deposited in the Electron Microscopy Data Base (EMDB) under accession codes EMD-4181 (Pol III ITC), EMD-4180 (Pol III OC), EMD-4182 (Pol III CC1) and EMD-4183 (Pol III CC2) and EMD-4184 (Pol III PIC_joined). The coordinates of the corresponding atomic models have been deposited in the Protein Data Bank (PDB) under accession code 6f41 (Pol III ITC), 6f40 (Pol III OC1), 6f42 (Pol III CC1), 6f44 (Pol III CC2).
Extended Data
Extended Data Figure 1. Pol III PIC cryo-EM analysis.
a, Cryo-EM densities sharpened with relion_postprocess of the Pol III ITC, OC, CC1 and CC2 maps reported here superimposed with the corresponding models. b, Typical micrograph of the Pol III PIC. c, Fourier-shell correlation (FSC) curves for the different cryo-EM maps as reported by the relion_postprocess program.
Extended Data Figure 2. Classification strategies for cryo-EM data sets.
Left panel: ITC dataset. The ITC dataset was cleaned (step 1) by classification in 3D (binned 4 times) and PIC particles were selected using a mask on TFIIIB (step 2). Finally, classification using a mask on downstream DNA yielded the ITC and the OCΔdownstream-1 maps (step 3).
Right panel: Closed complex datasets. Two CC datasets were individually cleaned (step 1) by classification in 3D (binned 4 times) and PIC particles were selected using a mask on TFIIIB (step 2). PIC particles from both datasets were combined and classified without masking to remove a small subset of dimers (step 3). Classification using a mask on C34 WH1 and WH2 yielded the OC and CC populations (step 4) which were subsequently classified into CC1, CC2, OC and OCΔdownstream-2 (step 5). The majority of particles from the CC datasets are in the OC state (67% of PIC particles vs 32% in the CC states, Extended Data Fig. 2), showing that our TFIIIB-Pol III complex is active in promoter opening.
Focused classification on downstream DNA in the ITC and CC datasets gave rise to reconstructions which show OC-like upstream DNA but lack downstream DNA (OCΔdownstream). This might suggest the existence of an initiation intermediate in which downstream DNA is mobile and only becomes ordered in a later stage of the transcription cycle, as it has also been described for bacterial RNA polymerase48. An alternative explanation for the lack of density in the OCΔdownstream map derived from the CC scaffold lies in the pseudo-symmetric nature of the U6 TATA box28. Since we used a wild-type promoter sequence, a subset of particles may have bound the DNA scaffold with reverse polarity, making the “downstream” DNA too short to be stabilized in the cleft. However, we favor the former explanation, as we also observe OCΔdownstream in the ITC dataset where the polarity is defined by incubating Pol III with the pre-formed transcription bubble.
Extended Data Figure 3. Local resolution, Euler angular distribution and side chain densities.
a, Cryo-EM maps colored by local resolution from 3 Å (dark blue) to 10 Å (red). All maps are shown on the same contour level. Central slices show that the local resolution degrades more strongly in the CC2 map compared to the ITC map, although they have comparable overall resolutions. Euler angular distribution plotting shows a good angular coverage without a dominating preferred orientation in all reconstructions. b, Examples of helical and β-strand densities in Pol III subunit AC40 in the 3.7 Å OC map.
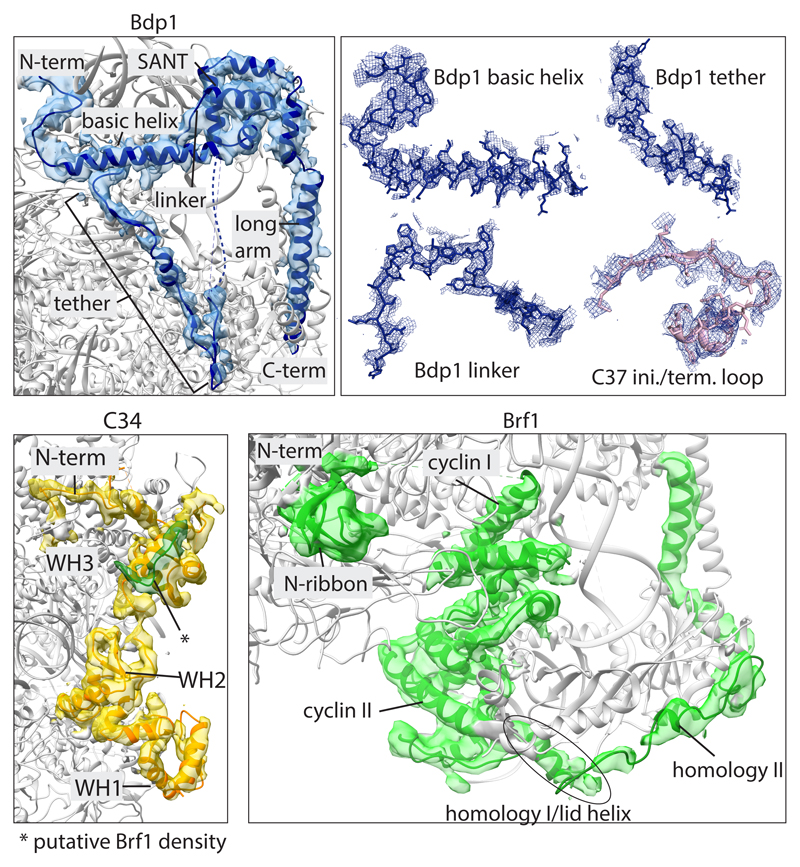
Extended Data Figure 4. EM density for newly modelled regions.
Cryo-EM densities in the ITC map of Bdp1, C34 WH1 and WH2, and Brf1 after amplitude scaling contoured at a level that allows visualization of most residues. Top right panel shows sidechain models and EM densities for de novo built regions.
Extended Data Figure 5. Bdp1 partially masks binding sites for TFIIIC in Brf1.
Brf1 regions that have been mapped to interact with TFIIIC are shown in yellow29. Site 2 and 3 are partially buried by Bdp1 in the PIC. The right panel shows a close-up of site 2. Parts of Bdp1 are shown as transparent that could be built but were not included in the final model due to lack of sequence register and weak density. Bdp1 appears to compete for the same binding sites on Brf1 as TFIIIC suggesting that correct assembly of TFIIIB might trigger the conformational rearrangements in the assembly factor TFIIIC that render the complex initiation competent.
Extended Data Figure 6. Comparison between Pol III in the OC and elongating states.
Superposition of elongating Pol III (ePol, PDB 5fj8) and Pol III in the OC. In the OC, the heterotrimer moves towards upstream DNA and the C34 WH1 and WH2 domains become ordered. The stalk moves towards the heterotrimer, and the clamp moves to slightly close the cleft. The C37 initiation/termination loop becomes partially ordered to interact with the Bdp1 tether and C34 WH1 and WH2.
Extended Data Figure 7. Active site and nucleic acid density in the ITC.
a, EM density in the ITC map after amplitude scaling of active site elements and nucleic acids. Elements contoured at a lower threshold are shown as mesh. Active site elements are labelled. The rudder and trigger loops are disordered. Poor density for RNA suggests flexibility or partial occupancy due to dissociation during sample preparation or cleavage by C11. b, RNA extension assay of the 32P-labelled 6-nt RNA in absence of CTP, showing that our preparation is active in transcription using our ITC scaffold. Addition of TFIIIB leads to a stronger accumulation of 11-nt RNA. Modelling of an elongated RNA oligonucleotide based on PDB 5m5x shows that RNA clashes at positions +7 with the beginning of the flexible B-linker, and at position +13 with the B-ribbon. Accumulation of 11-nt RNA in presence of TFIIIB suggests that the RNA in the Pol III-PIC takes a different path compared to the Pol I elongation complex, and clashes with the B-ribbon at position +12, requiring release of TFIIIB to enter elongation. The experiment was repeated three times independently with the same results.
Extended Data Figure 8. Comparison of Pol III, Pol II and Pol I PICs.
a, Ribbon diagrams of yeast Pol III, Pol II (PDB 5fyw) and Pol I (PDB 5w65) PICs. TFIIF and TFIIE occupy similar positions as C53-C37 heterodimer and C82-C34-C31 heterotrimer, respectively. The convex surface of TBP is closely contacted by Brf1 homology domain II in TFIIIB, but accessible in the Pol II PIC, whereas TBP is entirely absent from available Pol I PIC structures. This might explain the strict requirement of TBP in the Pol III system in contrast to Pol II and Pol I. b, Close up of the downstream promoter assembly, showing C82 WH3-WH4, C34 WH1-WH3 (left), the WH domains of TFIIF and TFIIE (middle) and the A49 tWH9 and TPR of Rrn11. While C82-C34 and TFIIF-TFIIE form structurally similar downstream promoter assemblies using WH domains and the C82 ‘cleft loop’ and TFIIE ‘E-wing’ to contact the upstream bubble edge, Pol I CF forms a structurally different assembly where the A49 tWH does not contact the upstream bubble edge in the same way. c, Comparison of the cyclin folds in Brf1, TFIIB and Rrn7. The cyclin folds in Brf1 and TFIIB occupy similar positions and contact the polymerase wall, whereas the cyclin folds in Rrn7 do not.
Extended Data Figure 9. Comparison between Bdp1 in the Pol III-PIC and TFIIA and TFIIF in the Pol II-PIC.
The Bdp1 SANT domain is located at a similar position as TFIIA. Parts of Bdp1 resemble TFIIF subunit Tfg1, although no sequence similarity is detectable. Both interact with the Pol protrusion by adding a β-strand to the Pol protrusion (although at different ends of the protrusion β-sheet) and fold into a short helix along the face of the protrusion. The path of the C37 initiation/termination loop is also similar to Tfg1. The second subunit of TFIIF, Tfg2, also adds a β-strand to the Pol II protrusion. Brf1 and TBP were omitted for clarity.
Extended Data Table 1. Cryo-EM data collection, refinement and validation statistics.
| #1 ITC (EMD-4181) (PDB 6f41) |
#2 OC (EMD-4180) (PDB 6f40) |
#4 CC1 (EMD-4182) (PDB 6f42) |
#3 CC2 (EMD-4183) (PDB 6f44) |
|
|---|---|---|---|---|
| Data collection and processing | ||||
| Magnification | 105,000 | 105,000 | 105,000 | 105,000 |
| Voltage (kV) | 300 | 300 | 300 | 300 |
| Electron exposure (e−/Å2)1 | 61.3 | 60.0/61.8 | 60.0/61.8 | 60.0/61.8 |
| Defocus range (μm) | -1 to -3 | -0.5 to -4 | -0.5 to -4 | -0.5 to -4 |
| Pixel size (Å) | 1.35 | 1.35 | 1.35 | 1.35 |
| Symmetry imposed | n/a | n/a | n/a | n/a |
| Initial particle images (no.) | 472,519 | 714,312 | 714,312 | 714,312 |
| Final particle images (no.) | 29,951 | 62,751 | 18,760 | 34,176 |
| Map resolution (Å) | 4.3 | 3.7 | 5.5 | 4.2 |
| FSC threshold | 0.143 | 0.143 | 0.143 | 0.143 |
| Map resolution range (Å) | 3.9-9.0 | 3.3-7.5 | 4.0-9.0 | 3.7-9.0 |
| Refinement | ||||
| Initial model used (PDB code) | 5fj8 | 5fj8 | 5fj8 | 5fj8 |
| Model resolution (Å) | 4.3 | 3.7 | 5.5 | 4.2 |
| Map sharpening B factor (Å2) | 142 | 130 | 100 | 90 |
| Model composition | ||||
| Non-hydrogen atoms | 48,614 | 47,912 | 45,594 | 45,573 |
| Protein residues | 5,721 | 5,721 | 5,515 | 5,512 |
| Ligands | 0 | 0 | 0 | 0 |
| B factors (Å2) | ||||
| Protein | 125.93 | 57.53 | 254.30 | 121.87 |
| Ligand | n/a | n/a | n/a | n/a |
| R.m.s. deviations | ||||
| Bond lengths (Å) | 0.01 | 0.01 | 0.01 | 0.01 |
| Bond angles (°) | 1.03 | 1.04 | 1.03 | 1.03 |
| Validation | ||||
| MolProbity score | 2.12 | 2.06 | 2.18 | 2.07 |
| Clashscore | 8.71 | 8.23 | 11.19 | 8.77 |
| Poor rotamers (%) | 1.12 | 0.96 | 1.07 | 0.81 |
| Ramachandran plot | ||||
| Favored (%) | 87.37 | 87.17 | 88.35 | 88.01 |
| Allowed (%) | 12.59 | 12.72 | 11.56 | 11.92 |
| Disallowed (%) | 0.04 | 0.11 | 0.09 | 0.07 |
Structures OC, CC1 and CC2 were determined from two datasets. The electron dose of both sets is given.
Supplementary Material
Acknowledgements
C.W.M. and R.W. acknowledge support by the ERC Advanced Grant (ERC-2013-AdG340964-POL1PIC). M.K.V. acknowledges support by the EMBL International PhD program. H.K. acknowledges support by the European Union’s Horizon 2020 program under the Marie Sklodowska-Curie grant agreement No. 703432. We thank F. Baudin for help with the transcription assay, A.J. Jakobi for extensive help with setting up LocScaling of cryo-EM maps and model refinement, T. Hoffmann and J. Pecar for setting up the high performance computing for RELION 2.0, and N.A. Hoffmann, J. Kosinski, L. Tafur and Y. Sadian for discussion. We thank A. Vannini for giving us access to coordinates PDB 5n9g prior to publication.
Footnotes
Author Contributions
C.W.M. initiated and supervised the project. M.K.V. designed and carried out experiments, data processing and model building. H.K. helped in initial stages of EM preparation. W.J.H.H. collected cryo-EM datasets. R.W. was responsible for yeast fermentation and helped with cloning. M.K.V. and C.W.M. prepared the manuscript with input from the other authors.
Author Information
Reprints and permissions information is available at www.nature.com/reprints.
The authors declare no competing financial interests.
References
- 1.Goodfellow SJ, White RJ. Regulation of RNA polymerase III transcription during mammalian cell growth. Cell Cycle. 2007;6:2323–6. doi: 10.4161/cc.6.19.4767. [DOI] [PubMed] [Google Scholar]
- 2.White RJ. RNA polymerases I and III, growth control and cancer. Nat Rev Mol Cell Biol. 2005;6:69–78. doi: 10.1038/nrm1551. [DOI] [PubMed] [Google Scholar]
- 3.Gouge J, et al. Redox Signaling by the RNA Polymerase III TFIIB-Related Factor Brf2. Cell. 2015;163:1375–1387. doi: 10.1016/j.cell.2015.11.005. [DOI] [PMC free article] [PubMed] [Google Scholar]
- 4.Johnson SAS, Dubeau L, Johnson DL. Enhanced RNA polymerase III-dependent transcription is required for oncogenic transformation. J Biol Chem. 2008;283:19184–19191. doi: 10.1074/jbc.M802872200. [DOI] [PMC free article] [PubMed] [Google Scholar]
- 5.Wu L, et al. Novel Small-Molecule Inhibitors of RNA Polymerase III. Eukaryot Cell. 2003;2:256–264. doi: 10.1128/EC.2.2.256-264.2003. [DOI] [PMC free article] [PubMed] [Google Scholar]
- 6.Felton-Edkins ZA, White RJ. Multiple mechanisms contribute to the activation of RNA polymerase III transcription in cells transformed by papovaviruses. J Biol Chem. 2002;277:48182–91. doi: 10.1074/jbc.M201333200. [DOI] [PubMed] [Google Scholar]
- 7.Dieci G, Percudani R, Giuliodori S, Bottarelli L, Ottonello S. TFIIIC-independent in Vitro Transcription of Yeast tRNA Genes. J Mol Biol. 2000;299:601–613. doi: 10.1006/jmbi.2000.3783. [DOI] [PubMed] [Google Scholar]
- 8.Kassavetis GA, Braun BF, Nguyen LH, Geiduschek EPS. cerevisiae TFIIIB is the transcription initiation factor proper of RNA polymerase III, while TFIIIA and TFIIIC are assembly factors. Cell. 1990;60:236–245. doi: 10.1016/0092-8674(90)90739-2. [DOI] [PubMed] [Google Scholar]
- 9.Dieci G, Sentenac A. Facilitated recycling pathway for RNA polymerase III. Cell. 1996;84:245–252. doi: 10.1016/s0092-8674(00)80979-4. [DOI] [PubMed] [Google Scholar]
- 10.Vannini A, Cramer P. Conservation between the RNA Polymerase I, II, and III Transcription Initiation Machineries. Mol Cell. 2012;45:439–446. doi: 10.1016/j.molcel.2012.01.023. [DOI] [PubMed] [Google Scholar]
- 11.Keener J, Josaitis CA, Dodd JA, Nomura M. Reconstitution of Yeast RNA Polymerase I Transcription in Vitro. J Biol Chem. 1998;273:33795–33802. doi: 10.1074/jbc.273.50.33795. [DOI] [PubMed] [Google Scholar]
- 12.Kassavetis GA, Driscoll R, Geiduschek EP. Mapping the principal interaction site of the Brf1 and Bdp1 subunits of Saccharomyces cerevisiae TFIIIB. J Biol Chem. 2006;281:14321–14329. doi: 10.1074/jbc.M601702200. [DOI] [PubMed] [Google Scholar]
- 13.Khoo B, Brophy B. Conserved functional domains of the RNA polymerase III general transcription factor BRF. Genes Dev. 1994;8:2879–2890. doi: 10.1101/gad.8.23.2879. [DOI] [PubMed] [Google Scholar]
- 14.Gouge J, et al. Molecular mechanisms of Bdp1 in TFIIIB assembly and RNA polymerase III transcription initiation. Nat Commun. 2017;8:1–10. doi: 10.1038/s41467-017-00126-1. [DOI] [PMC free article] [PubMed] [Google Scholar]
- 15.Ishiguro A, Kassavetis GA, Geiduschek EP. Essential Roles of Bdp1 , a Subunit of RNA Polymerase III Initiation Factor TFIIIB , in Transcription and tRNA Processing. Mol Cell Biol. 2002;22:3264–3275. doi: 10.1128/MCB.22.10.3264-3275.2002. [DOI] [PMC free article] [PubMed] [Google Scholar]
- 16.Shah SMA, Kumar A, Geiduschek EP, Kassavetis GA. Alignment of the B” Subunit of RNA Polymerase III Transcription Factor IIIB in Its Promoter Complex. J Biol Chem. 1999;274:28736–28744. doi: 10.1074/jbc.274.40.28736. [DOI] [PubMed] [Google Scholar]
- 17.Kumar A, Kassavetis GA, Geiduschek EP, Hambalko M, Brent CJ. Functional dissection of the B” component of RNA polymerase III transcription factor IIIB: a scaffolding protein with multiple roles in assembly and initiation of transcription. Mol Cell Biol. 1997;17:1868–1880. doi: 10.1128/mcb.17.4.1868. [DOI] [PMC free article] [PubMed] [Google Scholar]
- 18.Maraia RJ, Arimbasseri AG, Maraia RJ. Mechanism of Transcription Termination by RNA Polymerase III Utilizes a Non-template Strand Sequence-Specific Signal Element. Mol Cell. 2015;58:1124–1132. doi: 10.1016/j.molcel.2015.04.002. [DOI] [PMC free article] [PubMed] [Google Scholar]
- 19.Rijal K, Maraia RJ. RNA polymerase III mutants in TFIIFa-like C37 that cause terminator readthrough with no decrease in transcription output. Nucleic Acids Res. 2013;41:139–155. doi: 10.1093/nar/gks985. [DOI] [PMC free article] [PubMed] [Google Scholar]
- 20.Kassavetis GA, Prakash P, Shim E. The C53/C37 subcomplex of RNA polymerase III lies near the active site and participates in promoter opening. J Biol Chem. 2010;285:2695–2706. doi: 10.1074/jbc.M109.074013. [DOI] [PMC free article] [PubMed] [Google Scholar]
- 21.Hoffmann NA, et al. Molecular structures of unbound and transcribing RNA polymerase III. Nature. 2015;528:231–236. doi: 10.1038/nature16143. [DOI] [PMC free article] [PubMed] [Google Scholar]
- 22.Brun I, Sentenac A, Werner M. Dual role of the C34 subunit of RNA polymerase III in transcription initiation. EMBO J. 1997;16:5730–5741. doi: 10.1093/emboj/16.18.5730. [DOI] [PMC free article] [PubMed] [Google Scholar]
- 23.Kassavetis GA, Soragni E, Driscoll R, Geiduschek EP. Reconfiguring the connectivity of a multiprotein complex: fusions of yeast TATA-binding protein with Brf1, and the function of transcription factor IIIB. Proc Natl Acad Sci U S A. 2005;102:15406–15411. doi: 10.1073/pnas.0507653102. [DOI] [PMC free article] [PubMed] [Google Scholar]
- 24.Jakobi AJ, Wilmanns M, Sachse C. Model-based local density sharpening of cryo-EM maps. Elife. 2017;6:e27131. doi: 10.7554/eLife.27131. [DOI] [PMC free article] [PubMed] [Google Scholar]
- 25.Wu CC, Lin YC, Chen HT. The TFIIF-like Rpc37/53 dimer lies at the center of a protein network to connect TFIIIC, Bdp1, and the RNA polymerase III active center. Mol Cell Biol. 2011;31:2715–2728. doi: 10.1128/MCB.05151-11. [DOI] [PMC free article] [PubMed] [Google Scholar]
- 26.Hu H-L, Wu C-C, Lee J-C, Chen H-T. A Region of Bdp1 Necessary for Transcription Initiation That Is Located within the RNA Polymerase III Active Site Cleft. Mol Cell Biol. 2015;35:2831–2840. doi: 10.1128/MCB.00263-15. [DOI] [PMC free article] [PubMed] [Google Scholar]
- 27.Khoo S-K, Wu C-C, Lin Y-C, Lee J-C, Chen H-T. Mapping the protein interaction network for TFIIB-related factor Brf1 in the RNA polymerase III preinitiation complex. Mol Cell Biol. 2014;34:551–9. doi: 10.1128/MCB.00910-13. [DOI] [PMC free article] [PubMed] [Google Scholar]
- 28.Juo ZS, Kassavetis GA, Wang J, Geiduschek EP, Sigler PB. Crystal structure of a transcription factor IIIB core interface ternary complex. Nature. 2003;422:534–539. doi: 10.1038/nature01534. [DOI] [PubMed] [Google Scholar]
- 29.Liao Y, Moir RD, Willis IM. Interactions of Brf1 peptides with the tetratricopeptide repeat-containing subunit of TFIIIC inhibit and promote preinitiation complex assembly. Mol Cell Biol. 2006;26:5946–56. doi: 10.1128/MCB.00689-06. [DOI] [PMC free article] [PubMed] [Google Scholar]
- 30.Male G, et al. Architecture of TFIIIC and its role in RNA polymerase III pre-initiation complex assembly. Nat Commun. 2015;6:7387. doi: 10.1038/ncomms8387. [DOI] [PMC free article] [PubMed] [Google Scholar]
- 31.Kassavetis GA, Letts GA, Geiduschek EP. A minimal RNA polymerase III transcription system. EMBO J. 1999;18:5042–5051. doi: 10.1093/emboj/18.18.5042. [DOI] [PMC free article] [PubMed] [Google Scholar]
- 32.Kassavetis GA, Bardeleben C, Kumar A, Ramirez E, Geiduschek EP. Domains of the Brf component of RNA polymerase III transcription factor IIIB (TFIIIB): functions in assembly of TFIIIB-DNA complexes and recruitment of RNA polymerase to the promoter. Mol Cell Biol. 1997;17:5299–306. doi: 10.1128/mcb.17.9.5299. [DOI] [PMC free article] [PubMed] [Google Scholar]
- 33.Roy K, Gabunilas J, Gillespie A, Ngo D, Chanfreau F. Common genomic elements promote transcriptional and DNA replication roadblocks. Genome Res. 2016:1363–1375. doi: 10.1101/gr.204776.116. [DOI] [PMC free article] [PubMed] [Google Scholar]
- 34.Cloutier TE, Librizzi MD, Mollah AKMM, Brenowitz M, Willis IM. Kinetic trapping of DNA by transcription factor IIIB. Proc Natl Acad Sci. 2001;98:9581–9586. doi: 10.1073/pnas.161292298. [DOI] [PMC free article] [PubMed] [Google Scholar]
- 35.Kassavetis GA, Letts GA, Geiduschek EP. The RNA polymerase III transcription initiation factor TFIIIB participates in two steps of promoter opening. EMBO J. 2001;20:2823–2834. doi: 10.1093/emboj/20.11.2823. [DOI] [PMC free article] [PubMed] [Google Scholar]
- 36.Kassavetis GA, Blanco JA, Johnson TE, Geiduschek EP. Formation of Open and Elongating Transcription by RNA Polymerase III Complexes. J Mol Biol. 1992;226:47–58. doi: 10.1016/0022-2836(92)90123-2. [DOI] [PubMed] [Google Scholar]
- 37.Sainsbury S, Niesser J, Cramer P. Structure and function of the initially transcribing RNA polymerase II–TFIIB complex. Nature. 2012;493:2–6. doi: 10.1038/nature11715. [DOI] [PubMed] [Google Scholar]
- 38.He Y, Fang J, Taatjes DJ, Nogales E. Structural visualization of key steps in human transcription initiation. Nature. 2013;495:481–6. doi: 10.1038/nature11991. [DOI] [PMC free article] [PubMed] [Google Scholar]
- 39.Carter R, Drouin G. The Increase in the Number of Subunits in Eukaryotic RNA Polymerase III Relative to RNA Polymerase II Is due to the Permanent Recruitment of General Transcription Factors. Mol Biol Evol. 2010;27:1035–1043. doi: 10.1093/molbev/msp316. [DOI] [PubMed] [Google Scholar]
- 40.Lassar AB, Martin PL, Roeder RG. Transcription of Class III Genes : Formation of Preinitiation Complexes. Science. 1983;222:740–748. doi: 10.1126/science.6356356. [DOI] [PubMed] [Google Scholar]
- 41.Yudkovsky N, Ranish JA, Hahn S. A transcription reinitiation intermediate that is stabilized by activator. Nature. 2000;408:225–229. doi: 10.1038/35041603. [DOI] [PubMed] [Google Scholar]
- 42.Hahn S. Activation and the role of reinitiation in the control of transcription by RNA polymerase II. Cold Spring Harb Symp Quant Bio. 1998;63:181–188. doi: 10.1101/sqb.1998.63.181. [DOI] [PubMed] [Google Scholar]
- 43.Dieci G, Sentenac A. Detours and shortcuts to transcription reinitiation. Trends Biochem Sci. 2003;28:202–209. doi: 10.1016/S0968-0004(03)00054-9. [DOI] [PubMed] [Google Scholar]
- 44.Rani PG, Ranish JA, Hahn S, Hughes H, Al RET. RNA Polymerase II ( Pol II ) -TFIIF and Pol II-Mediator Complexes : the Major Stable Pol II Complexes and Their Activity in Transcription Initiation and Reinitiation. Mol Cell Biol. 2004;24:1709–1720. doi: 10.1128/MCB.24.4.1709-1720.2004. [DOI] [PMC free article] [PubMed] [Google Scholar]
- 45.Sadian Y, et al. Structural insights into transcription initiation by yeast RNA polymerase I. EMBO J. 36:2698–2709. doi: 10.15252/embj.201796958. [DOI] [PMC free article] [PubMed] [Google Scholar]
- 46.Engel C, et al. Structural Basis of RNA Polymerase I Transcription Initiation. Cell. 2017;169:120–131.e22. doi: 10.1016/j.cell.2017.03.003. [DOI] [PubMed] [Google Scholar]
- 47.Han Y, et al. Structural mechanism of ATP-independent transcription initiation by RNA polymerase I. Elife. 2017;6:e27414. doi: 10.7554/eLife.27414. [DOI] [PMC free article] [PubMed] [Google Scholar]
- 48.Feklistov A, et al. RNA polymerase motions during promoter melting. Science. 2017;356:863–866. doi: 10.1126/science.aam7858. [DOI] [PMC free article] [PubMed] [Google Scholar]
- 49.He Y, et al. Near-atomic resolution visualization of human transcription promoter opening. Nature. 2016;533:359–365. doi: 10.1038/nature17970. [DOI] [PMC free article] [PubMed] [Google Scholar]
- 50.Plaschka C, et al. Transcription initiation complex structures elucidate DNA opening. Nature. 2016;533:353–8. doi: 10.1038/nature17990. [DOI] [PubMed] [Google Scholar]
- 51.Moreno-Morcillo M, et al. Solving the RNA polymerase I structural puzzle. Acta Crystallogr Sect D Biol Crystallogr. 2014;70:2570–2582. doi: 10.1107/S1399004714015788. [DOI] [PMC free article] [PubMed] [Google Scholar]
- 52.Zheng SQ, et al. MotionCor2: anisotropic correction of beam-induced motion for improved cryo-electron microscopy. Nat Methods. 2017;14:331–332. doi: 10.1038/nmeth.4193. [DOI] [PMC free article] [PubMed] [Google Scholar]
- 53.Zhang K. Gctf: Real-time CTF determination and correction. J Struct Biol. 2016;193:1–12. doi: 10.1016/j.jsb.2015.11.003. [DOI] [PMC free article] [PubMed] [Google Scholar]
- 54.Kimanius D, Forsberg BO, Scheres SHW, Lindahl E. Accelerated cryo-EM structure determination with parallelisation using GPUS in RELION-2. Elife. 2016;5:e18722. doi: 10.7554/eLife.18722. [DOI] [PMC free article] [PubMed] [Google Scholar]
- 55.Kelly LA, Mezulis S, Yates C, Wass M, Sternberg M. The Phyre2 web portal for protein modelling, prediction, and analysis. Nat Protoc. 2015;10:845–858. doi: 10.1038/nprot.2015.053. [DOI] [PMC free article] [PubMed] [Google Scholar]
- 56.Sali A, Blundell TL. Comparative protein modelling by satisfaction of spatial restraints. J Mol Biol. 1993;234:779–815. doi: 10.1006/jmbi.1993.1626. [DOI] [PubMed] [Google Scholar]
- 57.Emsley P, Lohkamp B, Scott WG, Cowtan K. Features and development of Coot. Acta Crystallogr D Biol Crystallogr. 2010;66:486–501. doi: 10.1107/S0907444910007493. [DOI] [PMC free article] [PubMed] [Google Scholar]
- 58.Kang JJ, Kang YS, Stumph WE. TFIIIB Subunit Locations on U6 Gene Promoter DNA Mapped by Site-specific Protein-DNA Photo-cross-linking. FEBS Lett. 2016;590:1488–97. doi: 10.1002/1873-3468.12185. [DOI] [PubMed] [Google Scholar]
- 59.Tafur L, et al. Molecular Structures of Transcribing RNA Polymerase I. Mol Cell. 2016;64:1135–1143. doi: 10.1016/j.molcel.2016.11.013. [DOI] [PMC free article] [PubMed] [Google Scholar]
- 60.Adams PD, et al. PHENIX: A comprehensive Python-based system for macromolecular structure solution. Acta Crystallogr Sect D Biol Crystallogr. 2010;66:213–221. doi: 10.1107/S0907444909052925. [DOI] [PMC free article] [PubMed] [Google Scholar]
- 61.Chen VB, et al. MolProbity: all-atom structure validation for macromolecular crystallography. Acta Crystallogr Sect D Biol Crystallogr. 2010;66:12–21. doi: 10.1107/S0907444909042073. [DOI] [PMC free article] [PubMed] [Google Scholar]
- 62.Heymann JB, Belnap DM. Bsoft : Image processing and molecular modeling for electron microscopy. 2007;157:3–18. doi: 10.1016/j.jsb.2006.06.006. [DOI] [PubMed] [Google Scholar]
- 63.Pettersen EF, et al. UCSF Chimera — A Visualization System for Exploratory Research and Analysis. J Comput Chem. 2004;25:1605–1642. doi: 10.1002/jcc.20084. [DOI] [PubMed] [Google Scholar]
- 64.Schrödinger LLC. The {PyMOL} Molecular Graphics System, Version~1.8. 2015 [Google Scholar]
Associated Data
This section collects any data citations, data availability statements, or supplementary materials included in this article.
Supplementary Materials
Data Availability Statement
Cryo-EM maps of the Pol III ITC, Pol III OC and Pol III CC1 and Pol III CC2 and an intermediate 3.4 Å OC map that aided model building (Pol III PIC_joined, see Methods) have been deposited in the Electron Microscopy Data Base (EMDB) under accession codes EMD-4181 (Pol III ITC), EMD-4180 (Pol III OC), EMD-4182 (Pol III CC1) and EMD-4183 (Pol III CC2) and EMD-4184 (Pol III PIC_joined). The coordinates of the corresponding atomic models have been deposited in the Protein Data Bank (PDB) under accession code 6f41 (Pol III ITC), 6f40 (Pol III OC1), 6f42 (Pol III CC1), 6f44 (Pol III CC2).


