Abstract
Photoacoustic computed tomography (PACT) is a non-invasive imaging technique offering high contrast, high resolution, and deep penetration in biological tissues. We report a PACT system equipped with a high frequency linear transducer array for mapping the microvascular network of a whole mouse brain with the skull intact and studying its hemodynamic activities. The linear array was scanned in the coronal plane to collect data from different angles, and full-view images were synthesized from the limited-view images in which vessels were only partially revealed. We investigated spontaneous neural activities in the deep brain by monitoring the concentration of hemoglobin in the blood vessels and observed strong interhemispherical correlations between several chosen functional regions, both in the cortical layer and in the deep regions. We also studied neural activities during an epileptic seizure and observed the epileptic wave spreading around the injection site and the wave propagating in the opposite hemisphere.
Keywords: Photoacoustic computed tomography, deep mouse brain, functional imaging
In recent years, advanced imaging methodologies with increased spatial and temporal resolution have been used to extend our understanding of brain functions. Brain positron emission tomography (PET) is a metabolic imaging method that detects the emissions from radioactive tracers that are injected into the blood stream and eventually reach the brain [1]. Functional magnetic resonance imaging (fMRI) measures brain activity by using the blood oxygenation level-dependent (BOLD) effect [2]. Both methods have drawbacks: PET uses ionizing radiation and has poor spatial resolution, and fMRI is too slow for studying fast hemodynamics. Recently, functional ultrasound imaging has successfully been used to monitor cerebral microvascular hemodynamics deep in the rat brain with high spatiotemporal resolution [3, 4]. Optical imaging techniques, such as optical coherence tomography and multiphoton microscopy, have also been demonstrated for imaging neural activity with cellular and subcellular resolution [5, 6], but the shallow penetration limits their observation to only the cortical layer (~1–2 mm).
Photoacoustic tomography (PAT) is a modality that detects ultrasonic waves generated by optical absorption of soft tissues under pulsed light illumination [7, 8]. PAT is a nonionizing imaging technique, providing strong optical contrast and high ultrasonic spatial resolution at depths. By using multiple wavelength lasers to excite photoacoustic waves, PAT is able to simultaneously measure the concentrations of various chromophores in biological tissues or organs with distinct optical absorption properties. In particular, PAT has been successfully used to quantify the concentration and the oxygen saturation (sO2) of hemoglobin, which are related to angiogenesis and hypermetabolism [7]. Substantially accurate sO2 quantification has also been demonstrated in deep tissues [9]. By scanning a tightly focused laser beam, a PAT system can provide optical resolution photoacoustic microscopy (OR-PAM) [10, 11]. Recently, OR-PAM has been used for high-speed, high-resolution mapping of the blood network and for studying the hemodynamics in the mouse brain [12]. Because OR-PAM relies on ballistic photons to achieve high resolution, its penetration depth in tissue is generally limited to ~1–2 mm. Photoacoustic computed tomography (PACT) detects ultrasonic waves generated by diffused photons and retrieves the absorption distribution through an inverse algorithm, allowing an imaging depth of up to several centimeters [13]. In this work, we used PACT to image the blood vascular network of a whole mouse brain through the intact skull, with high resolution and substantial depth. We then used the PACT system to study the hemodynamics of the mouse brain in the resting state and during an epileptic seizure. Our experiments show that functional PACT is a promising tool for studying neural activities in the deep brain, and potentially for revealing the mechanism of some brain disorders.
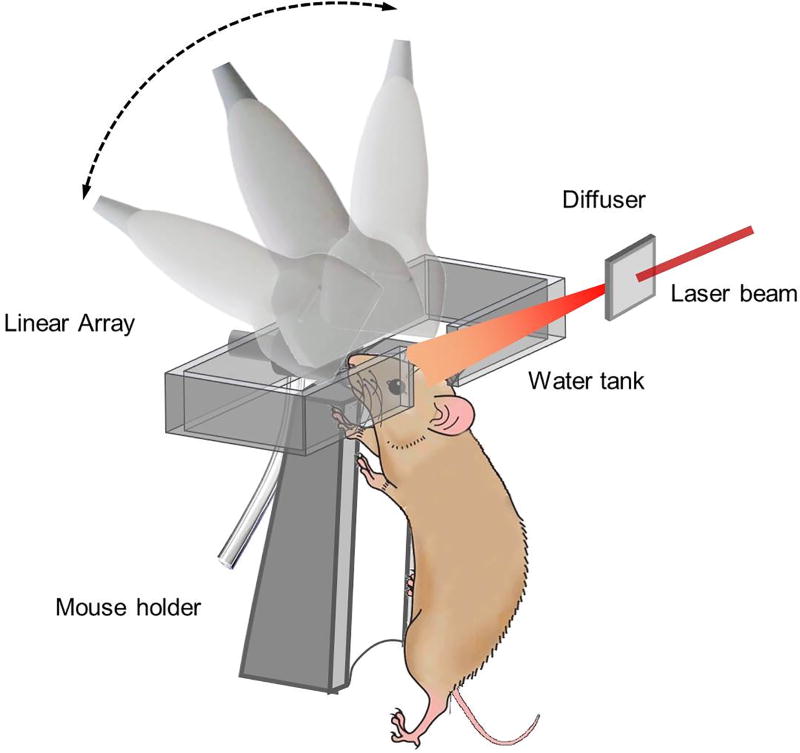
Figure 1 shows the schematic setup of linear array PACT for mouse brain imaging. In this work, 6–8 week-old female mice (Swiss Webster, Invigo) were used. Prior to imaging, the hair on the head of the mouse was removed by a depilatory cream. The mouse was then mounted onto a holder with its head fixed by a nose cone and a tooth bar. A rubber tube connecting the nose cone and an isoflurane vaporizer was used to deliver oxygen and anesthetic gas. The temperature of the mouse holder was regulated by a controller. The scalp of the mouse was removed, and ultrasound gel was applied before imaging. The animal procedures followed the laboratory animal protocols approved by the Animal Studies Committee of Washington University in St. Louis. The mouse was placed beneath the water tank, within an imaging window with dimensions of 8 cm × 10 cm. The imaging window was covered with plastic film at the bottom of the water tank, and the tank was filled with water for ultrasound coupling. A 5 cm wide window in one side of the tank wall allowed laser beam access to the mouse head. The laser beam used for exciting ultrasonic waves was provided by a Nd:YAG laser (Quantel, Brillant B, 4–6 ns pulse duration, 10 Hz repetition rate). The laser beam was expanded and homogenized by an engineered diffuser (EDC-5-A-2 s, RPC Photonics, Inc.), resulting in a 2 cm-diameter illumination area on the mouse head. With a pulse energy of 200 mJ, the optical fluence on the head surface was 64 mJ/cm2, which is below the American National Standards Institute (ANSI) safety limit of 100 mJ/cm2 at 1064 nm. The excited photoacoustic (PA) waves were detected by a focused linear transducer array (LZ250, VisualSonics) consisting of 256 elements. The linear array had a one-way bandwidth of 11 MHz around the central frequency of 21 MHz, providing a lateral resolution of 75 microns. The numerical aperture of the transducer array is 0.1, yielding a sectioning thickness of about 0.5 mm within the depth of focus, which covers the whole mouse brain. The detected signals were first amplified by homemade pre-amplifiers (256 channels, 26 dB Gain per channel) and then digitalized by a customized 256-channel data acquisition system (National Instruments, Customized PXI system, 14 bits) at a sampling rate of 250 MHz. The features within the imaging plane were reconstructed using the filtered universal back-projection algorithm [14].
Fig. 1.
Schematic setup of linear array PACT for mouse brain imaging.
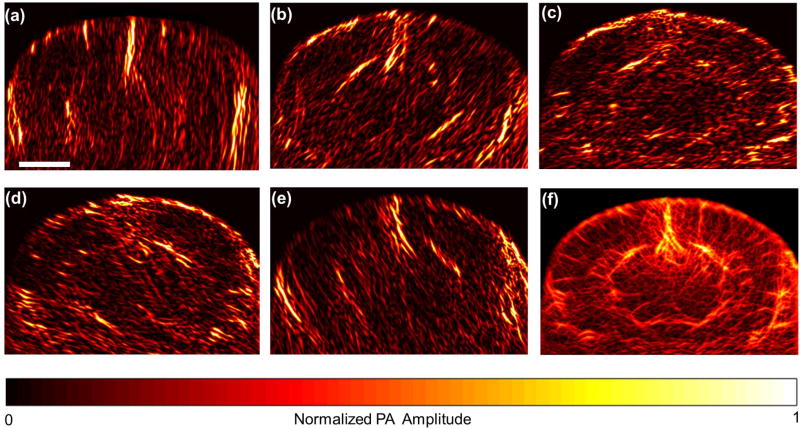
To map the vessels in the coronal plane, the mouse was mounted with its cortical plane horizontal to the bottom of the water tank, and the linear array was oriented in the coronal plane, as shown in Fig. 1. The surface of the linear array was about 1 cm away from the top of the head, and the diffused laser beam was obliquely incident on the head. The pulsed laser at 1064 nm was used to excite the PA waves, which came predominantly from oxyhemoglobin, a dominant chromophore in the blood stream. Due to the limited view of the linear array, only vessels normal to the acoustic axis could be reconstructed, but the vessels with their orientation deviated from the axis were almost invisible [15]. Fig. 2(a–e) show reconstructed images of a typical coronal plane recorded from several representative view angles, each averaged over 200 acquisitions. To solve this limited-view problem, the linear array was mounted on a rotary stage (not shown in Fig. 1) with its rotational axis centered at the mouse brain. The linear array was then scanned around the brain without changing the laser illumination to record images at view angles ranging from –76 to 76 degrees, with a step size of 4 degrees. The reconstructed bipolar images were converted into unipolar images by Hilbert transformation along each view’s acoustic axis [16]. The processed images were then rotated back to recover the vascular distribution in the global coordinate system in which the brain was fixed, and the rotated images were summed to form a full-view unipolar image, as shown in Fig. 2(f). The full-view image demonstrated that the PACT system equipped with the high frequency linear array can provide high resolution and deep penetration imaging of a whole mouse brain.
Fig. 2.
Coronal plane PACT imaging of a mouse brain through the intact skull (Bregma −1.0 mm). (a-e) Limited-view planar images reconstructed at view angles of –76, –36, 0, 36 and 76 degrees, respectively. Each of these images was averaged over 200 acquisitions. (f) Full-view planar image combined from the 39 limited-view images. The scale bar is 2 mm.
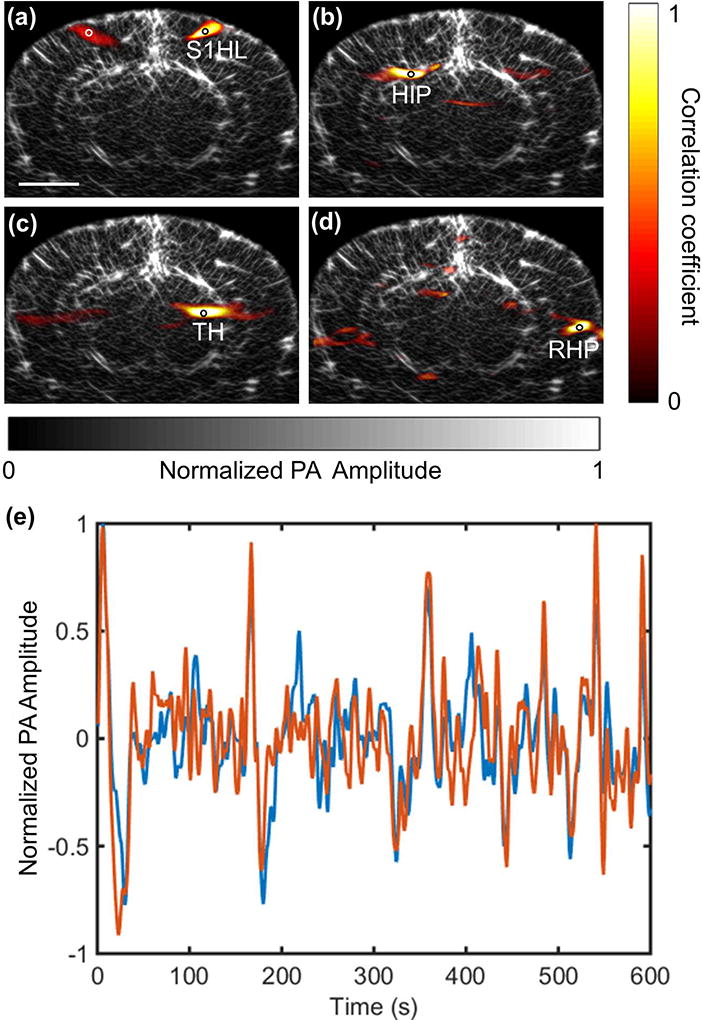
Since light at the chosen laser wavelength is weakly absorbed in biological tissues, and changes in the concentrations of hemoglobin and other absorbers during neural activities are generally small, the local optical fluence in the mouse brain is assumed to be temporally invariant, enabling the PACT system to study the hemodynamic activities in the deep brain. As a first demonstration, we used our linear-array PACT system to study the resting-state functional connectivity (RSFC) in the coronal plane of a mouse brain. RSFC measures the temporal correlation of the low frequency, spontaneous hemodynamic fluctuations among spatially separated but functionally related regions in the brain [17, 18]. The alteration in the functional connectivity properties is usually an indicator of such brain disorders as depression, Alzheimer’s disease, and schizophrenia [19–21]. To explore the functional connectivity of a mouse brain in resting state, the linear array was fixed with its axis normal to the cortical plane, and 6000 images were acquired at a frame rate of 10 Hz. This study again used 6–8 week-old female ND4 Swiss Webster mice (Invigo), anesthetized with 0.8% (vol/vol) isoflurane at an air flow rate of 0.8 L/min, a dose does not alter the functional connectivity patterns [22]. The PA signals due to scattered photons from the transducer surface were used to correct the fluctuations in the total laser pulse energy. Every set of 10 images was averaged to improve the signal-to-noise (SNR) ratio, and the resulting 600 images over a 10-minute acquisition were analyzed with a seed-based approach [23, 24]. Basically, the reconstructed images were first filtered by a 2-D Gaussian smoothing kernel with standard deviation of 6 pixels. Then a band pass filter with a window of 0.009–0.08 Hz was applied on the time series of the images to reduce the effects caused by heart beating and breathing [24]. Finally, a seed was chosen and the temporal correlations of its PA signal with that of each pixel in the image were calculated. A high coefficient in the correlation map indicates a region that is functionally related to the seed region. The correlation maps for representative regions in the mouse brain were superimposed on the synthesized anatomic image obtained as described above. As shown in Fig. 3(a–d), strong interhemispherical correlations were observed in the chosen functional regions, including the somatosensory, hippocampal, thalamic and retrohippocampal regions. The high correlations in the contralateral hemisphere were mostly from the regions symmetrically opposed to the seeds. Figure 3(e) also shows the time series of the filtered PA signals of a pair of correlated regions marked in white and black circles in Fig. 3(a), displaying strong correlation in their fluctuations.
Fig. 3.

Functional connectivity in a mouse brain acquired by a linear-array PACT system. (a-d) The correlation maps calculated at four representative functional regions (black circles) are overlaid onto the anatomic image that was synthesized from multiple limited-view images (Bregma −1.0 mm). The scale bar is 2 mm. S1HL, somatosensory 1, hindlimb region; HIP, hippocampal region; TH, thalamus; RHP, retrohippocampal region. (e) Time series of the filtered PA signals of a pair of correlated regions as marked in (a). The red and blue curves are corresponding to the points marked in white and black circles, respectively. Amplitudes are normalized to the maximum.
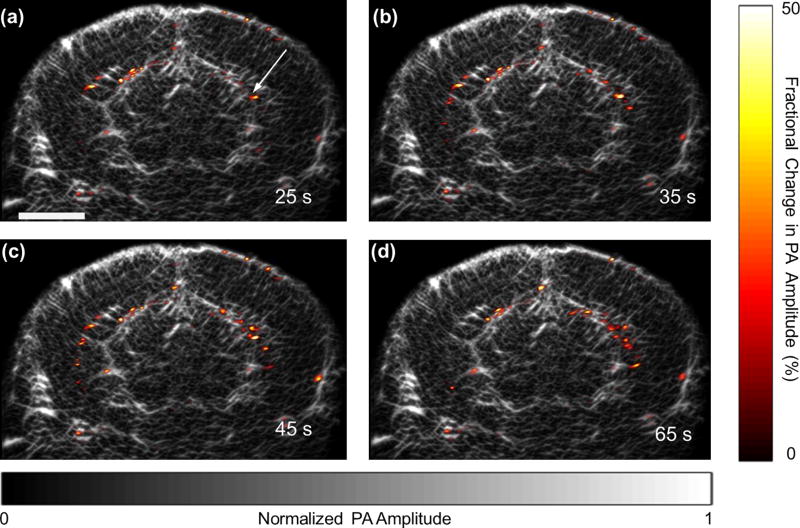
PACT using a high frequency transducer array allows studying the hemodynamics in the mouse brain with high spatial and temporal resolutions. To demonstrate this capability, we used our linear-array PACT system to study epilepsy in a mouse model. An epileptic seizure in a mouse was induced by injection of 4-aminopyridine, a potassium channel blocker. A hole with a diameter of 1 mm was drilled in the skull prior to imaging, and 2 µl of 4-aminopyridine solution at a concentration of 15 mM was injected into the brain through a 30 gauge needle. After the injection, the neural activities were imaged with the linear array fixed at an angle of 30 degrees. The images were acquired at a frame rate of 10 Hz, and every ten images were averaged into one, resulting in a temporal resolution of 1 s. The PA signal from the transducer surface due to scattered photons was used to correct the fluctuations in the total laser pulse energy. The fractional changes in the PA amplitude at different times after the injection are shown in Fig. 4. As indicated, an increase in the PA amplitude was initially observed at the injection site and then spread out. Even more interesting, epileptic wave propagation was also observed in the opposite hemisphere (supplementary movie).
Fig. 4.
Epileptiform activities of a mouse brain during a seizure, as imaged by PACT. The fractional changes in the PA amplitude at different times after the injection of 4-aminopyridine solution are superimposed on the anatomic image (Bregma –1.0 mm). The scale bar is 2 mm, and the arrow indicates the injection site.
In summary, we have built a linear-array PACT system for imaging a whole mouse brain through the intact skull and for studying hemodynamic activities with high spatial resolution and deep penetration. The linear array was scanned in the coronal plane to collect images at different angles. Combing the limited-view images into a full-view image revealed the microvascular network in the brain. We investigated spontaneous neural activities in the deep brain by monitoring the concentration of hemoglobin in the blood vessels and observed strong interhemispherical correlations between chosen functional regions, both in the cortex and in the deep region. We also used linear-array PACT to study epilepsy in the mouse brain induced by an injection of a potassium channel blocker. We observed the epileptic wave spreading around the injection site and a corresponding wave propagating in the opposite hemisphere.
The imaging frame rate of our functional PACT system is lower than that of functional ultrasound imaging (3, 4), but this limitation can be circumvented by employing a higher repetition-rate laser for photoacoustic excitation. However, PACT utilizes a different contrast mechanism from ultrasound imaging. Ultrasound tomography images the mechanical properties of soft tissue, and it has poor extravascular molecular contrasts. On the basis of the optical absorption of biomolecules, PACT enables molecular imaging by matching the excitation optical wavelength with the absorption peaks of the targeted molecules (25, 26), and thus provides high image contrast. Moreover, the concentration and oxygen saturation (sO2) of hemoglobin, which cannot be obtained by ultrasound imaging but are closely related to brain activities, can be measured by PACT (7, 9).
Supplementary Material
Acknowledgments
This work was funded by the National Institutes of Health (NIH) Grants U01 NS090579 (NIH Brain Initiative Award), U01 NS099717 (NIH Brain Initiative Award), R01 EB016963, DP1 EB016986 (Director’s Pioneer Award), R01 CA186567 (Director’s Transformative Research Award), S10 RR026922. The authors thank Prof. James Ballard for his close reading of the manuscript. L. V. Wang has a financial interest in Microphotoacoustics, Inc., which, however, did not support this work.
References
- 1.Firestone LL, Gyulai F, Mintun M, Adler LJ, Urso K, Winter PM. Human brain activity response to fentanyl imaged by positron emission tomography. Anesthesia & Analgesia. 1996;82(6):1247–1251. doi: 10.1097/00000539-199606000-00025. [DOI] [PubMed] [Google Scholar]
- 2.Kim SG, Ogawa S. Biophysical and physiological origins of blood oxygenation level-dependent fMRI signals. Journal of Cerebral Blood Flow & Metabolism. 2012;32(7):1188–1206. doi: 10.1038/jcbfm.2012.23. [DOI] [PMC free article] [PubMed] [Google Scholar]
- 3.Macé E, Montaldo G, Cohen I, Baulac M, Fink M, Tanter M. Functional ultrasound imaging of the brain. Nature methods. 2011;8(8):662–664. doi: 10.1038/nmeth.1641. [DOI] [PubMed] [Google Scholar]
- 4.Osmanski BF, Pezet S, Ricobaraza A, Lenkei Z, Tanter M. Functional ultrasound imaging of intrinsic connectivity in the living rat brain with high spatiotemporal resolution. Nature communications. 2014;5 doi: 10.1038/ncomms6023. [DOI] [PMC free article] [PubMed] [Google Scholar]
- 5.Chen Y, Aguirre AD, Ruvinskaya L, Devor A, Boas DA, Fujimoto JG. Optical coherence tomography (OCT) reveals depth-resolved dynamics during functional brain activation. Journal of neuroscience methods. 2009;178(1):162–173. doi: 10.1016/j.jneumeth.2008.11.026. [DOI] [PMC free article] [PubMed] [Google Scholar]
- 6.Tischbirek C, Birkner A, Jia H, Sakmann B, Konnerth A. Deep two-photon brain imaging with a red-shifted fluorometric Ca2+ indicator. Proceedings of the National Academy of Sciences. 2015;112(36):11377–11382. doi: 10.1073/pnas.1514209112. [DOI] [PMC free article] [PubMed] [Google Scholar]
- 7.Zhang HF, Maslov K, Stoica G, Wang LV. Functional photoacoustic microscopy for high-resolution and noninvasive in vivo imaging. Nature biotechnology. 2006;24(7):848–851. doi: 10.1038/nbt1220. [DOI] [PubMed] [Google Scholar]
- 8.Wang LV. Multiscale photoacoustic microscopy and computed tomography. Nature photonics. 2009;3(9):503–509. doi: 10.1038/nphoton.2009.157. [DOI] [PMC free article] [PubMed] [Google Scholar]
- 9.Tzoumas S, Nunes A, Olefir I, Stangl S, Symvoulidis P, Glasl S, Bayer C, Multhoff G, Ntziachristos V. Eigenspectra Optoacoustic Tomography Achieves Quantitative Blood Oxygenation Imaging Deep in Tissues. Nature Communications. 2016;7:12121. doi: 10.1038/ncomms12121. 2015. [DOI] [PMC free article] [PubMed] [Google Scholar]
- 10.Maslov K, Stoica G, Wang LV. In vivo dark-field reflection-mode photoacoustic microscopy. Optics letters. 2005;30(6):625–627. doi: 10.1364/ol.30.000625. [DOI] [PubMed] [Google Scholar]
- 11.Maslov K, Zhang HF, Hu S, Wang LV. Optical-resolution photoacoustic microscopy for in vivo imaging of single capillaries. Optics letters. 2008;33(9):929–931. doi: 10.1364/ol.33.000929. [DOI] [PubMed] [Google Scholar]
- 12.Yao J, Wang L, Yang JM, Maslov KI, Wong TT, Li L, Huang CH, Zou J, Wang LV. High-speed label-free functional photoacoustic microscopy of mouse brain in action. Nature methods. 2015;12(5):407–410. doi: 10.1038/nmeth.3336. [DOI] [PMC free article] [PubMed] [Google Scholar]
- 13.Wang LV, Hu S. Photoacoustic tomography: in vivo imaging from organelles to organs. Science. 2012;335(6075):1458–1462. doi: 10.1126/science.1216210. [DOI] [PMC free article] [PubMed] [Google Scholar]
- 14.Xu M, Wang LV. Universal back-projection algorithm for photoacoustic computed tomography. Physical Review E. 2005;71(1):016706. doi: 10.1103/PhysRevE.71.016706. [DOI] [PubMed] [Google Scholar]
- 15.Xu Y, Wang LV, Ambartsoumian G, Kuchment P. Reconstructions in limited-view thermoacoustic tomography. Medical physics. 2004;31(4):724–733. doi: 10.1118/1.1644531. [DOI] [PubMed] [Google Scholar]
- 16.Li G, Li L, Zhu L, Xia J, Wang LV. Multiview Hilbert transformation for full-view photoacoustic computed tomography using a linear array. Journal of biomedical optics. 2015;20(6):066010–066010. doi: 10.1117/1.JBO.20.6.066010. [DOI] [PMC free article] [PubMed] [Google Scholar]
- 17.Biswal B, Zerrin Yetkin F, Haughton VM, Hyde JS. Functional connectivity in the motor cortex of resting human brain using echo-planar mri. Magnetic resonance in medicine. 1995;34(4):537–541. doi: 10.1002/mrm.1910340409. [DOI] [PubMed] [Google Scholar]
- 18.Fox MD, Raichle ME. Spontaneous fluctuations in brain activity observed with functional magnetic resonance imaging. Nature Reviews Neuroscience. 2007;8(9):700–711. doi: 10.1038/nrn2201. [DOI] [PubMed] [Google Scholar]
- 19.Greicius MD, Flores BH, Menon V, Glover GH, Solvason HB, Kenna H, Reiss AL, Schatzberg AF. Resting-state functional connectivity in major depression: abnormally increased contributions from subgenual cingulate cortex and thalamus. Biological psychiatry. 2007;62(5):429–437. doi: 10.1016/j.biopsych.2006.09.020. [DOI] [PMC free article] [PubMed] [Google Scholar]
- 20.Buckner RL, Sepulcre J, Talukdar T, Krienen FM, Liu H, Hedden T, Andrews-Hanna JR, Sperling RA, Johnson KA. Cortical hubs revealed by intrinsic functional connectivity: mapping, assessment of stability, and relation to Alzheimer's disease. The Journal of Neuroscience. 2009;29(6):1860–1873. doi: 10.1523/JNEUROSCI.5062-08.2009. [DOI] [PMC free article] [PubMed] [Google Scholar]
- 21.Lawrie SM, Buechel C, Whalley HC, Frith CD, Friston KJ, Johnstone EC. Reduced frontotemporal functional connectivity in schizophrenia associated with auditory hallucinations. Biological psychiatry. 2002;51(12):1008–1011. doi: 10.1016/s0006-3223(02)01316-1. [DOI] [PubMed] [Google Scholar]
- 22.Grandjean J, Schroeter A, Batata I, Rudin M. Optimization of anesthesia protocol for resting-state fMRI in mice based on differential effects of anesthetics on functional connectivity patterns. Neuroimage. 2014;102:838–847. doi: 10.1016/j.neuroimage.2014.08.043. [DOI] [PubMed] [Google Scholar]
- 23.Fox MD, Zhang D, Snyder AZ, Raichle ME. The global signal and observed anticorrelated resting state brain networks. Journal of neurophysiology. 2009;101(6):3270–3283. doi: 10.1152/jn.90777.2008. [DOI] [PMC free article] [PubMed] [Google Scholar]
- 24.Nasiriavanaki M, Xia J, Wan H, Bauer AQ, Culver JP, Wang LV. High-resolution photoacoustic tomography of resting-state functional connectivity in the mouse brain. Proceedings of the National Academy of Sciences. 2014;111(1):21–26. doi: 10.1073/pnas.1311868111. [DOI] [PMC free article] [PubMed] [Google Scholar]
- 25.Yao J, Kaberniuk AA, Li L, Shcherbakova DM, Zhang R, Wang L, Li G, Verkhusha VV, Wang LV. Multiscale photoacoustic tomography using reversibly switchable bacterial phytochrome as a near-infrared photochromic probe. Nature methods. 2016;13(1):67–73. doi: 10.1038/nmeth.3656. [DOI] [PMC free article] [PubMed] [Google Scholar]
- 26.Jathoul AP, Laufer J, Ogunlade O, Treeby B, Cox B, Zhang E, Johnson P, Pizzey AR, Philip B, Marafioti T, Lythgoe MF. Deep in vivo photoacoustic imaging of mammalian tissues using a tyrosinase-based genetic reporter. Nature Photonics. 2015;9(4):239–246. [Google Scholar]
Associated Data
This section collects any data citations, data availability statements, or supplementary materials included in this article.


