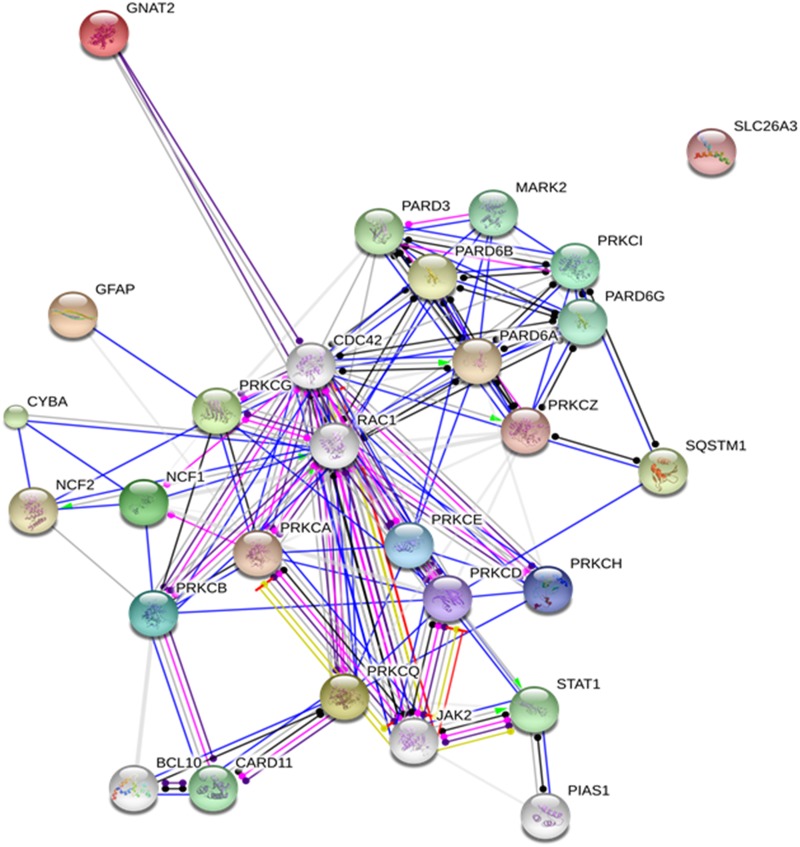
Figure 5. Protein network depicting interactions among protein kinase C variants and their potential substrates.
For generating the network the existing information of protein-protein interaction in the body of contemporary biomedical literature was exploited. Blue lines indicate direct binding between partnering molecules, green lines indicate activation and red lines indicate inhibition, whereas purple lines indicate catalysis, pink lines indicate posttranslational modification, yellow lines indicate transcriptional regulation and black lines indicate a generic reaction. Arrows indicate a positive action, bars indicate a negative action and ball-ends indicate a directional interaction of unknown nature. Proteins are represented by gene names. The network was generated by STRING 10.0 [19].

