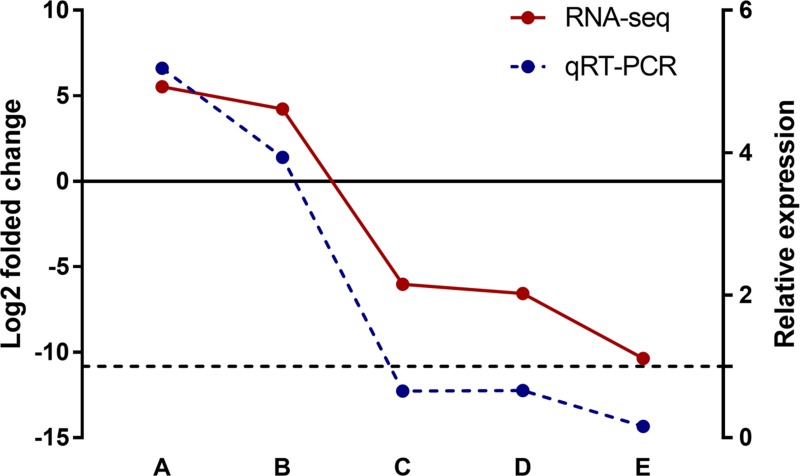
Figure 7. Validation of differentially expressed lncRNAs in silica particle exposed macrophages.
In GSE13005 microarray data set, the log2 folded change value of each differentially expressed lncRNA was shown in red color with a solid line, refering to the left Y axis. The up/down regulated lncRNAs were divied by the solid line (Y = 0), lncRNA Meg3 (A) and Rain (B) were up regulated (p < 0.01), while Pvt1 (C), 1700020I14Rik (D), and 2900097C17Rik (E) were down regulated (p < 0.01). Consistently, the lncRNAs involved in macrophages that exposed to a concentration of 100 μg/ml silica particles (3 samples in parallel per lncRNA) shown the same expression trend as RNA-Seq (the p valves of A–E were < 0.001, < 0.001, 0.002, 0.003, and < 0.001 respectively), and the relative expression levels of the selected lncRNAs were shown in blue color with a dotted line (right Y axis, Y = 1).

