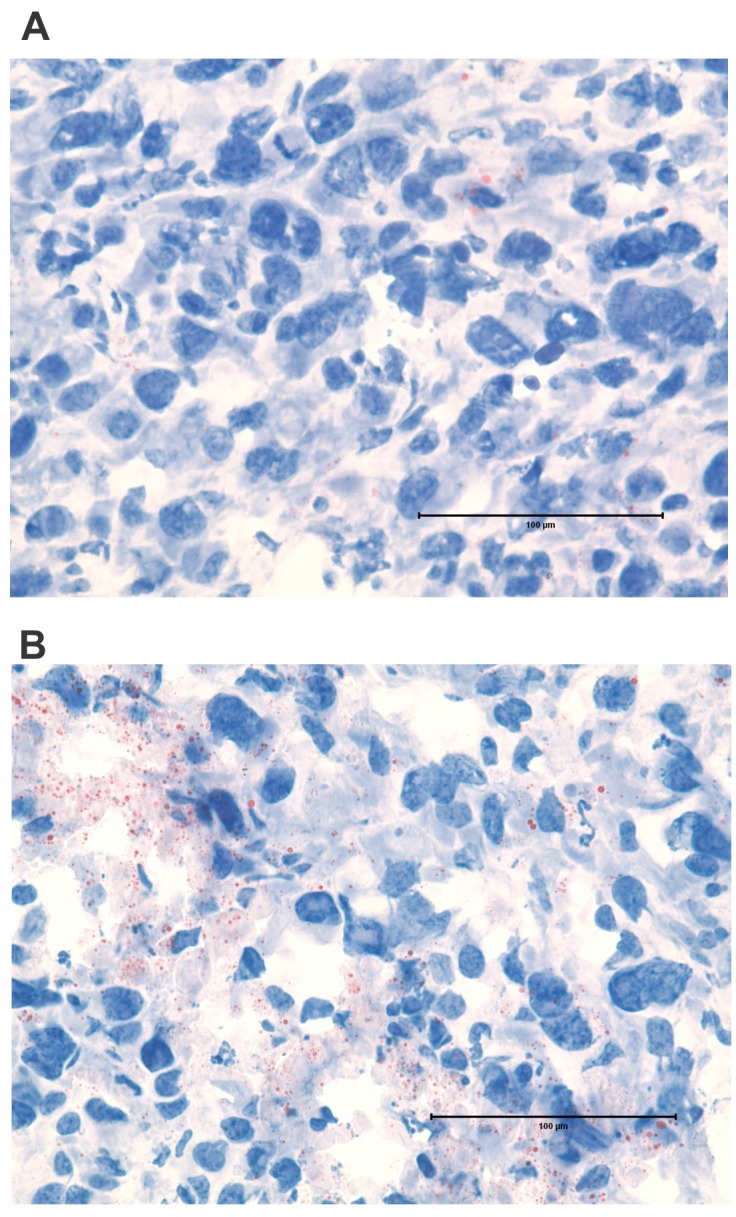
Figure 7. Lipid droplets form in tumor cells following ACTIV therapy.

Sections of subcutaneous E0771-Her2 tumors were stained with Oil Red O and analyzed using light microscopy. Sections shown are representative of (A) non-treated tumors and (B) tumors 5 days after ACTIV treatment. Lipid droplets stain red. Size bar = 100 μm.
