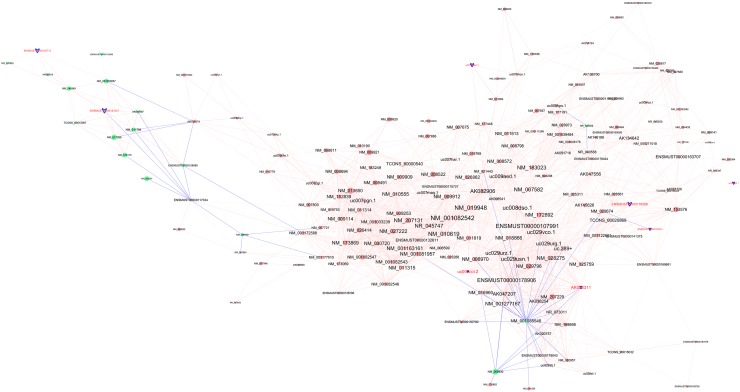
Figure 5. Co-expression network of the differentially expressed lncRNAs and mRNAs.
Notes: Round nodes represent protein-coding genes and arrow nodes represent lncRNAs. Red nodes represent up-regulated genes or lncRNAs, green nodes represent down-regulated genes or lncRNAs, and blue nodes represent those 8 tested lncRNAs. A red line represents a positive correlation, and a blue line represents negative correlation. The node size represents the connectivity, briefly, larger node means that more genes or lncRNAs are co-expressed with this gene or lncRNA.

