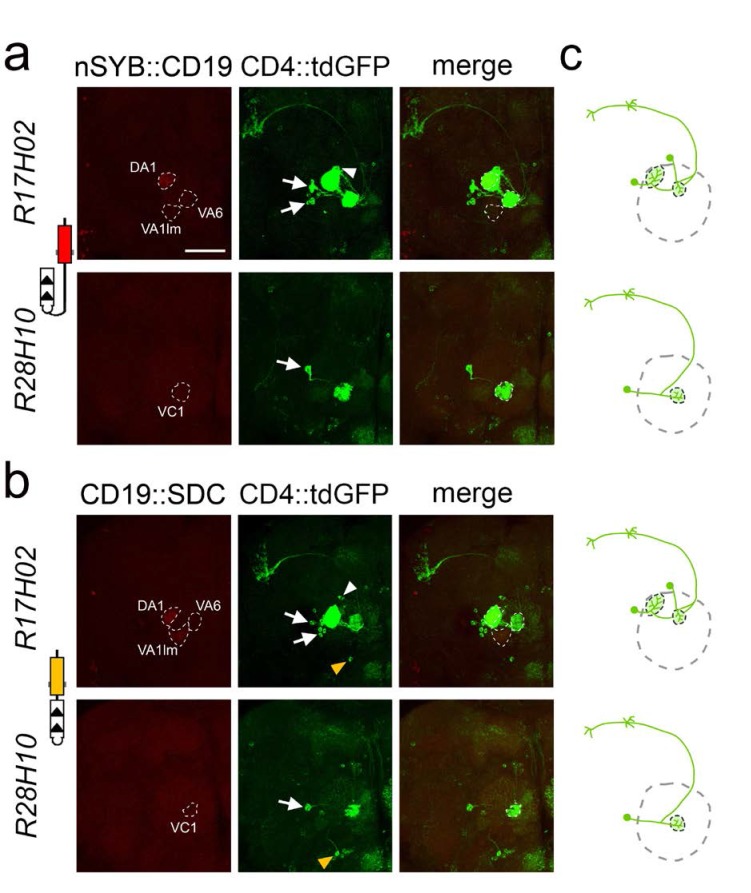
Figure 3. Selective labeling of PNs that receive synaptic input from ORNs in identified glomeruli.
(a) Labeling of PNs that receive synaptic input from ORNs expressing the ligand nSyb::CD19 in identified glomeruli using the R17H02 (top panels) and R28H10 (bottom panels) LexA drivers. Left: nSyb::CD19+ axons from ORNs (red) driven by R17H02- and R28H10-LexA branch in identified glomeruli (stippled circles). In R17H02 the nSyb::CD19 expression level was low in VA6 and VA1lm, and expression in DA1 was only visible after signal amplification by immunostaining. Center: Induction of CD4::tdGFP expression in PNs triggered by nSyb::CD19+ ORNs (red, left panels). In R17H02 (top center) two uniPNs with dendrites branching into DA1 (arrows) and one neuron branching into VA6 (arrowhead) were labeled. No GFP+ PN branched in VA1lm. In R28H10 (bottom center) a single uniPN with dendrites branching in VC1 was GFP+ (arrow). (b) Tracing the neuronal connections from the ORNs expressing the ligand CD19::sdc in identified glomeruli by using the R17H02 (top panels) and R28H10 (bottom panels) LexA drivers. Left: CD19::sdc+ axons from ORNs (red) driven by R17H02- and R28H10-LexA branch in the identified glomeruli (stippled circles). In the VA6 glomerulus of R17H02 and VC1 of R28H10, the CD19::sdc expression level was too low to be detected by immunostaining, but the expression in DA1 and VA1lm of R17H02 was above the detection level. Center: Induction of CD4::tdGFP expression in PNs triggered by CD19::sdc+ ORNs (red, left panels). In R17H02 (top center) there were uniPNs projecting to DA1 (arrows) and VA6 (arrowhead). In R28H10 (bottom center) a single uniPN projecting to VC1 was GFP+ (arrow). Expression of CD19::sdc with R28H10 and R17H02 induced GFP expression in a single multiPN (yellow arrowhead). (c) The diagrams show the induction pattern of uniPNs from (a) and (b). The multiPNs detected in (b) are not included. Scale bar = 50 μm.

