

SUMMARY
Ataxia telangiectasia (A-T) is a rare autosomal recessive disease characterized by progressive neurodegeneration and cerebellar ataxia. A-T is causally linked to defects in ATM, a master regulator of the response to and repair of DNA double-strand breaks. The molecular basis of cerebellar atrophy and neurodegeneration in A-T patients is unclear. Here we report and examine the significance of increased PARylation, low NAD+ and mitochondrial dysfunction in ATM-deficient mice and worms. Treatments that replenish intracellular NAD+ reduce the severity of A-T neuropathology, normalize neuromuscular function, delay memory loss and extend lifespan in both animal models. Mechanistically, treatments that increase intracellular NAD+ also stimulate neuronal DNA repair and improve mitochondrial quality via mitophagy. This work links two major theories on aging, DNA damage accumulation and mitochondrial dysfunction through nuclear DNA damage-induced nuclear-mitochondrial signaling, and demonstrates that they are important pathophysiological determinants in premature aging of A-T, pointing to therapeutic interventions.
Graphical abstract

INTRODUCTION
Ataxia telangiectasia (A-T) is a rare autosomal recessive disease characterized by uncoordinated movement, telangiectasia, radio-sensitivity and cerebellar atrophy (Shiloh and Ziv, 2013). A-T is caused by mutation of the Ataxia-Telangiectasia Mutated (ATM) gene, encoding the ATM kinase, a master regulator of DNA damage processing (Shiloh and Ziv, 2013). In response to DNA damage, the Mre11-Rad50-Nbs1 (MRN) complex is recruited to the site of the DNA double strand breaks (DSBs), and then ATM is activated by autophosphorylation, which converts the inactive ATM dimer to an active monomer, promoting DNA repair (Bakkenist and Kastan, 2003; Guo et al., 2010; Shiloh and Ziv, 2013). ATM heterozygotes are common in the general human population (0.5% - 1%) and this genotype is linked to elevated risk of cancer and some age-related diseases (Lavin et al., 2007; Mateo et al., 2015; Shiloh and Ziv, 2013). While some major features of A-T likely reflect defective repair of DSBs (DSBR), the molecular basis of cerebellar atrophy in A-T is poorly understood.
Defects in DNA repair can be associated with mitochondrial (MT) dysfunction, neuropathy and ataxia as reported in ATM (Guo et al., 2010; Ito et al., 2004; Valentin-Vega et al., 2012), Xeroderma pigmentosum complementation group A (XPA) and Cockayne syndrome group B (CSB) (Fang et al., 2014; Scheibye-Knudsen et al., 2014; Scheibye-Knudsen et al., 2013). In these conditions, DNA repair defects are associated with persistent DNA damage, hyperactivation of poly-ADP-ribose polymerase 1 (PARP1), and low intracellular NAD+, an essential cofactor for PARP1-catalyzed PARylation of its target substrates (Fang et al., 2014; Fang et al., 2016; Scheibye-Knudsen et al., 2014). NAD+ is a key cellular factor linked to metabolism, MT health, stem cell rejuvenation, neuroprotection, and longevity in worms and mice (Igarashi and Guarente, 2016; Verdin, 2015a; Zhang et al., 2016). NAD+ is also a required co-factor of SIRT1, a nuclear deacetylase that modulates chromatin structure and regulates MT biogenesis by deacetylating PGC-1α, a nuclear transcription factor (Chalkiadaki and Guarente, 2015; Lagouge et al., 2006; Verdin, 2015b). PARP1 and SIRT1 compete for NAD+ and may reciprocally limit each other’s activity. Based on these and other observations reported by us and others, we propose that persistent DNA damage activates signaling from the nucleus to the mitochondria, which we call NM signaling. This DNA damage-induced NM signaling pathway may play an important role in normal aging and some specific age-related pathologies (Fang et al., 2016).
Here, we investigate MT dysfunction and its relationship to neurological defects in rat neurons, worms (C. elegans) and mouse models of A-T. Results presented here show that restoration of the NAD+/SIRT1 signaling reduce the severity of neurological defects and increase healthspan and lifespan in these model systems. NAD+ replenishment also stimulate DNA repair and mitophagy. These results encourage consideration of therapeutic intervention in certain DNA repair-deficient diseases.
RESULTS
Activation of the NAD+/SIRT1 pathway is beneficial for ATM-knockdown neurons
We investigated the effects of ATM knockdown (ATM-KD) on rat primary neurons and human SH-SY5Y neuroblastoma cells (Fig. S1A). ATM-KD cells displayed higher MT membrane potential, higher MT content and more reactive oxygen species (ROS) than wild type cells (Fig. 1A-C, and Fig. S1B). These features could reflect a low rate of ATP production, low expression of MT uncoupling proteins (Fang et al., 2014) and/or inadequate/inefficient clearance of damaged mitochondria. In addition, ATM-KD neurons displayed increased PARylation (PAR), suggesting increased activity of PARP1 (Figs. 1D and S1C). Consequently, these cells have low intracellular NAD+ (Fig. 1E) as reported previously (Stern et al., 2002). Consistent with competition between PARP1 and SIRT1 for NAD+ (Canto et al., 2015; Verdin, 2015b), p53 and PGC-1α are hyper- acetylated in these ATM-KD neurons suggesting impaired deacetylation activity of SIRT1 (Figs. 1D, S1C, and S6L).
Figure 1. Compromised NAD+/SIRT1 signaling induces MT dysfunction and impairs neuronal development in ATM-deficient primary neurons.

(A-C) Relative MT membrane potential (A), MT ROS (B), and MT content in control and ATM-KD rat cortical neurons with different treatments. Values are the mean ± S.E.M. (n = 6-10 cultures/group).
(D) Immunoblot of protein levels from control and ATM-KD neurons after various treatments. To detect acetylated PGC-1a, PGC-1a was immunoprecipitated then blotted for acetyl lysine.
(E) Relative cellular NAD+ levels in control and ATM-KD rat cortical neurons with different treatments. Values are the mean ± S.E.M. (n = 6-10 cultures/group).
(F) Effects of NAD+ supplementation with NR on etoposide (Et)-induced apoptotic cell death, with cleaved caspase-3 staining, in control and ATM-KD neurons.
(G) Representative confocal microscopy images of control and ATM-KD neurons stained for the neuronal marker TUJ-1 and the DNA double-strand break (DSB) marker 53BP1.
(H) Levels of the indicated proteins were evaluated by immunoblot analysis in lysates of cultured control and ATM-KD neurons. Veh, vehicle (DMSO); NR, nicotinamide riboside, 500 μM; NMN, nicotinamide mononucleotide, 500 μM; Resv, resveratrol, 5 μM; SRT1720/SRT, 2 μM; Ola, Olaparib, 500 nM; Veli, Veliparib, 500 nM. *p < 0.05, **p < 0.01,***p < 0.001, and n.s., not significant.
See also Figure S1.
Next we determined if restoration of NAD+ levels and SIRT1 activity could reverse the MT phenotypes of ATM-KD cells. To replenish the NAD+/SIRT1 signaling, we treated ATM-KD and WT neurons with the NAD+ precursor nicotinamide riboside (NR), a SIRT1 activator SRT1720, and the PARP1 inhibitor Olaparib. Both NR and Olaparib treatment significantly increased NAD+ levels in control and ATM-KD neurons, whereas no significant effect was seen for SRT1720 (Fig. 1E). Although SRT1720 did not increase NAD+ levels, it did increase SIRT1 activity (Figs. 1D and S1C), consistent with an allosteric activation of SIRT1 (Hubbard et al., 2013). All three compounds ameliorated ATM loss-induced MT pathological phenotypes (Fig. 1A-C). NR also significantly decreased apoptosis in etoposide-treated cells and reduced staining with anti-53BP1, a marker for DNA damage (Figs. 1F-G and S1D). All three compounds improved neurite morphology (Figs. 1G and S1E). At the protein level, the neurotrophic factor BDNF, the transcription factor CREB, and synapse markers Synapsin 1 and PSD95 were reduced in ATM-KD neurons (Fig. 1H), consistent with a previous report (Li et al., 2012). Importantly, restoration of the NAD+/SIRT1 pathway partially rescued the levels of these proteins (Fig. 1H). Collectively, the results demonstrate that compromised NM signaling through the NAD+/SIRT1 pathway contributes to the neuronal pathology in ATM-KD neurons by impairing MT function.
Impaired NAD+/SIRT1 signaling elicits behavioral abnormalities in atm-1 worms
Previous studies show that an allele of C. elegans ATM-1 that lacks the kinase domain, atm-1(gk186), hereafter called atm-1, confers an A-T-like phenotype, including genomic instability, sensitivity to radiation and infertility (Jones et al., 2012). atm-1 worms also have a significantly shorter lifespan (16.2 days) than N2 (wild type) worms (19.1 days) (Figs. 2A and S2A), and lower intracellular NAD+ than N2 at adult day 7 (D7) (Fig. S2B). As for ATM-KD neurons, we examined the effect of NR, SRT1720, or Olaparib on worm health, when treated from L4 stage onward. All three compounds increased median lifespan of atm-1 (Figs. 2B-C and S2A). Combined treatment with NR and SRT1720 did not extend lifespan significantly beyond what was achieved with either treatment alone (Fig. 2B, C, and S2A), suggesting that they acted through overlapping pathways.
Figure 2. Restoration of the NAD+/SIR-2.1(SIRT1) signaling extends both lifespan and healthspan in short-lived atm-1 worms.

(A-C) Lifespan of N2 (wild type) or atm-1 worms treated with NR, SRT, Ola, or NR+SRT beginning at the L4 stage (n = 150 worms).
(D) Swimming movement rates of D10 adult worms of the indicated strains after different treatments (mean ± S.E.M, n = 15-20 worms/group).
(E-F) Long-term associative memory (LTAM) and short-term associative memory (STAM) in adult D4 N2 and atm-1 worms in the different treatment groups (mean ± S.D., n = 60 worms).
(G-H) Effects of NR, SRT, and Ola on muscle MT network morphology of adult D4 N2 and atm-1 worms. A myo-3∷gfp reporter gene was expressed in both nucleus and mitochondria to mark non-pharyngeal body wall muscle cells. Arbitrary score of MT network (mean ± S.E.M.; n = 53-67 muscle cells from 20 worms) (G) and representative confocal images of each condition are presented (H). MT morphology was scored on a scale from 1-5 where the value 1 denotes a severely impaired MT network, and 5 indicates a very well-organized MT network.
(I) Representative thin-section electron micrographs of D7 N2 and atm-1 worms with different treatments. Cu, cuticle; Hy, hypodermis; M, muscle sarcomeres; Mito, mitochondrion.
(J) Representative immunoblots from young (D1), middle aged (D10) and old (D17) N2 and atm-1 worms. For all the experiments, worms from L4 stage were exposed to vehicle control, NR (500 μM), SRT (10 μM), or Ola (500 nM). For panels D-G, *p < 0.05, **p < 0.01, or ***p < 0.001.
See also Figure S2.
Because ataxia is a major clinical finding in A-T patients (Shiloh and Ziv, 2013), we evaluated locomotion defects in atm-1 C. elegans. D10 adult atm-1 displayed lower swimming movements and the rate of pharyngeal pumping, while treatment with NR, SRT1720, or Olaparib improved these parameters in both atm-1 and N2 worms (Figs. 2D and S2C). As a measure of cognitive function, long- and short-term associated memory (LTAM and STAM, respectively) were measured using a chemotaxis assay (Kauffman et al., 2010) in atm-1 and N2 worms. To avoid confounding defects in locomotion and LTAM/STAM, these experiments were performed in D1 and D4 worms, before locomotion defects manifest themselves in atm- 1 worms. Severe defects in LTAM and STAM were evident in D4 but not in D1 atm-1, in agreement with a progressive neuronal dysfunction. However, LTAM and STAM were normalized in worms treated with NR, SRT1720 or Olaparib (Fig. 2E-F).
We postulate that MT dysfunction contributes to neuropathology in A-T. Therefore, MT networks were visualized by confocal microscopy in atm-1 worms crossed with ccIs4251, a muscle specific pmyo-3∷gfp strain. In D4 N2 worms, the MT network was well organized in parallel to the myofilament lattice (Fig. 2G-H) (Palikaras et al., 2015). In contrast, the MT networks in D4 atm-1;ccIs4251 worms appeared disorganized and aggregated mitochondria were detected in ~30% of the GFP-expressing cells. All three compounds normalized the MT network in atm-1 worms (Fig. 2G-H). Electron microscopy (EM) showed that ≈ 15% of the sarcomeres were disrupted in atm-1 worms at D7 with thickening of cuticle and hypodermis (Fig. 2I). This suggests that atm-1 worms exhibit features of premature aging.
To further explore the underlying beneficial effects of NAD+, we examined the expression levels of factors important for the MT stress response at three different ages of the worms. PAR increased steadily with age in N2 and atm-1 worms. The apparent steady-state level of PAR was higher in atm-1 than in N2 worms and the PAR level was lower in D7 and D17 atm- 1 worms treated with NR, SRT1720 or Olaparib (Fig. 2J). However, PAR decreased less in D17 than in D7 worms treated with these agents, possibly because uptake decreases when worms stop eating at approximately D8 at 25° C. The worm homologue of CREB, CRH-1, was lower in atm-1 than in N2 worms at D7, but the level was normalized in D7 atm-1 worms treated with NR, SRT1720 or Olaparib (Fig. 2J). atm-1 worms also expressed HSP-6 at a lower level than N2 worms, and this marker was also normalized in D7 and D17 atm-1 worms treated with NR, SRT1720 or Olaparib (Fig. 2J). When similar experiments were carried out in atm-1(gk186);sir-2.1(ok434) worms, that lack expression of Sir-2.1 which is a orthologue to mammalian SIRT1, nearly all of the effects of NR, SRT1720 and Olaparib noted above were blocked (Figs. 2D, S2C). These results indicate that atm-1 worms have defects in lifespan and healthspan that can be rescued by boosting the NAD+/SIR-2.1 pathway.
Omics analyses reveal conserved pathway changes with NR, SRT1720 and Olaparib
We used comparative microarray and proteomic analyses to elucidate potential molecular mechanisms. Animals were treated at L4 and harvested and analyzed at D1 (young) or D10 (old) (Fig. 3A). NR, SRT1720 and Olaparib induce/repress comparable numbers of genes to a similar extent in a similar direction in N2 and atm-1 worms (Figs. 3A and S2D-E). Values on the lines connecting the spheres indicate upregulated genes in red and downregulated genes in blue. Pathway analysis identified 70 pathways affected by all three compounds in atm-1 worms; 54/70 pathways (77%) changed in the same direction for all three compounds (Table S1), 49/70 pathways had a Z-score ≥ |±1.5| for at least one compound, and 90% or these changed in the same direction (Table S1). Venn diagrams of 49 pathways with Z-score ≥ |±1.5| showed that 16 pathways were altered by all three compounds. These pathways included pharyngeal pumping, locomotion, genomic stability, and development (Fig. 3B-D). These data add to the identification of downstream molecular pathways impacted by NAD+/SIR-2.1 signaling in atm-1 worms.
Figure 3. Improved NAD+/SIR-2.1(SIRT1) signaling rescues the transcriptomic and proteomic phenotypes of atm-1 nematodes.

(A) Diagram showing unique and shared genes in N2 and atm-1 worms. For numbers, red denotes upregulated genes while blue denotes downregulated genes. Numbers on the line between the linked circles show shared numbers of genes. Acronyms for all 16 groups of treatments are denoted. (B-D) There are 49 common pathways induced by all the three compounds (NR, SRT and Ola). For each pathway, at least one of the compounds induced a change of Z-score ≥ |±1.5|. Venn diagram analysis of these pathways shows 16 shared pathways with 2 up-regulated and 14 down-regulated.
(E) The three protein selection criteria for NR/SRT/Ola-treated D10 atm-1 worms are shown along with a list of proteins which fulfilled these criteria. Each protein was ascribed a molecular function and are further described in Table S2.
(F) Venn diagram of proteomic results showing that aging has a more profound effect on atm-1 than N2 worms.
(G) Venn diagram showing that NR induces more protein changes in atm-1 worms compared to N2 worms.
(H) Biochemical process analysis of proteome-wide results from NR-treated D10 atm-1 worms reveals multiple health benefits after augmentation of the NAD+/SIR-2.1 pathway.
See also Figure S2; Tables S1-4.
Quantitative proteomic analyses were performed on four biological replicates from worms treated identically and in parallel to those used for gene expression analyses. A heat map of the normalized protein expression data revealed that genotype and age were the most significant variables separating the datasets, and suggested that all the compounds are working through the same pathways (Fig. S2F). Statistical approaches were used to analyze these data. First, we used the non-parametric Wilcoxon’s test across the entire dataset and identified 277 proteins which were differentially-expressed in D10 atm-1 worms (D10 N2 as reference). They fall into the following Gene Ontology classifications: adult lifespan, locomotion, fertility and reproduction (Table S2). Three criteria (termed “3C”, listed in Fig. 3E) were used to identify proteins that are differentially-expressed in atm-1 but restored to N2 levels by NR, SRT1720 or Olaparib. This identified 99 proteins (Table S2), of which 45 overlap with the 277 proteins from Wilcoxon’s test. Proteins affecting lifespan, locomotion, MT function and redox homeostasis, UPR, and DNA damage response were specifically altered by NR, SRT1720 or Olaparib in D10 atm-1 animals (Fig. 3E).
Two-sample t-tests were used for pairwise comparison of normalized protein expression in the two strains and age groups in presence and absence of NR. The results indicate that age has a more significant effect on protein expression in atm-1 than N2 worms, and although some proteins were regulated in the same direction in D10 N2 and D10 atm-1, many expression changes appeared to be unique to atm-1 worms (Fig. 3F, Table S3). Relatively few changes and no pathways were significantly altered by NR in D1 worms (data not shown). Although NR affected protein expression in N2 and atm-1 worms, the response was greater in atm-1 worms (Fig. 3G, Table S3). The pathways affected by NR in D10 atm-1 worms were associated with growth, fertility, metabolic and development (Figs. 3H and S2G).
We further looked for differentially-regulated genes that are regulated by the neuroprotective CREB/CRH-1 (Mair et al., 2011). In NR-treated D1 or D10 N2 worms, 7 or 209 CRH-1-regulated genes were differentially expressed, respectively (Table S4). In contrast, in NR-treated D1 atm-1 worms, 137 or 219 CRH-1-regulated genes were differentially-expressed, indicating that age-related changes are already evident in young atm-1 (Table S4). In mammals, SIRT1 contributes to the stability of CREB (Gao et al., 2010). The levels of the worm CREB homologue CRH-1 declined in an age-dependent manner and compound treatments could partially restore expression in D7 atm-1 (Fig. 2J). Collectively, we have identified several pathways that NR, SRT1720 and Olaparib altered to elicit a similar biological effect.
Restoration of the NAD+/SIRT1 pathway improves MT homeostasis in A-T models
We investigated whether MT dysfunction associated with ATM-KD or mutation might be due to defective mitophagy, a process that degrades damaged mitochondria by a lysosome-mediated mechanism (Menzies et al., 2015). Imaging by EM revealed increased size heterogeneity, more damaged mitochondria, and less evidence of ongoing mitophagy in ATM-KD than in control SH-SY5Y cells (Fig. 4A-B), and the MT defects were significantly normalized by treated with NR (Figs. 4A-B and S3A-D). Cells expressing a mitochondria- targeted form of monomeric Keima (mt-mKeima) were used to quantify mitophagy in ATM- KD cells (Sun et al., 2015). Mitophagy is clearly suppressed in ATM-KD HeLa cells relative to WT. NR significantly stimulates mitophagy in ATM-KD cells and to a lesser extent, also stimulates mitophagy in WT cells (Fig. 4C-D). Consistently, defective mitophagy in ATM-KD neurons could be significantly rescued with NR as judged by colocalization of a MT marker cytochrome c oxidase subunit IV (COX-4) and LC3, a marker of autophagy (Fig. S3E-F).
Figure 4. Reduction of the NAD+/SIRT1 pathway inhibits mitophagy and perturbs MT homeostasis in ATM-deficient neurons and worms.

(A) Electron microscopy images showing MT morphology of control transfected and ATM-KD SH-SY5Ycells after treatment with vehicle or 500 μM NR. Mitochondria likely undergoing mitophagy (yellow arrow) and damaged mitochondria (red arrow) were marked. (B) Quantification of MT length from images such as those shown in panel A. Data are the mean ± S.D. (306 - 514 mitochondria in cells from 3 separate cultures).
(C-D) Detection of mitophagy using a mt-mKeima fluorescent reporter in HeLa cells with/without NR treatment (500 μM). FCCP (30 μM for 3 h) was as positive control. Cells were imaged by confocal microscopy (C) and quantified for mitophagy (D).
(E) A proposed working model for the mechanism of how the NAD+/SIR-2.1 pathway promotes MT maintenance.
(F) Effects of NR (500 μM) on the induction of mitophagy in N2 and atm-1 worms. A MT toxicant paraquat (1 mM) was used as a positive control. Data are the mean ± S.E.M. (n=37- 57 muscle cells/group from 20 worms).
(G) Relative DCT-1 protein levels were determined by quantifying levels of DCT-1 associated fluorescence (mean ± S.D., n = 10).
(H) Relative mRNA levels of dct-1. Data are the mean ± S.D. from three groups of worms.
(I) Contribution of NR-induced mitophagy to the improvement of healthspan (pharyngeal pumping) in N2 and atm-1. Vehicle- or NR-supplemented worms were fed with control RNAi or RNAi targeting the designated mitophagy genes at the egg hatching stage, followed by analysis of pharyngeal pumping on D7 adult worms. *p < 0.05, **P < 0.01, or ***p < 0.001, and n.s., not significant.
See also Figures S3-4.
It is well established that SIR-2.1 induces MT biogenesis in worms (Mouchiroud et al., 2013), but its roles in mitophagy and the underlying molecular mechanisms are poorly understood. LGG-1 is the worm homolog of a key mammalian autophagy marker LC3, while DCT-1 is the worm homolog of NIX/BNIP3L, a protein that regulates mitophagy and has been implicated in longevity and healthspan (Palikaras et al., 2015). The dct-1 gene can be regulated by the pro-longevity transcription factor DAF-16 (Palikaras et al., 2015) but the role for sir-2.1 in this pathway has not been investigated. We hypothesized that SIR-2.1 might regulate not only MT biogenesis but also mitophagy via the DCT-1 pathway (Fig. 4E). We crossed atm-1 worms with a MT mitophagy reporter strain (Palikaras et al., 2015) to visualize the expression and colocalization of LGG-1 and DCT-1 in atm-1 worms (Fig. S4A). The positive control, paraquat (Palikaras et al., 2015), induced mitophagy in N2, but failed to induce mitophagy in atm-1, suggesting that ATM deficiency causes a defect in mitophagy (Fig. 4F and Fig. S4B). The colocalization coefficient of LGG1∷DsRed and DCT-1∷GFP proteins was substantially lower in atm-1 than N2 (~50%), but NR treatment increased it in atm-1 to levels similar to N2 worms (Fig. 4F and Fig. S4B). The atm-1 worms treated with NR showed significantly elevated levels of DCT-1∷GFP compared to vehicle-treated atm-1 worms (Fig. 4G), demonstrating that NR can restore DCT-1 protein expression and improve mitophagy.
Because SIR-2.1 can directly upregulate the transcriptional activity of DAF-16 (Berdichevsky et al., 2006; Kenyon, 2010), we determined if sir-2.1 could affect dct-1 expression via daf-16. We knocked down sir-2.1 or daf-16 independently in N2 and found that dct-1 expression was dependent on sir-2.1 (Fig. 4H). Consistent with the lower DCT-1∷GFP protein level in atm-1 (Fig. 4G), dct-1 gene expression was only half of that in N2 worms. However, its expression could be robustly enhanced in atm-1 by supplementation with NR in a sir-2.1- and daf-16- dependent manner (Fig. 4H). PINK-1 and PDR-1 are integral mitophagy mediators and are likely upstream of DCT-1 in the mitophagy pathway (Fig. 4E) (Palikaras et al., 2015). We further confirmed that the improved MT network morphology in atm-1 NR-treated worms could not be corrected after RNAi knockdown of dct-1 or pink-1, demonstrating that the positive effects of NR require these genes (Fig. S4C, D).
To verify the roles of daf-16 and dct-1 in the beneficial effects of NR on worm health, pharyngeal pumping rates of D7 worms were quantified in daf-16, pink-1, pdr-1, or dct-1 RNAi treated N2 and atm-1 worms (Fig. 4I). The beneficial effects of NR were significantly abrogated by knockdown of each of these four gene targets. Interestingly, we noticed some minor remaining benefits of NR in pink-1/pdr-1/daf-16/dct-1 RNAi treated atm-1 worms, indicating possible participation of some NAD+-related but mitophagy-independent pathways in promotion of healthspan in atm-1 worms. In summary, our data suggest NR improves healthspan, at least in part by stimulating mitophagy.
DNA repair can be improved by increased NAD+/Sirtuins signaling
ATM protein kinase plays an important role in homologous repair- (HR-) and nonhomologous end-joining- (NHEJ-) mediated DSBR, with NHEJ being the predominate DSBR pathway in neurons and other post-mitotic cells (Dobbin et al., 2013; McKinnon, 2013; Muraki et al., 2013). NHEJ-mediated DSBR requires DNA-dependent protein kinase catalytic subunit (DNA-PKcs), a serine/threonine protein kinase in the same family as ATM (Paull, 2015). During NHEJ-mediated DSBR, Ku70/Ku80 is recruited first to DSBs followed by DNA-PKcs, forming the DNA-PK complex (Paull, 2015). Deacetylation of Ku70 by SIRT1 and autophosphorylation of DNA-PKcs at position S2056 are critical to activate DNA-PKcs (Chen et al., 2005; Cohen et al., 2004a; Cohen et al., 2004b). In control and ATM-KD SH-SY5Y cells treated with or without etoposide and with or without NR (Fig. 5A), ATM-KD SH-SY5Y cells had higher levels of acetyl-Ku70 than control cells and this was normalized by treatment with NR (Fig. 5A). Unstressed control cells had low auto-phosphorylation of DNA-PKcs, but this increased in etoposide-treated cells (Fig. 5A). In ATM-KD SH-SY5Y cells autophosphorylation of DNA-PKcs was also low, etoposide had little effect in untreated cells, but it increased in NR-treated cells (Fig. 5A). This suggests a defect in NHEJ in ATM-KD SH- SY5Y cells that is partially corrected by treatment with NAD+ repletion. We further verified that NR-induced improvements in the DNA damage response signaling were dependent on SIRT1 by knocking down SIRT1 in the ATM-KD SH-SY5Y cells (Fig. 5A). Of note, NR decreased the abundance of acetylated Ku70 in SIRT1-KD cells (lane 10, Fig. 5A), suggesting that a backup enzyme exists and provides a function redundant to SIRT1 in these cells. NR also causes an increase in Ku70 and DNA-PKcs on chromatin in cells with or without etoposide-induced DNA DSBs (Fig. 5B).
Figure 5. Restoration of the NAD+/SIRT1(SIR-2.1) pathway improves DNA repair in both ATM-deficient primary neurons and nematodes.

(A) Representative immunoblots from control and ATM-KD SH-SY5Y cells showing the effects of enhancement of the NAD/SIRT1 pathway on deacetylation of Ku-70 and autophosphorylation of DNA-PKcs.
(B) Representative immunoblots from control and ATM-KD SH-SY5Y cells showing that NAD+ increases the accumulation of Ku70 and DNA-PKcs on chromatin. Soluble nuclear (S.N.) fractions and chromatin fractions were isolated by a commercial kit followed by detection of protein levels by immunoblot.
(C) NHEJ DNA repair efficiency was measured in neurons that were transfected with a predigested NHEJ reporter construct 3 days after either scrambled siRNA, or siRNAs targeting the designated genes. Over 100 neurons/group were counted and data shown are mean ± S.E.M.
(D-E) Effects of restoration of the NAD+/SIR-2.1 pathway on genomic instability revealed by brood size (D) and male frequency (E). The atm-1(gk186) worms were used for brood size counting (D), while late generation atm-1(gk186);(h2681) worms were used for male frequency (E). Data are mean ± S.E.M. (n = 20-30 worms/group, three replicates).
(F) Embryonic NHEJ capacity was measured by scoring the percentage of late stage embryos that could reach to the L4 stage 48 h after irradiation with 90 Gy. Two homologous recombination mutants, brc-1(tm1145) and brd-1(dw1) were used as negative controls, while two NHEJ mutants, cku-70(tm1524) and cku-80(ok861), were positive controls. About 150~300 embryos/group were scored, and data shown are mean ± S.E.M.
NHEJ repair was also measured using a reporter plasmid pEGFP-Pem1-Ad2 in ATM-KD and control neurons treated with or without NR (Dobbin et al., 2013; Mao et al., 2011). Using this assay, ATM -KD neurons demonstrated 30% of the activity of control neurons (Fig. 5C), but was upregulated by treatment with NR in a manner substantially dependent on SIRT1 (Fig. 5C). Some residual effect of NR (Fig. 5A lane 10) is consistent with functional overlap between SIRT1 and SIRT6, the NAD+-dependence of SIRT6 and its known roles in NHEJ and HR (Mao et al., 2011; McCord et al., 2009). In line with this, in SIRT1 and SIRT6 double-KD mutants, no effects of NR were detected (Fig. 5C). Collectively, these data suggest that NHEJ repair in neurons can be stimulated by NR, in both scrambled and siATM-treated cells, and further that the stimulation is dependent on SIRT1 and SIRT6.
atm-1 worms display sensitivity to ionizing radiation, low brood size (fecundity) and high male frequency (Jones et al., 2012). In our studies, we observed that treatment with NR improved brood size by 40% (Fig. 5D) and lowered male frequency from 6.6% to 0.8% (Fig. 5E). The effect of NR on N2 and atm-1 worms exposed to ionizing radiation (IR) (90 Gy) was examined in the late embryonic stage, when NHEJ is the only pathway for DSBR (Lemmens and Tijsterman, 2011). The results show that treatment with NR significantly improved atm-1 survival (Fig. 5F, 41% to 79.6% survival to L4). To confirm that this effect was dependent on NHEJ and not HR, two HR repair-deficient mutants (brc-1(tm1145) and brd-1(dw1)) and two NHEJ mutants (cku-70(tm1524) and cku-80(ok861)) were employed. While growth was not impaired in either brc-1 or brd-1 worms, cku70 and cku80 mutants were extremely sensitive to IR treatment, further confirming the specificity of the assay and the role of ATM in NHEJ in worms (Fig. 5F). Taken together, our data indicate that in ATM-KD neurons and atm-1 worms, NHEJ repair and genomic instability can be improved by NR.
Increasing NAD+ levels improves metabolomic profiles in ATM deficiency
NAD+ plays an important role in the tricarboxylic acid (TCA) cycle, a set of reactions critical to energy metabolism. Metabolism-related proteins that are differentially-expressed in atm-1 but restored to N2 levels by NR, SRT1720 or Olaparib are listed in Fig. 6A. We also identified 156 metabolites in N2 and atm-1 worms (Table S5). The metabolite profile in samples from NMN/NR-treated atm-1 worms clustered more closely with the metabolite profile of WT compared to atm-1 (veh) worms (Fig. 6B). With regard to metabolites in the TCA cycle, atm-1 worms had lower citrate and isocitrate, but higher succinate, fumarate, and malate than N2 worms (Fig. 6C). While the levels of ketogenic amino acids were higher in atm-1 worms, glucogenic AAs did not show a consistent direction of change (Fig. 6C). However, treatment of NR/NMN normalized many of these metabolites (Fig. 6D-G). Proteomic analysis gave results consistent with observed effects on metabolism (Fig. 6H-J). Parallel studies were conducted in Atm−/− mice. Atm−/− mice and their WT littermates were dosed with 12 mM NR in drinking water for 14 days starting at weaning. Metabolomic analysis on cerebellum tissues showed a total of 116 metabolites were identified (Table S5). There was a distinct metabolite profile in Atm−/− mice, and NR treatment normalized the metabolic profile of the Atm−/− mice (Fig. 6K). Collectively, the metabolomics analyses in worms and mice suggest that ATM deficiency induces major changes in the metabolome, and that treatment with NR normalizes the metabolic profile in atm-1 worms and in Atm−/− mice.
Figure 6. NAD+ improves metabolic profiles in atm-1 worms and Atm−/− mice.

(A) Proteomics data showing changes of metabolism-related proteins which fulfilled the ‘3C’ standards. For ‘3C’ standards, see Fig. 3E. Each protein was ascribed a molecular function and are further described in Table S2.
(B) Unsupervised hierarchical clustering of Day 6 worm metabolites among different groups. Whole worm tissues were subjected to ALEX-CIS GCTOF mass spectrometry with more than 156 metabolites identified (Table S5).
(C) Changes of TCA cycle and catabolism of amino acids in atm-1 (veh) compared with N2 (veh). Amino acids in green are ketogenic, in red are glucogenic, and dark ones are involved in both glucogenic and ketogenic processes.
(D-G) Changes of levels of designated metabolites in N2 and atm-1 with/without NR/NMN treatment.
(H-J) Proteomics data showing changes of designated proteins.
(K) Metabolome profiles of mouse cerebellum tissues performed using capillary electrophoresis/time-of-flight mass spectrometry (CE-TOFMA) and capillary electrophoresis- triple quadrupole mass spectrometry (CE-QqQMS) analysis, followed by principle component analysis (n = 3 mice/group).
See also Tables S5.
Boosting NAD+ levels improves lifespan and healthspan in Atm−/− mice
We further examined the effects of NAD+ supplementation by giving Atm−/−male mice and their age- and sex-matched WT littermates NR (12 mM) and another NAD+ precursor, nicotinamide mononucleotide (NMN, 12 mM) (Canto et al., 2015), in their drinking water starting from weaning and continuing for two weeks. The NAD+ levels in the cerebellum of Atm−/−mice were initially about 40% of those in WT, but after 14 days of treatment with NR or NMN, NAD+ levels increased significantly to levels similar to WT mice (Fig. 7A). Atm−/−mice had a significant deficit in motor function before any intervention, and showed a dramatic improvement in the latency of time to their first fall from the rotarod after NR or NMN treatment (Fig. 7B). While there was a significant benefit to Atm−/−mice, there was no significant effect of NR or NMN on the performance of young WT mice. Memory was investigated using the Y maze spontaneous alternation behavioral test. Atm−/−mice displayed roughly 50% of the exploratory behavior of WT mice and, remarkably, both NR and NMN could restore this behavior to normal levels, suggesting improved memory functions (Fig. 7C). Furthermore, the numbers of Purkinje cells in Atm−/−mice treated with NR or NMN were significantly greater than vehicle-treated Atm−/−mice, whereas NR and NMN had no significant effect on Purkinje cell numbers in WT mice (Figs. 7D and S5A).
Figure 7. Increasing NAD+ levels extends lifespan and ameliorates A-T phenotypes through SIRT1 activation in Atm−/− mice.
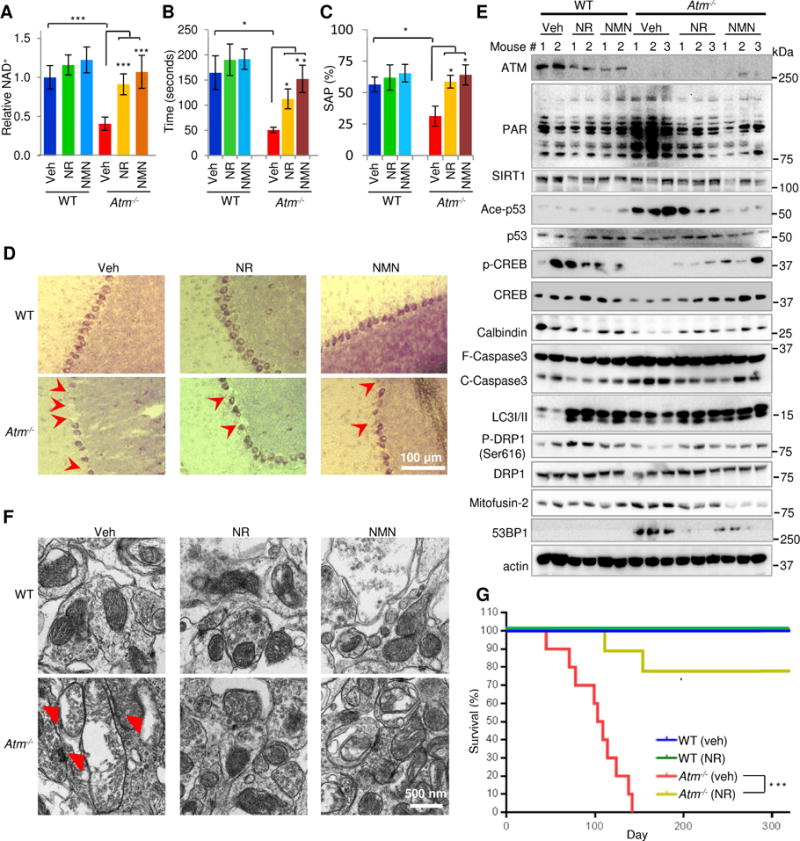
(A-C) Effects of 14 days of NR or NMN supplementation on the NAD+ levels (A), rotarod performance (B), and spontaneous alternation performance (SAP) in the Y maze (C). Data shown are mean ± S.E.M. (n = 3-5 mice/group).
(D) Representative confocal microscopy images of the Purkinje cells in the cerebellum of Atm−/− mice and their WT littermates after 14 days of NR or NMN treatment. Over 10 cerebellar areas for each mouse were analyzed (3-5 mice/group). Quantification of images is shown in Fig. S5A.
(E) Immunoblot analysis of the indicated proteins from the cerebellum of Atm−/− mice and their WT littermates after 14 days of treatment with veh, NR or NMN. Quantification of data is in Fig. S6.
(F) Representative electron microscopy images showing mitochondria in cerebellum tissues of Atm−/−mice and their WT littermates after 14-day veh, NR or NMN treatment (n = 3-5 mice/group). Damaged mitochondria were marked with red arrows. Quantification of data is in Fig. S5B-C.
(G) Kaplan-Meier survival curves of vehicle and NR-treated mice. One month-old Atm−/− mice and their age- and sex-matched WT littermates were exposed to NR (12 mM in drinking water; approximately 570-590 mg/kg/day/mouse) and lifespan was determined (12-20 mice/group). Statistical analysis was performed by the log-rank test.
*p < 0.05, **p < 0.01, or ***p < 0.001. See also Figures S5-S6.
Cerebellum tissues from Atm−/−mice showed elevated PAR staining, increased acetylated p53, and greatly reduced levels of total CREB and p-CREB levels (Figs. 7E and S6A-C). We detected lower levels of cleaved caspase-3 in the NR- and NMN-treated Atm−/−mice compared with vehicle control, suggesting less neuronal death (Figs. 7E and S6D). The protection by NR and NMN on Purkinje cell loss was confirmed by observing reduced levels of a specific Purkinje cell marker, calbindin, in the cerebellum of Atm−/−mice compared to WT mice, and preservation of calbindin levels in Atm−/−mice treated with NR or NMN (Figs. 7E and S6E). In Atm−/−mice, NR and NMN treatment significantly increased LC3-II levels and promoted a redistribution of the fission-fusion balance by decreasing Mitofusin-2 (a MT fusion protein), although there were no statistically significant changes on a fission marker, p-DRP1/DRP-1 (Figs. 7E and S6F-H). Consistently, large and damaged mitochondria were prominent in the Atm−/−mouse cerebellum (Fig. 7F). NR and NMN treatment normalized the MT morphology and minimize damaged mitochondria (Figs. 7F and S5B-C). Additionally, liver and muscle tissues of Atm−/−mice exhibited abnormal levels of several MT proteins which were normalized by NR and NMN treatment, indicating a likely systemic benefit of NAD+ supplementation on mitochondria (Fig. S5D).
To test whether NR altered the level of endogenous DNA damage, comet assays were done on primary rat neuron which had been treated with scrambled siRNA or with siATM. Loss of ATM increased endogenous levels of DNA DSBs that could be ameliorated by NR treatment (Fig. S6K). This suggests that NR can reduce the steady level of endogenous DNA damage. Furthermore, consistent with the improved DNA repair observed in ATM-KD neurons and atm-1 worms after NR treatment (Fig. 5), both NR and NMN significantly decreased 53BP1 levels in Atm−/− mice compared with vehicle suggesting less accumulation of endogenous DNA breaks (Figs. 7E and S6I). Furthermore, a chemiluminescent PARP assay showed no difference in maximal PARP-1 activity between WT and Atm−/− extracted PARP-1 protein (Fig. S6J). Thus, NAD+ repletion decreased accumulation of endogenous DNA damage in ATM- KD neurons likely through increased DNA repair via NHEJ.
Encouraged by the healthspan improvements in mice (Fig. 7), we further investigated the effects of NAD+ on the lifespan of the short-lived Atm−/− mice. Both WT and Atm−/− mice were given NR (12 mM) in drinking water at one month of age and continuously throughout their lifespans. NR treatment markedly extended the lifespan of Atm−/− mice (Fig. 7G). For the Atm−/− vehicle group, approximately 50% of the mice died within 3.5 months, and all had passed by 5 months (102 ± 30.5 days in mean ± S.D.), consistent with previous reports (Lavin, 2013; Li et al., 2012). Strikingly, nearly 80% of the NR-fed Atm−/− mice survived over 10 months, indicating a dramatic improvement in lifespan by NAD+ supplementation. Extension of lifespan in Atm−/− mice by NAD+ supplementation may be associated with improved mitophagy and DNA repair but also with the anticancer potential of NAD+ or sirtuins (Bieganowski and Brenner, 2004; Chalkiadaki and Guarente, 2015). Thymic lymphoblastic lymphomas are a major cause of death for Atm−/− mice (Barlow et al., 1996). Analysis of the thymus tissues indicated that Atm−/− (veh) tissues were heavier (0.125 g/each) than that of WT (veh) littermates (0.035 g/each) (Fig. S5E-F). NR was able to reverse the hyper proliferation of the thymus tissue; however, further analysis is ongoing to substantiate this observation. In summary, our results demonstrate that NR treatment normalizes MT function and reduces persistent DNA damage in brain tissue of Atm−/− mice.
DISCUSSION
This study links impaired deacetylation activity of SIRT1 to MT phenotypes of A-T, and presents mechanistic insight into how the augmentation of NAD+ levels can be linked to MT health and neuroprotection. We investigated this network through the use of a SIRT1 activator, a PARP inhibitor, and NAD+ precursors. These three interventions improved ATM-deficient phenotypes and suggested shared pathways. Combining microarray and proteomics, we identified principal mechanisms likely underlying A-T phenotypes that can be pharmacologically reversed. For example, proteomic data suggest that pharyngeal pumping was affected in atm-1 worms but not in N2. Behavioral studies verified that the pumping rate was decreased in atm-1 worms, and improved through activation of the NAD+/SIRT1 pathway. Our key observations suggest that depletion of NAD+ may be a major mechanism of neurodegeneration in A-T. Supplementation of NAD+ rescued the transcriptomic, proteomic, and behavioral phenotypes of atm-1 worms and Atm−/− mice. Mechanistically, NAD+ replenishment increased DCT-1-associated mitophagy and improved NHEJ DNA repair through activation of Ku70 and DNA-PKcs.
Our data suggest that impairment of multiple pathways contributes to the neurodegeneration of A-T. Although we cannot rule out the possibility that increased acetylation machinery in ATM deficient cells contributes to the total acetylation level of proteins, our in vitro and in vivo data show compromised SIRT1 deacetylation activity in A-T as evidenced by increased acetylation of its downstream proteins such as p53, PGC-1α, and Ku-70. Because cells with compromised mitophagy are susceptible to apoptotic death (Fang et al., 2016), it is likely that mitophagy reduction contributes to neuronal death leading to neurodegeneration in A-T. Our data suggest two possible mechanisms of defective mitophagy in A-T including the presence of longer/larger damaged mitochondria due to an imbalance of MT fission fusion, and reduced expression of proteins required for mitophagy. NAD+ precursors improved A-T phenotypes through improvement of MT quality and mitophagy via re-establishment of SIRT1 activity. Furthermore, NAD+ replenishment increased DNA repair in ATM-KD neurons. NAD+-dependent SIRT1 participates in DNA repair through deacetylation and/or activation of major DSB repair proteins, including ATM and Ku70 (Chalkiadaki and Guarente, 2015; Dobbin et al., 2013). In line with overlapping functions between ATM and DNA-PKcs (Falck et al., 2005; Shiloh and Ziv, 2013), we show that NAD+ supplementation can increase neuronal repair of DSBs through augmentation of the DNA-PKcs-regulated pathway. In addition to SIRT1, other NAD+-dependent sirtuin members including SIRT6 and SIRT3 also likely contribute to the neuroprotection and DNA repair improvements by NAD+ supplementation seen here. SIRT6 functions in stabilization of DNA-PKcs on chromatin and enhances NHEJ (Mao et al., 2011; McCord et al., 2009). SIRT3 is a major MT deacetylase and plays a significant role in maintaining neuronal survival under both endogenous and exogenous stresses and can be activated by NAD+ precursors (Canto et al., 2012; Cheng et al., 2016). We also observed induction of UPRmt after treatment with NAD+ precursors. Our data suggest inter-connected responses involving DNA damage/repair, SIRT1 dysfunction, compromised mitophagy and MT dysfunction in neurodegeneration of A-T. NAD+ replenishment works via a SIRT1-dependent mechanism, although there may also be SIRT1- independent mechanisms that improve lifespan and healthspan in A-T animal models.
NAD+ replenishment caused a remarkable extension of lifespan in the Atm−/− mice. In addition to improved DNA repair and maintenance of MT homeostasis, NAD+-induced lifespan extension in the Atm−/− mice may also be due to multiple other mechanisms including elimination of ROS, improvement of immunity, and inhibition of thymic lymphomas. Notably, NAD+ supplementation significantly improved healthspan and lifespan in atm-1 worms, an organism which has no tumor growth, implicating major roles for MT quality maintenance and DNA repair in the therapeutic effects of NAD+ across species.
In summary, our results suggest that NAD+ depletion can induce severe neurodegeneration. Boosting NAD+ ameliorates neuropathological defects and marked extends lifespan in an A-T mouse model. Our study further elucidates the molecular mechanisms involved in NAD+ regulation of mitophagy and enhancement of DNA repair in DNA repair deficiency. We describe how two classical hypotheses of aging converge to explain A-T symptoms, namely, MT dysfunction and persistent DNA damage in a cross species study. While it remains to be seen how well NAD+ supplementation translates to the clinical treatment of A-T patients, our findings suggest novel therapeutic strategies to combat this devastating disease, and possibly other premature aging disorders with DNA repair defects.
EXPERIMENTAL PROCEDURES
Primary neuronal culture
Cultures of cortical neurons were prepared from Sprague-Dawley rat embryos at 18 days of gestation. Dissociated cells were seeded into polyethyleneimine-coated plastic dishes or glass coverslips in MEM medium supplemented with 10% FBS at a density of 80,000 cells/cm2. After cells attached to the substrate, the medium was replaced with Neurobasal medium containing 5% B27, 1% Glutamax and 1% Anti-Anti (Gibco).
Detection of MT parameters
To detect these parameters, cell were incubated with different dyes, including TMRM to detect MT membrane potential, MitoTracker Green for MT content, dihydroethidium to detect cellular ROS, and mitoSOX for MT ROS, followed by FACS.
C. elegans studies
All the C. elegans studies, including lifespan and healthspan, were performed as detailed elsewhere (Fang et al., 2014; Scheibye-Knudsen et al., 2014). Metabolomics analysis on worms was performed by the UC Davis West Coast Metabolomics Center. Microarray analysis on worm tissues was performed at NIA microarray core facility according to standard procedures, while proteomics studies on worm tissues was carried out according to standard procedures as details in Supplemental Experimental Procedures.
Detection of mitophagy in cells and C. elegans
Several methods were used to detect mitophagy in primary neurons, SH-SY5Y cells and C. elegans. Electron microscopy was used to calculate the percent of mitochondria undergoing mitophagy by visualization of engulfed or partially engulfed mitochondria compared with the total mitochondria counted in that sample (method described above). Alternatively, colocalization of the autophagy marker LC3 and a mitochondrial marker COX-4 was also used quantify mitophagy (Fang et al., 2014). In worms, the mitophagy reporter strain N2;Ex(pmyo-3∷dsred∷lgg-1;pdct-1∷dct-1∷gfp) was crossed with atm-1(gk186). Worms were exposed to different compounds at L4 stage, followed by imaging of muscle cells at day 4. Worms were treated 24 h with 1 mM Paraquat (PQ) as a positive control (Palikaras et al., 2015). A total of 15~20 worms/group were imaged in two independent replicates. Colocalization coefficient between DSRED∷DCT1 and LGG1∷GFP were analyzed using the Zeiss LSM Image Examiner. Imaging of mt-mKeima cells (gift from Dr. Richard Youle) was performed as reported by Nuo and colleagues (Sun et al., 2015), using different settings for GFP (alkaline condition, excitation 458 nm and emission 615 nm) and RFP (acidic condition, excitation 561 nm and emission 615 nm).
NR and NMN supplementation on mice
All animal experiments were performed with the approval of the appropriate institutional animal care and use committee of National Institute on Aging. The Atm heterozygous strain (B6;129S4-Atmtm1Bal/J) was purchased from The Jacksons Laboratory. After weaning, Atm−/− mice and their age- and sex-matched littermates were given NR/NMN (12 mM) in their drinking water while the control groups were received only drinking water, followed by either behavioral (2 weeks treatments) or lifespan studies.
See Extended Experimental Procedures for detailed methods.
Statistical Analysis
Statistical analysis used in this study was two-tailed unpaired t-test for comparison between two groups, or ANOVA for comparison among multiple groups. All data were presented as mean ± S.D. or mean ± S.E.M. as indicated with p value < 0.05 was considered statistically significant. For lifespan studies, p values were derived from log-rank calculations.
Supplementary Material
Acknowledgments
We thank Boris M. Brenerman, Lynn Froetscher, and Dr. Yujun Hou for their help in the experiments. We appreciate Drs. Kevin Becker, Yongqing Zhang, William H. Wood III and Elin Lehrmann for their help in performing microarray and data analysis. We acknowledge Drs. Monica Driscoll, Johan Auwerx, David H. Hall, Coleen T. Murphy, Malene Hansen, Ann M. Rose, and Nektarios Tavernarakis for their expertise in the C. elegans studies. We thank Stale Nygard for statistical support and Bernd Thiede for access to the University of Oslo Mass Spectrometry Core facility. We thank Drs. Atsushi Miyawaki and Richard J. Youle for sharing mt-mKeima plasmid, mt-mKeima integrated Hela cells, and Drs. Nuo Sun, Toren Finkel for their expertise on mt-mKeima-related imaging. We thank Drs. Yie Liu and Beverly Baptiste for critical reading of the manuscript. This research was supported by the Intramural Research Program of the NIH (VAB), National Institute on Ageing, a 2014-2015 NIA intra laboratory grant (EFF, VAB), ChromaDex (VAB), a grant from the South East Norway Regional Health Authority grant no 2015029 (HN), the Norwegian Cancer Society grant no 4514636 (RCB), NIH/NIA grant 5R37AG028730-09 and support from the Glenn Medical Foundation (DAS).
Footnotes
Publisher's Disclaimer: This is a PDF file of an unedited manuscript that has been accepted for publication. As a service to our customers we are providing this early version of the manuscript. The manuscript will undergo copyediting, typesetting, and review of the resulting proof before it is published in its final citable form. Please note that during the production process errors may be discovered which could affect the content, and all legal disclaimers that apply to the journal pertain.
ACCESSION NUMBERS
The microarray GEO accession number for the C. elegans data reported in this paper is GSE76380. The proteomics data of C. elegans were submitted to ProteomeXchange with project accession number PXD003380.
SUPPLEMENTAL INFORMATION
Supplemental information includes Supplemental Experimental Procedures, six supplementary figures, and five supplementary tables and can be found with this article online.
AUTHOR CONTRIBUTIONS
E.F.F. and V.A.B. conceived experiments. E.F.F., H.K., K.M., H.L., R.A.S., S.K., R.C.B., M.A.W., W.B.I., B.N.W., M.M., J.L., J.S.K., Q.L., T.B.W., J.T., performed experiments and analyzed data. D.L.C., D.A.S., M.P.M. and H.N. provided expertise and feedback. E.F.F., D.L.C. and V.A.B. wrote the manuscript.
Competing interests statement
The Bohr laboratory has CRADA arrangements with ChromaDex and GlaxoSmithKline. DAS is a consultant for GSK, Ovascience and Metrobiotech.
References
- Bakkenist CJ, Kastan MB. DNA damage activates ATM through intermolecular autophosphorylation and dimer dissociation. Nature. 2003;421:499–506. doi: 10.1038/nature01368. [DOI] [PubMed] [Google Scholar]
- Barlow C, Hirotsune S, Paylor R, Liyanage M, Eckhaus M, Collins F, Shiloh Y, Crawley JN, Ried T, Tagle D, et al. Atm-deficient mice: a paradigm of ataxia telangiectasia. Cell. 1996;86:159–171. doi: 10.1016/s0092-8674(00)80086-0. [DOI] [PubMed] [Google Scholar]
- Berdichevsky A, Viswanathan M, Horvitz HR, Guarente L. C. elegans SIR-2.1 interacts with 14-3-3 proteins to activate DAF-16 and extend life span. Cell. 2006;125:1165–1177. doi: 10.1016/j.cell.2006.04.036. [DOI] [PubMed] [Google Scholar]
- Bieganowski P, Brenner C. Discoveries of nicotinamide riboside as a nutrient and conserved NRK genes establish a Preiss- Handler independent route to NAD+ in fungi and humans. Cell. 2004;117:495–502. doi: 10.1016/s0092-8674(04)00416-7. [DOI] [PubMed] [Google Scholar]
- Canto C, Houtkooper RH, Pirinen E, Youn DY, Oosterveer MH, Cen Y, Fernandez-Marcos PJ, Yamamoto H, Andreux PA, Cettour-Rose P, et al. The NAD(+) precursor nicotinamide riboside enhances oxidative metabolism and protects against high-fat diet-induced obesity. Cell metabolism. 2012;15:838–847. doi: 10.1016/j.cmet.2012.04.022. [DOI] [PMC free article] [PubMed] [Google Scholar]
- Canto C, Menzies KJ, Auwerx J. NAD(+) Metabolism and the Control of Energy Homeostasis: A Balancing Act between Mitochondria and the Nucleus. Cell metabolism. 2015;22:31–53. doi: 10.1016/j.cmet.2015.05.023. [DOI] [PMC free article] [PubMed] [Google Scholar]
- Chalkiadaki A, Guarente L. The multifaceted functions of sirtuins in cancer. Nature reviews Cancer. 2015 doi: 10.1038/nrc3985. [DOI] [PubMed] [Google Scholar]
- Chen BP, Chan DW, Kobayashi J, Burma S, Asaithamby A, Morotomi-Yano K, Botvinick E, Qin J, Chen DJ. Cell cycle dependence of DNA-dependent protein kinase phosphorylation in response to DNA double strand breaks. The Journal of biological chemistry. 2005;280:14709–14715. doi: 10.1074/jbc.M408827200. [DOI] [PubMed] [Google Scholar]
- Cheng A, Yang Y, Zhou Y, Maharana C, Lu D, Peng W, Liu Y, Wan R, Marosi K, Misiak M, et al. Mitochondrial SIRT3 Mediates Adaptive Responses of Neurons to Exercise and Metabolic and Excitatory Challenges. Cell metabolism. 2016;23:128–142. doi: 10.1016/j.cmet.2015.10.013. [DOI] [PMC free article] [PubMed] [Google Scholar]
- Cohen HY, Lavu S, Bitterman KJ, Hekking B, Imahiyerobo TA, Miller C, Frye R, Ploegh H, Kessler BM, Sinclair DA. Acetylation of the C terminus of Ku70 by CBP and PCAF controls Bax-mediated apoptosis. Molecular cell. 2004a;13:627–638. doi: 10.1016/s1097-2765(04)00094-2. [DOI] [PubMed] [Google Scholar]
- Cohen HY, Miller C, Bitterman KJ, Wall NR, Hekking B, Kessler B, Howitz KT, Gorospe M, de Cabo R, Sinclair DA. Calorie restriction promotes mammalian cell survival by inducing the SIRT1 deacetylase. Science. 2004b;305:390–392. doi: 10.1126/science.1099196. [DOI] [PubMed] [Google Scholar]
- Dobbin MM, Madabhushi R, Pan L, Chen Y, Kim D, Gao J, Ahanonu B, Pao PC, Qiu Y, Zhao Y, et al. SIRT1 collaborates with ATM and HDAC1 to maintain genomic stability in neurons. Nature neuroscience. 2013;16:1008–1015. doi: 10.1038/nn.3460. [DOI] [PMC free article] [PubMed] [Google Scholar]
- Falck J, Coates J, Jackson SP. Conserved modes of recruitment of ATM, ATR and DNA-PKcs to sites of DNA damage. Nature. 2005;434:605–611. doi: 10.1038/nature03442. [DOI] [PubMed] [Google Scholar]
- Fang EF, Scheibye-Knudsen M, Brace LE, Kassahun H, SenGupta T, Nilsen H, Mitchell JR, Croteau DL, Bohr VA. Defective mitophagy in XpA via parp-1 hyperactivation and NAD(+)/SIRT1 reduction. Cell. 2014;157:882–896. doi: 10.1016/j.cell.2014.03.026. [DOI] [PMC free article] [PubMed] [Google Scholar]
- Fang EF, Scheibye-Knudsen M, Chua KF, Mattson MP, Croteau DL, Bohr VA. Nuclear DNA damage signalling to mitochondria in ageing. Nature reviews Molecular cell biology. 2016;17:308–321. doi: 10.1038/nrm.2016.14. [DOI] [PMC free article] [PubMed] [Google Scholar]
- Gao J, Wang WY, Mao YW, Graff J, Guan JS, Pan L, Mak G, Kim D, Su SC, Tsai LH. A novel pathway regulates memory and plasticity via SlRT1 and miR-134. Nature. 2010;466:1105–1109. doi: 10.1038/nature09271. [DOI] [PMC free article] [PubMed] [Google Scholar]
- Guo Z, Kozlov S, Lavin MF, Person MD, Paull TT. ATM activation by oxidative stress. Science. 2010;330:517–521. doi: 10.1126/science.1192912. [DOI] [PubMed] [Google Scholar]
- Hubbard BP, Gomes AP, Dai H, Li J, Case AW, Considine T, Riera TV, Lee JE, E SY, Lamming DW, et al. Evidence for a common mechanism of SIRT1 regulation by allosteric activators. Science. 2013;339:1216–1219. doi: 10.1126/science.1231097. [DOI] [PMC free article] [PubMed] [Google Scholar]
- Igarashi M, Guarente L. mTORC1 and SIRT1 Cooperate to Foster Expansion of Gut Adult Stem Cells during Calorie Restriction. Cell. 2016;166:436–450. doi: 10.1016/j.cell.2016.05.044. [DOI] [PubMed] [Google Scholar]
- Ito K, Hirao A, Arai F, Matsuoka S, Takubo K, Hamaguchi I, Nomiyama K, Hosokawa K, Sakurada K, Nakagata N, et al. Regulation of oxidative stress by ATM is required for self-renewal of haematopoietic stem cells. Nature. 2004;431:997–1002. doi: 10.1038/nature02989. [DOI] [PubMed] [Google Scholar]
- Jones MR, Huang JC, Chua SY, Baillie DL, Rose AM. The atm-1 gene is required for genome stability in Caenorhabditis elegans. Molecular genetics and genomics : MGG. 2012;287:325–335. doi: 10.1007/s00438-012-0681-0. [DOI] [PMC free article] [PubMed] [Google Scholar]
- Kauffman AL, Ashraf JM, Corces-Zimmerman MR, Landis JN, Murphy CT. Insulin signaling and dietary restriction differentially influence the decline of learning and memory with age. PLoS biology. 2010;8:e1000372. doi: 10.1371/journal.pbio.1000372. [DOI] [PMC free article] [PubMed] [Google Scholar]
- Kenyon CJ. The genetics of ageing. Nature. 2010;464:504–512. doi: 10.1038/nature08980. [DOI] [PubMed] [Google Scholar]
- Lagouge M, Argmann C, Gerhart-Hines Z, Meziane H, Lerin C, Daussin F, Messadeq N, Milne J, Lambert P, Elliott P, et al. Resveratrol improves mitochondrial function and protects against metabolic disease by activating SIRT1 and PGC-1alpha. Cell. 2006;127:1109–1122. doi: 10.1016/j.cell.2006.11.013. [DOI] [PubMed] [Google Scholar]
- Lavin MF. The appropriateness of the mouse model for ataxia-telangiectasia: neurological defects but no neurodegeneration. DNA repair. 2013;12:612–619. doi: 10.1016/j.dnarep.2013.04.014. [DOI] [PubMed] [Google Scholar]
- Lavin MF, Gueven N, Bottle S, Gatti RA. Current and potential therapeutic strategies for the treatment of ataxia- telangiectasia. British medical bulletin. 2007;81-82:129–147. doi: 10.1093/bmb/ldm012. [DOI] [PubMed] [Google Scholar]
- Lemmens BB, Tijsterman M. DNA double-strand break repair in Caenorhabditis elegans. Chromosoma. 2011;120:1–21. doi: 10.1007/s00412-010-0296-3. [DOI] [PMC free article] [PubMed] [Google Scholar]
- Li J, Chen J, Ricupero CL, Hart RP, Schwartz MS, Kusnecov A, Herrup K. Nuclear accumulation of HDAC4 in ATM deficiency promotes neurodegeneration in ataxia telangiectasia. Nature medicine. 2012;18:783–790. doi: 10.1038/nm.2709. [DOI] [PMC free article] [PubMed] [Google Scholar]
- Mair W, Morantte I, Rodrigues AP, Manning G, Montminy M, Shaw RJ, Dillin A. Lifespan extension induced by AMPK and calcineurin is mediated by CRTC-1 and creb. Nature. 2011;470:404–408. doi: 10.1038/nature09706. [DOI] [PMC free article] [PubMed] [Google Scholar]
- Mao Z, Hine C, Tian X, Van Meter M, Au M, Vaidya A, Seluanov A, Gorbunova V. SIRT6 promotes DNA repair under stress by activating PARP1. Science. 2011;332:1443–1446. doi: 10.1126/science.1202723. [DOI] [PMC free article] [PubMed] [Google Scholar]
- Mateo J, Carreira S, Sandhu S, Miranda S, Mossop H, Perez-Lopez R, Nava Rodrigues D, Robinson D, Omlin A, Tunariu N, et al. DNA-Repair Defects and Olaparib in Metastatic Prostate Cancer. The New England journal of medicine. 2015;373:1697–1708. doi: 10.1056/NEJMoa1506859. [DOI] [PMC free article] [PubMed] [Google Scholar]
- McCord RA, Michishita E, Hong T, Berber E, Boxer LD, Kusumoto R, Guan S, Shi X, Gozani O, Burlingame AL, et al. SIRT6 stabilizes DNA-dependent protein kinase at chromatin for DNA double-strand break repair. Aging. 2009;1:109–121. doi: 10.18632/aging.100011. [DOI] [PMC free article] [PubMed] [Google Scholar]
- McKinnon PJ. Maintaining genome stability in the nervous system. Nature neuroscience. 2013;16:1523–1529. doi: 10.1038/nn.3537. [DOI] [PMC free article] [PubMed] [Google Scholar]
- Menzies FM, Fleming A, Rubinsztein DC. Compromised autophagy and neurodegenerative diseases. Nature reviews Neuroscience. 2015;16:345–357. doi: 10.1038/nrn3961. [DOI] [PubMed] [Google Scholar]
- Mouchiroud L, Houtkooper RH, Moullan N, Katsyuba E, Ryu D, Canto C, Mottis A, Jo YS, Viswanathan M, Schoonjans K, et al. The NAD(+)/Sirtuin Pathway Modulates Longevity through Activation of Mitochondrial UPR and FOXO Signaling. Cell. 2013;154:430–441. doi: 10.1016/j.cell.2013.06.016. [DOI] [PMC free article] [PubMed] [Google Scholar]
- Muraki K, Han L, Miller D, Murnane JP. The role of ATM in the deficiency in nonhomologous end-joining near telomeres in a human cancer cell line. PLoS genetics. 2013;9:e1003386. doi: 10.1371/journal.pgen.1003386. [DOI] [PMC free article] [PubMed] [Google Scholar]
- Palikaras K, Lionaki E, Tavernarakis N. Coordination of mitophagy and mitochondrial biogenesis during ageing in C. elegans. Nature. 2015;521:525–528. doi: 10.1038/nature14300. [DOI] [PubMed] [Google Scholar]
- Paull TT. Mechanisms of ATM Activation. Annual review of biochemistry. 2015;84:711–738. doi: 10.1146/annurev-biochem-060614-034335. [DOI] [PubMed] [Google Scholar]
- Scheibye-Knudsen M, Mitchell SJ, Fang EF, Lyama T, Ward TM, Wang J, Dunn CA, Singh N, Veith S, Hasan MM, et al. A High Fat Diet and NAD+ Rescue Premature Aging in Cockayne Syndrome. Cell metabolism. 2014;20:840–855. doi: 10.1016/j.cmet.2014.10.005. [DOI] [PMC free article] [PubMed] [Google Scholar]
- Scheibye-Knudsen M, Scheibye-Alsing K, Canugovi C, Croteau DL, Bohr VA. A novel diagnostic tool reveals mitochondrial pathology in human diseases and aging. Aging. 2013;5:192–208. doi: 10.18632/aging.100546. [DOI] [PMC free article] [PubMed] [Google Scholar]
- Shiloh Y, Ziv Y. The ATM protein kinase: regulating the cellular response to genotoxic stress, and more. Nature reviews Molecular cell biology. 2013;14:197–210. [PubMed] [Google Scholar]
- Stern N, Hochman A, Zemach N, Weizman N, Hammel I, Shiloh Y, Rotman G, Barzilai A. Accumulation of DNA damage and reduced levels of nicotine adenine dinucleotide in the brains of Atm-deficient mice. The Journal of biological chemistry. 2002;277:602–608. doi: 10.1074/jbc.M106798200. [DOI] [PubMed] [Google Scholar]
- Sun N, Yun J, Liu J, Malide D, Liu C, Rovira II, Holmstrom KM, Fergusson MM, Yoo YH, Combs CA, et al. Measuring In Vivo Mitophagy. Molecular cell. 2015;60:685–696. doi: 10.1016/j.molcel.2015.10.009. [DOI] [PMC free article] [PubMed] [Google Scholar]
- Valentin-Vega YA, Maclean KH, Tait-Mulder J, Milasta S, Steeves M, Dorsey FC, Cleveland JL, Green DR, Kastan MB. Mitochondrial dysfunction in ataxia-telangiectasia. Blood. 2012;119:1490–1500. doi: 10.1182/blood-2011-08-373639. [DOI] [PMC free article] [PubMed] [Google Scholar]
- Verdin E. NAD(+) in aging, metabolism, and neurodegeneration. Science. 2015a;350:1208–1213. doi: 10.1126/science.aac4854. [DOI] [PubMed] [Google Scholar]
- Verdin E. NAD+ in aging, metabolism, and neurodegeneration. Science In press. 2015b doi: 10.1126/science.aac4854. [DOI] [PubMed] [Google Scholar]
- Zhang H, Ryu D, Wu Y, Gariani K, Wang X, Luan P, D’Amico D, Ropelle ER, Lutolf MP, Aebersold R, et al. NAD+ repletion improves mitochondrial and stem cell function and enhances life span in mice. Science. 2016 doi: 10.1126/science.aaf2693. [DOI] [PubMed] [Google Scholar]
Associated Data
This section collects any data citations, data availability statements, or supplementary materials included in this article.