

Abstract
Objectives
Morphological integration, or the tendency for covariation, is commonly seen in complex traits such as the human face. The effects of growth on shape, or allometry, represent a ubiquitous but poorly understood axis of integration. We address the question of to what extent age and measures of size converge on a single pattern of allometry for human facial shape.
Methods
Our study is based on two large cross-sectional cohorts of children, one from Tanzania and the other from the USA (N=7173). We employ 3D facial imaging and geometric morphometrics to relate facial shape to age and anthropometric measures.
Results
The two populations differ significantly in facial shape, but the magnitude of this difference is small relative to the variation within each group. Allometric variation for facial shape is similar in both populations, representing a small but significant proportion of total variation in facial shape. Different measures of size are associated with overlapping but statistically distinct aspects of shape variation. Only half of the size-related variation in facial shape can be explained by the first principal component of four size measures and age while the remainder associates distinctly with individual measures.
Conclusions
Allometric variation in the human face is complex and should not be regarded as a singular effect. This finding has important implications for how size is treated in studies of human facial shape and for the developmental basis for allometric variation more generally.
Keywords: Allometry, 3D facial imaging, morphometrics, face shape, growth, human
Introduction
Most morphological structures are integrated (Olson and Miller, 1958), meaning that they tend to covary, driven by variation in developmental processes (Hallgrimsson et al., 2009). This is the case for the face and craniofacial complex in humans and other vertebrates (Bastir, 2008; Porto et al., 2009). Variation in the growth of the chondrocranium (Bastir and Rosas, 2006; Bastir et al., 2006; Hallgrimsson et al., 2006; Parsons et al., 2015) or the brain (Lieberman et al., 2008; Marcucio et al., 2011; Parsons et al., 2011) are major developmental determinants of covariation patterns for craniofacial morphology. Somatic growth is likely to be another such determinant, because morphology tends to be related to size. For most anatomical structures, shapes and proportions have a regular relationship to size (Jolicoeur, 1963). Taller people tend to have longer, more prognathic faces (Baume et al., 1983; Mitteroecker et al., 2013). The specific relationship between shape and size is termed “allometry” (Klingenberg, 2016; Klingenberg and Zimmermann, 1992). Many genetic and environmental influences affect growth as well as other aspects of facial development. To disentangle the correlated effects of size from other more specific effects, it is necessary to understand the role of allometric variation.
Allometry is typically divided into ontogenetic versus static components. Ontogenetic allometry is the shape variation that correlates with age or developmental stage. Static allometry is the shape variation that correlates with size, controlling for age or stage (German and Meyers, 1989). Allometry is a special case of morphological integration (Magwene and Westneat, 2001), which refers to the tendency for structures to covary because developmental processes tend to affect multiple traits (Hallgrimsson et al., 2009). For allometric variation, the process assumed to produce these correlated effects is growth.
A challenge to the study of allometry is that there are often multiple ways to quantify both growth and size for most anatomical structures. Ontogenetic allometry is complicated when developmental time and stage or rate become dissociated. This can occur when mutations affect developmental rate in addition to other phenotypic effects (Gonzalez et al., 2013; Wang and Diewert, 1992). Further, the biological meaning of size is often unclear. An assumption made in many morphometric analyses is that the appropriate measure of size is the size of the anatomical structure analyzed, usually quantified as the centroid size of a landmark configuration (Klingenberg and Marugan-Lobon, 2013). But centroid size is a very different biological measure when quantifying an entire organism, such as a trilobite fossil (Webster and Zelditch, 2005), versus a human skull (Martinez-Abadias et al., 2012) or an individual tooth (Polychronis et al., 2013). Yet, many studies treat the shape correlates of centroid size in these different contexts as if they reflect the same kind of biological variation. For the human face, is the appropriate measure the length, width, or area of the face, head circumference, or some measure of body size? To answer this question, we must understand how various measures of growth and age relate to shape variation for the structure of interest. If allometric variation reflects the shape consequences of variation in a single underlying growth parameter, then the shape correlates of different size measures should converge on a single covariation pattern. If this is not the case, then we cannot assume that allometric variation quantified based on different measures of size are capturing homologous biological variation.
Here, we address the relationship between various measures of size and age to facial shape in two previously-described cross-sectional cohorts of children, one comprised of Bantu speaking groups in northwest Tanzania (Cole et al., 2016) and the other comprised of Americans of predominantly European ancestry (Shaffer et al., 2016). We compare the shape correlates of age, two measures of somatic size (stature and body mass), and two local measures of head size (face size and head circumference). These measures are selected to capture disparate growth-related effects. Age represents ontogenetic effects. Stature reflects longitudinal growth while body mass captures overall somatic growth. Face size is related to local growth of the face while head circumference is influenced by overall head and brain size. Brain growth is known to influence craniofacial shape (Aldridge et al., 2005; Hill et al., 2013; Marcucio et al., 2015; Marcucio et al., 2011).
Materials and Methods
Sample Collection
The cohort of 5961 Tanzanian children of self-identified Bantu origin (3342 female, 2619 male) has been described in detail previously (Cole et al., 2016; Cole et al., 2017). Subject ages were 3 to 23 years (mean 10.8 ± 2.8 years; females, 10.7 ± 2.7 years; males, 10.9 ± 2.8 years). All participants were examined by a physician (M.M.) to exclude subjects with any birth defects, history of facial surgery or interventionist orthodontic treatment, or first-degree relatives with craniofacial abnormalities.
The cohort of 1212 North American children (609 female, 603 male) has also been described in detail previously (Shaffer et al. 2016). In this sample, we included only children who self-identified as “white” using the NIH “racial and ethnic categories” for recruitment and consenting of research subjects (https://grants.nih.gov/grants/guide/notice-files/NOT-OD-15-089.html). European ancestry was confirmed from genomic data (Shaffer et al., 2016). Ages were 3 to 18 years (mean 9.0 ± 4.1 years; females, 9.2 ± 4.2 years; males, 8.9 ± 3.9 years). Participants in the North American sample were screened using exclusion criteria similar to the Tanzanian cohort.
The full set of anthropometric measurements of height, weight, and head circumference were obtained for a subsample of 4239 Tanzanian subjects., taking the average of two sequential measurements. Height was measured in centimeters using a standard stadiometer; body weight was measured in kilograms using a digital body weight scale. Head circumference was measured in centimeters using a standard ribbon measuring tape, with the measuring tape placed approximately two centimeters above the supraorbital ridge. The same anthropometric measurements were obtained for roughly half of the North American subjects from Denver and San Francisco (N=343) while head circumference was not obtained for the Pittsburgh subjects (N=506). Only the sample for which all anthropometric measures were available was included in the analyses of allometry (N=4582, F=2525, M=2057).
Ethical approval was granted by the Tanzania National Institute for Medical Research (NIMR/HQ/R.8a/Vol.IX/845), and the University of Calgary (CHREB 21741), the University of Colorado (09-0731) and the University of Pittsburgh (#PRO09060553 and #RB0405013). Informed written consent was obtained from the parents and guardians of all participants, prior to participation in the study.
Neither cohort is assumed to be representative of any biologically definable racial or ethnic category, nor do we assume that such categories exist in a biological sense (Edgar and Hunley, 2009; Hunley et al., 2009). Rather, these cohorts sample two populations in which within-sample heterogeneity due to ancestry has been minimized to some degree.
Three-dimensional Imaging and automated 3D Landmarking
3D facial surface images were captured and processed as described previously (Cole et al., 2016; Shaffer et al., 2016). Analysis of facial shape and size were based on 29 landmarks that were obtained using a novel automated landmarking method (Figure 1, Table 1 (Li et al., 2017). In this method, a set of 17 control points are automatically detected from learned features of the face surface maps. These points are then used to register each face to a template, after which the face is warped to the template using a thin-plate spline based algorithm. The learning step is used only to improve the automated identification of the 17 control points which are used to anchor the registration of each individual image to the template. Once the full dataset is registered to the template, the program transfers 29 landmarks are then transferred to each face and their positions calculated from the transformation matrix used to warp each face to the template.
Figure 1.
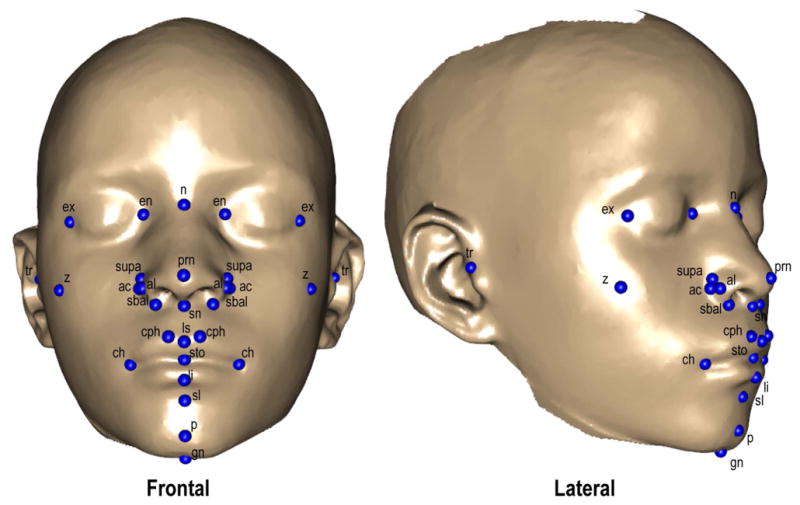
Anatomical Landmarks. 29 landmarks as placed on the 3-D facial photo scans. Corresponds to anatomical descriptions in Table 1.
Table 1. Anatomical Landmarks.
Anatomical descriptions and variable names of 29 landmarks used in the study. As referenced from http://www.facebase.org. Corresponds to Figure 1.
| 3D Landmark Name | Abbreviation | Definition |
|---|---|---|
| Nasion | n | Midline point in where the frontal and nasal bones contact (nasofrontal suture). Corresponds to the underlying bony landmark. |
| Pronasale | prn | Midline point marking the maximum protrusion of the nasal tip. |
| Subnasale | sn | Midline point marking the junction between the inferior border of the nasal septum and the cutaneous upper lip. It is the apex of the nasolabial angle. |
| Labiale Superius | ls | Midline point of the vermilion border of the upper lip, at the base of the philtrum. |
| Stomion | sto | Midpoint of the labial fissure. |
| Labiale Inferius | li | Midline point of the vermilion border of the lower lip. |
| Sublabiale | sl | Midpoint along the inferior margin of the cutaneous lower lip (labiomental sulcus). |
| Gnathion | gn | Midline point on the inferior border of the mandible. Corresponds to the underlying bony landmark. |
| Endocanthion (Right) | en_r | Apex of the angle formed at the inner corner of the palpebral fissure where the upper and lower eyelids meet. |
| Endocanthion (Left) | en_l | Same as above |
| Exocanthion (Right) | ex_r | Apex of the angle formed at the outer corner of the palpebral fissure where the upper and lower eyelids meet. |
| Exocanthion (Left) | ex_l | Same as above |
| Alare (Right) | al_r | Most lateral point on the nasal ala. |
| Alare (Left) | al_l | Same as above |
| Alar Curvature Point (Right) | ac_r | Most posterolateral point on the alar cartilage, located within the crease formed by the union of the alar cartilage and the skin of the cheek. |
| Alar Curvature Point (Left) | ac_l | Same as above |
| Subalare (Right) | sbal_r | Point located at the lower margin of the nasal ala, where the cartilage insterts in the cutaneous upper lip. |
| Subalare (Left) | sbal_l | Same as above |
| Crista Philtri (Right) | cph_r | Point marking the lateral crest of the philtrum at the vermilion border of the upper lip |
| Crista Philtri (Left) | cph_l | Same as above |
| Chelion (Right) | ch_r | Point marking the lateral extent of the labial fissure. |
| Chelion (Left) | ch_l | Same as above |
| Tragion (Right) | t_r | Point marking the notch at the superior margin of the tragus, where the cartialge meets the skin of the face. |
| Tragion (Left) | t_l | Same as above |
| Superior Alar Groove(Right) | supa_r | Most superior portion of alar groove. |
| Superior Alar Groove (Left) | supa_l | Same as above |
| Zygion (Right) | z_r | Most prominent portion of zygomatic arch |
| Zygion (Left) | Z_l | Same as above |
| Pogonion | P | Most prominent portion of chin, anatomical pogonion. |
The template was created from a set of 50 images of Tanzanian children that had been manually landmarked (Li et al., 2017). The sample size for the template generation, while somewhat arbitrary, is intended to ensure that the 29 landmarks are placed accurately on the template and that morphology of the template falls close to the mean of the sample to be landmarked. Importantly, the template does not have to be exactly at the mean. It is only when an individual surface is very different from the template, that automated landmarking results in a bias towards the landmark positions of the template (Li et al., 2017). This effect is only detectable for individuals that fall far (>3SD) from the mean.
We used a single template for the combined dataset. Using separate templates for the two populations would create an artifactual difference between them. Since the landmark positions on the template determine the point at which the landmarks are transferred from the template to each individual, any difference in landmark position between the two templates would translate into an artifact. The use of a single template in this case is justifiable because the shape variation of the two samples overlaps extensively. We corrected for superficial artifacts due to smiling, squinting and open mouth using canonical variates analysis. This results in a continuous correction for these effects as described and validated in Cole et al. (2016). Further, we corrected for small differences between cameras. White light photogrammetry was performed using two models of Creaform cameras (Megacapturor and Gemini). These effects and the methods used to validate these corrections are described in supplementary data in Cole et al. (2016).
Morphometric Analysis
We performed geometric morphometric analyses using R (R Development Core Team, 2014) and MorphoJ v1.04a (Klingenberg, 2011). Landmarks were subjected to Procrustes Superimposition to rescale to unit centroid size, translate to standard position, and rotate to standard orientation (Rohlf, 1999). For all analyses described here, the groups included in each separate analysis are subjected to the same Procrustes superimposition.
To estimate the relative proportions of shape variation attributable to size and growth measures and their interactions within each cohort, we used a linear model built in R (R Development Core Team, 2014) with the Geomorph R package, version 3.0.3 (Adams and Otarola-Castillo, 2013). We used Geomorph’s procD.lm function to perform Procrustes ANOVA with permutation procedures, to assess shape variation and patterns of co-variation, and we thereby built a statistical model to quantify the relative amount of facial shape variation attributable to age, centroid size, height, weight, head circumference, sex, and the interactions between these variables. Since procD.lm uses Type 1 sums-of-squares, we alternated the position of the last variable in sequential regressions to accurately estimate percentage variance attributable to each variable. To visualize the shape effects of age, centroid size, height, weight, head circumference and sex, regression scores were computed for the model using the RegScore function from the R Morpho package, version 2.4.1.1 (Schlager, 2017). Separate Procrustes fits were performed for each population for the within-population analyses only. All analyses of the combined data involved a single, combined Procrustes fit.
To describe variation in facial shape independent of size and age in both populations, we regressed out the main and interaction effects for the size and age measures on the combined dataset, and re-centered the resulting residuals on each population mean. We then used principal components analysis to describe this variation. Thin-plate-spline warps were constructed using Landmark software (Wiley et al., 2005) for the first five principal component (PC) axes. The face morphs were based on a template that was created from a random sample of 50 individuals varying in age and sex (Li et al., 2017). This template was then morphed to the overall sample mean and the resulting face was used to visualize the variation in the sample. Heat maps to visualize the areas of greatest shape differences were constructed using the meshdist function in the Morpho package for R (Schlager, 2017). Separate principal component analyses (PCA) were performed for the Tanzanian and North American samples.
We also tested the effects of random error in the age values in the Tanzanian data on our estimates of allometric variation in face shape. To do this, we applied three models to the North American data, for which exact ages are available. The first uses the exact age, the second averages to the nearest whole year and the third to the closest 3-year interval.
Before combining the Tanzanian and North American cohorts for further analysis, we first determined the variation due to sex and population using a multiple analysis of variance model for these factors and their interactions in the combined sample. This was implemented in the Geomorph package for R (Adams et al., 2014; Collyer et al., 2015). We then removed ethnic group and sex from the analysis by centering the residuals from this model on the sample grand mean. We quantified and visualized the shape variation associated with each size measure and age using multiple linear regression implemented in Geomorph. Morphs and heatmaps were created in R using the Morpho package (Schlager, 2017).
Facial shape is likely to relate nonlinearly to measures of age and size. To determine whether the departures from linearity are sufficiently large to invalidate a linear regression approach, we compared regressions with up to five polynomial terms for all variables.
In the combined Tanzanian and North American cohorts, we tested whether measures of size and age were associated with distinct effects on face shape. We took two approaches to this question. The first compares the conditional variation for each size/age variable. Here, we created a dataset in which the shape effects of all size variables and age including their interactions were removed using multiple linear regression. We then projected those data on to the regression for each size/age variable using the coefficients for each variable from their regression on the original data scaled to value of the independent variable for each individual. This creates separate datasets for the conditional variation for each variable. We then obtained the first PC of the 5 measures of size and age. Using a linear multiple model as implemented in the Geomorph ProcD.allometry function in R, we regressed the conditional variation datasets on the size/age PC1 and compared slopes and variance explained for each dataset. This analysis tests the extent to which each size/age variable is associated with similar magnitudes and directions of shape variation in the face.
In the second approach, we performed regressions of the sex and population corrected data on each variable separately. This approach uses the original data rather than the conditional variation datasets used in the first approach. We then obtained the vectors that correspond to these regressions from the regression coefficients and calculated the angles among them. To compare these vectors, we resampled the sex and population adjusted data with replacement and obtained the full set of vectors at each resampling iteration. This was implemented using AngleTest in the Morpho package for R (Schlager, 2017). This approach thus compared the specific shape variation associated with each independent variable. Although this method is also based on regression coefficients, it differs from the first approach in that it permutes the angles among vectors for each landmark and allows for an intuitive visualization of the angles.
These two analyses essentially converge on an assessment of collinearity or multicollinearity among the measures of age and size. If the variables are capturing the same latent biological variable, a straightforward application of a linear model will not disentangle their effects. Our strategy in these three methods is to quantify and compare the directions and magnitudes of the main effects associated with each variable by isolating them using a conditional variation approach. Complete collinearity would result in parallel results across the conditional variation datasets.
Finally, we asked to what extent the five measures converge on a single underlying allometry factor. To determine the proportion of variation in facial shape explained jointly by all five measures, we performed a PCA for age and the four measures of size. We then used the data corrected for sex and population and estimated the proportion of variation in facial shape explained by each size/age PC.
Results
Facial shape variation related to measures of size and age
To assess the relative proportion of facial shape variation attributable to the size/age variables (age, centroid size, height, weight, head circumference, sex) as well as the interactions among them, we applied a linear model to the Procrustes coordinate data for each population. Unbiased estimates of the variance as determined by randomizing the order of factors are shown in Table 2 for the Tanzanian Cohort. We found that age, centroid size, height, weight, head circumference and sex all had significant effects (p = 0.001 for all) on facial shape variation. Centroid size captured approximately 4.5% (r2 = 0.045) of the shape variation, while weight captured 1.2% (r2 = 0.012) and head circumference captured approximately 1% (r2 = 0.010). Height (r2 = 0.003) and age (r2 = 0.001) by this model explained < 1% of the total variation. Figure 2 shows visualization of the related facial shape variation. Similar patterns were observed in our North American cohort (Figure 3).
Table 2. Tanzanian Procrustes ANOVA Model.
Relative proportion of variation attributable to several allometric measures. Corresponds to Figure 3.
| Measurement | df | SS | MS | R2 | p |
|---|---|---|---|---|---|
| Weight | 1 | 0.115 | 0.191 | 0.0120 | 0.001 |
| Height | 1 | 0.187 | 0.187 | 0.0032 | 0.001 |
| Head Circumference | 1 | 0.092 | 0.092 | 0.0108 | 0.001 |
| Centroid Size | 1 | 0.439 | 0.439 | 0.0456 | 0.001 |
| Age | 1 | 0.169 | 0.169 | 0.0010 | 0.001 |
| Age * Centroid Size | 1 | 0.009 | 0.009 | 0.0009 | 0.001 |
| Head Circumference * Centroid Size | 1 | 0.006 | 0.006 | 0.0006 | 0.004 |
| Height * Weight | 1 | 0.015 | 0.015 | 0.0014 | 0.001 |
| Height * Age | 1 | 0.005 | 0.005 | 0.0005 | 0.008 |
| Head Circumference * Height | 1 | 0.002 | 0.002 | 0.0002 | NS |
| Height * Age | 1 | 0.005 | 0.005 | 0.0005 | 0.012 |
| Head Circumference * Height * Age | 1 | 0.003 | 0.003 | 0.0004 | NS |
|
| |||||
| Residuals | 4800 | 9.46 | 0.00 | ||
| Total | 4813 | 10.51 | |||
Figure 2.

Thin-plate spline warps of Tanzanian allometric variation. Thin-plate spline warps showing variation across age, centroid size (CS), head circumference (HC), height (HT), and weight (WT). Negative end of the axis of variation is displayed in the left column, while the positive is displayed on the right. Corresponds to Table 4.
Figure 3.
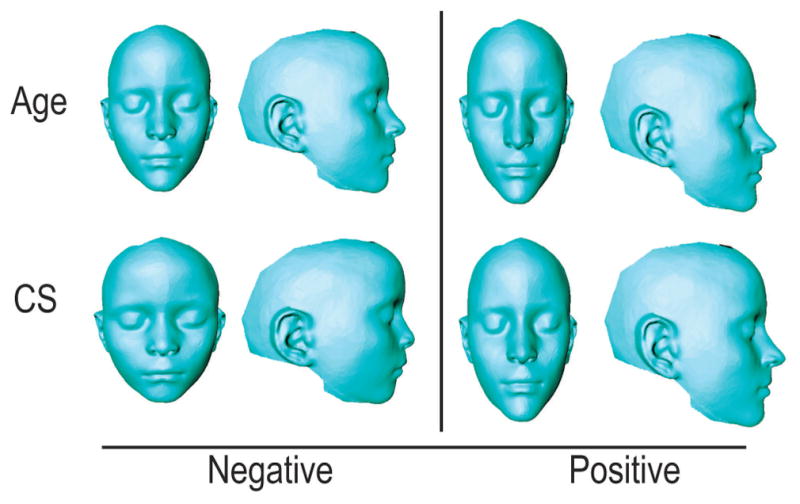
Thin-plate spline warps of allometric variation in European-derived North American children. Thin-plate spline warps showing variation across age, centroid size (CS). Negative end of the axis of variation is displayed in the left column, while the positive is displayed on the right.
Since the Tanzanian ages are self-reported, we determined the sensitivity of these result to random error in the age data by degrading the age values in the North American data to one, two and three year intervals. In the exact-age model, age explained less than 1% of the total variation (r2 = 0.01), while centroid size explained 3.9% (r2 = 0.039). These values did not change significantly when transforming the exact age to the nearest whole-year (r2 = 0.001) or the nearest 3-year interval (r2 = 0.0006). We assume that random error in age will have similar effects in the Tanzanian data.
Facial Shape Variation unrelated to size/age
Separate principal component analyses (PCA) of the size and age corrected Procrustes coordinates for both populations revealed that facial shape variation independent of size and ages measures is highly structured. In the Tanzanian cohort, along the PC1 axis (22.7% variance) individuals varied in relative upper facial height, overall facial width, nasal base width, and interorbital distance. Similar to PC1, PC2 (21.3% variance) described shape changes in total facial height and width, while also capturing the relative degree of maxillary prognathism. PC3 (14.7% variance) captured mandibular prognathism, upper facial depth, and midfacial length. In the North American cohort, along the PC1 axis (22.7%) subjects varied in facial height, facial width, philtrum height and chin protrusion. PC2 (18.9%) described variation in maxillary prognathism, chin protrusion and nasal projection. PC3 (16.5%) captured degree of retrognathia, nasal projection and interorbital distance. PC 1–10 Eigenvalue variances for both study populations are listed in Table 3. Figure 4 shows visualization of the shape changes associated with PCs 1–5 for both study populations, constructed via thin-plate-spline warps and Hausdorff distance color maps. In conjunction with Figure 4, Table 4 describes these shape changes. Shape visualization of PC axes 6–10 can be found in Supplementary Figure 1.
Table 3.
Eigenvalues and Variances for PC 1–10 for facial shape after removing variation related to age and size.
| Tanzanian | European-Derived North American | ||||||
|---|---|---|---|---|---|---|---|
| Principal Component | Eigenvalues | % Variance | Cumulative Variance | Principal Component | Eigenvalues | % Variance | Cumulative Variance |
| 1 | 0.00046 | 22.67 | 22.67 | 1 | 0.00051 | 22.74 | 22.74 |
| 2 | 0.00043 | 21.34 | 44.01 | 2 | 0.00041 | 18.89 | 40.83 |
| 3 | 0.00030 | 14.72 | 58.72 | 3 | 0.00037 | 16.51 | 57.34 |
| 4 | 0.00015 | 7.28 | 66.01 | 4 | 0.00018 | 8.09 | 65.43 |
| 5 | 0.00013 | 6.28 | 72.29 | 5 | 0.00012 | 5.52 | 70.95 |
| 6 | 0.00009 | 4.15 | 76.44 | 6 | 0.00009 | 3.91 | 74.86 |
| 7 | 0.00006 | 3.12 | 79.56 | 7 | 0.00008 | 3.57 | 78.43 |
| 8 | 0.00006 | 2.93 | 82.49 | 8 | 0.00007 | 3.21 | 81.63 |
| 9 | 0.00004 | 2.07 | 84.56 | 9 | 0.00004 | 1.92 | 83.55 |
| 10 | 0.00003 | 1.38 | 85.94 | 10 | 0.00004 | 1.81 | 85.36 |
Figure 4.

Thin-plate spline warps for PC 1–5 of Tanzanian and European-derived North American sample. Negative and positive PC scores represented. Color maps represent areas of greatest difference (red) and least difference (blue). Figure corresponds to Table 3.
Table 4. Anatomical Shape Changes.
Shape changes across principal component axes. Descriptions correspond to Figure 4. for facial shape after removing variation related to age and size
| Tanzanian | Caucasian | ||
|---|---|---|---|
| PC | Shape Change Across Principal Component Axis | PC | Shape Change Across Principal Component Axis |
| PC1 | Facial Height, Facial Width, Interorbital Distance | PC1 | Facial Height, Facial Width, Philtrum Height, Chin Protrusion |
| PC2 | Facial Height, Maxillary Prognathism, Facial Width | PC2 | Maxillary Prognathism, Chin Protrusion, Nasal Projection |
| PC3 | Facial Width, Upper Facial Depth | PC3 | Retrognathia, Nasal Projection, Interorbital Distance |
| PC4 | Facial Height, Maxillary Prognathism, Chin Protrusion | PC4 | Nasal Width, Philtrum Length, Maxillary Retrognathism |
| PC5 | Facial Height, Nasal Tip Projection, Width of Mouth | PC5 | Nasal Tip Projection, Nasal Width, Philtrum Length and Width |
| PC6 | Nasal Cavity Width, Maxillary Prognathism | PC6 | Facial Width, Facial Height, Zygomatic Projection |
| PC7 | Width of Mouth, Facial Prognathism | PC7 | Nasal Width, Width of Mouth, Zygomatic Projection |
| PC8 | Zygomatic Projection | PC8 | Facial Width, Zygomatic Projection, Interorbital Distance |
| PC9 | Maxillary Prognathism, Upper Facial Height, Nostril Width | PC9 | Width of Mouth, Nasal Width, Retrognathia |
| PC10 | Length of Chin, Nasion Positioning | PC10 | Maxillary Retrusion, Philtrum Width, Nasal Width |
Variation due to Sex and Population
To test for the effects associated with sex and population, we used the original Procrustes coordinate data (not the age and size corrected data) in which the two populations has been subjected to a single Procrustes superimposition. Multiple analyses of variance on the revealed significant effects for both sex and population. Both factors interact significantly with age (Table 5). Figure 5 shows 3D morphs and heatmaps corresponding to the sex and population differences in the sample. All effects and interactions are significant (Table 5). However, the magnitudes of these effects are fairly small compared to variation within each population. The difference between the two populations explains less than 4% of the total variation in the combined sample. The extensively overlapping variation in facial shape is evident in scatterplots of the first four PCs (Fig. 5B). Here, the ranges of variation overlap almost entirely with the most separation evident on PC4 which explains 6% of the combined sample variance.
Table 5.
Procrustes ANOVA with permutation for population, sex and age.
| Factor | Df | SS | MS | r2 | F | Z | Pr(>F) |
|---|---|---|---|---|---|---|---|
| Population | 1 | 0.41 | 0.41 | 0.037 | 183.99 | 30.94 | 0.001 |
| Sex | 1 | 0.08 | 0.08 | 0.007 | 36.07 | 21.82 | 0.001 |
| Population * Sex | 1 | 0.01 | 0.01 | 0.001 | 3.56 | 3.06 | 0.003 |
| Population * Age | 2 | 0.38 | 0.19 | 0.035 | 86.23 | 29.28 | 0.001 |
| Sex * Age | 1 | 0.01 | 0.01 | 0.001 | 5.25 | 4.69 | 0.001 |
| Residuals | 4575 | 10.11 | 0.00 | ||||
| Total | 4581 | 11.00 |
Figure 5.

Facial shape effects by population and sex. A shows the mean face shapes for the Tanzanian and North American samples and the differences between those means as a heatmap. C shows exaggerated morphs for Males and Females. These were calculated as 2.5x the Procrustes distance between the sexes after standardizing for age. D shows the regression of face shape on age by sex.
The interaction effects between population and age or population and the size measures, while statistically significant, explain very little variance compared to the main effects (Table 5). The variances explained by the interaction terms are an order of magnitude lower than the main effects. This shows that both the allometric trajectories and sexual dimorphism, while detectable in this large sample, are actually very similar in the two populations.
The interaction effect for age and sex, is significant but also quite small. The regression score plot (Fig. 5D) shows a reversal in this effect, likely reflecting somewhat altered ontogenetic trajectories between the sexes after puberty. The magnitude of this interaction effect, however, is small compared to the overall relationship between age and face shape.
Comparisons of the allometric trajectories associated with different measures of size and age in the combined sample
From the combined original Procrustes data, we first removed the effects of population, sex and the interaction between the two using Procrustes ANOVA and centered the resulting residuals on the average of the sex and population averages. Figure 6 shows 3D morphs and heatmaps that correspond to the regressions of each variable separately for the combined sample after removing the effects of sex and population. These morphs show that the shape effects associated with all factors except head circumference are fairly similar, with higher values associating with narrower, taller and more prognathic faces while lower values are associated with rounder and less prognathic faces.
Figure 6.

Three-dimensional morphs showing the facial shape variation that corresponds to each size measure and age (A). The morphs are scaled to 2 standard deviation departures from the mean in each direction. B shows heatmaps that correspond to these morphs.
There are significant but very small interaction effects for some size/age measures with population as determined by Procrustes MANOVA using procD.lm in Geomorph (Collyer et al., 2015). All explain less than 1% of the facial shape variance in the combined sample. The largest of these are between population and height (r2=0.0011, p<0.001) and population and weight (r2=0.0007, p=003). Although these results suggest slightly different allometric trajectories for these variables between the two populations, the magnitudes of these effects are very small.
To determine the influence of nonlinearity in the relationships of facial shape to the measures of size and age, we performed comparison of regressions with up to five polynomial terms. This revealed only small increases in the variance explained with the addition of polynomial terms. This suggests that while all variables potentially have nonlinear relationships to face shape, the vast majority of associated variance is captured using linear regression. More importantly, the relative magnitudes of the variances explained by the size variables and age is not altered by polynomial regression. As performing nonlinear regressions would substantially complicate the analysis and this would also risk overfitting the data, we performed all subsequent analyses based on linear models. Supplementary Figure 2 shows the change in variance explained by polynomial regressions for all variables.
We used two distinct methods to compare the shape effects of the five measures of size and age. In the first, we created a dataset in which the effects of all five factors and their interactions were removed. Then we projected these data on to the regressions for each factor individually and compared the resultant datasets. Figure 7A shows the regressions of these projected data onto the first PC of the five measures of size and age. These plots show common allometric component scores plotted against the common size-age axis. common allometric component scores (Mitteroecker et al., 2004) based on each conditional variation dataset plotted against the common size-age axis. This axis is estimated as PC1 of the size variables and age. The slopes of these regressions are significantly different as determined by homogeneity of slopes test (F = 35, p < 0.01). Further, the shape variation produced by projecting each variable on to the allometry free data is also significantly different (MANOVA, p < 0.001). Figure 7B shows the correlation matrix for the size measures of age, from which the common measure of size was obtained. Figure 7C shows the resampled variances explained (r2) that correspond to the regressions of each conditional dataset on the common measure of size. These values estimate the proportion of size-related or allometric variation that corresponds to a standardized amount of variation (1x variance) in each independent variable. As in the variance component estimates above, there results show that centroid size is associated with the most allometric variation, head circumference the least, while weight, height and age fall in between. The resampled distributions in Fig. 7C show that centroid size is associated with significantly more variation and head circumference with significantly less variation than the other three variables.
Figure 7.

A) Regression of the conditional variation for each variable against the first PC of the size measures and age. B) Visualization of the correlation matrix for the size measure and age. C) The shape variances explained by each variable for the regressions of the conditional variation.
In the second method, we compared the directions of size-related shape variation, by resampling the regression coefficients obtained from separate regressions of the sex and population adjusted data on each variable. Figure 8A shows the 3D vectors that correspond to these regressions, scaled to 3x variance for each variable. Figure 8B shows the results of a resampling test to compare these vectors. These results show that all of the vectors are significantly different from one another (p<0.001) for all comparisons except for age and height (p = 0.103). However, all of the vectors are also significantly more similar than expected by chance (p < 0.001). Age and height are associated with the most similar shape changes, followed by centroid size and age. These results show that the shape changes associated with age and the various measures of size are closer to being parallel than random. However, most of the comparisons among these measures show shape transformations that differ significantly in both direction and magnitude.
Figure 8.

A shows the shape vectors that correspond to the regressions of face shape on each size measure and age. Some vectors point inwards from the surface of the face. B shows the distributions of angles among resampled vectors. Since all angles are positive, a mean angle of 0 is not possible. The Null distribution shows the expected distribution of angles when the angles between the vectors for the same regression is resamples. The blue line shows the expected mean when the angles are orthogonal (random) while the red line shows 0 (completely parallel).
Finally, we estimated the face shape variation related to the covariance of age and the four measures of size and compared this to the total face shape variation explained by all factors and their covariation in order to assess the extent to which the size/age measures converge on a single “allometry” factor. After adjusting the data for population and sex, size/age PC1 explains, 3.5% of the variation in facial shape. Adding PC2 brings this to 5%. All size/age PCs together explain 6.1% while a linear model for all size factors and their interactions explains 7.1% of the variation in facial shape. Thus, half of “allometric” variation is shared among size and age measures and half is distinctly associated with individual measures or subsets of measures.
Discussion
Allometric variation results from the correlated effects of variation in size and is special because variation in size is so ubiquitous and functionally important. Here, we have analyzed the facial shape correlates of four measures of size as well as age in a large sample of 3D facial images for Tanzanian and North American children of European descent. We report that facial shape is significantly related to height, weight, face size (centroid size), head circumference and age. The patterns of shape variation associated with these variables are broadly similar with the shape correlates of head circumference differing the most. Age and height are associated with the most similar shape variation (Figure 6). However, the patterns of shape variation also vary significantly in both direction and magnitude, showing that different measures of size are associated with overlapping but distinct patterns of variation in facial shape. To what extent do age and different size measures converge on a common axis of allometric variation in the face? Roughly half of the size-related variation is associated with a common allometric component while the remaining half is distinctly associated with particular measures or subsets of measures. Aside from head circumference, the proportion related to a common underlying size effect is likely higher than 50%. However, each measure also adds a component of variation that is distinct from the others.
Our analysis employs automated 3d landmarking. We used this approach because of the large volume of data which makes manual landmarking prohibitive by a single observer. Manual landmarking produces measurement error that can be difficult to minimize over a long period of data collection and when more than one observer are involved. This can produce effects that are not random and difficult to disentangle from the analyses (Fruciano et al., 2017). On the other hand, automated landmarking methods are fairly new and also have drawbacks. For one, the shape differences between outliers and the mean can be underestimated, resulting in variance compression (Li et al., 2017). Also, the landmark template influences landmark positions and methods for combining landmark analyses using multiple templates are not yet validated. Neither consideration is likely to influence our results or our interpretation.
Our results show that variation in the face is highly structured, with the majority of the shape variation for this fairly high (87) dimensional dataset falling on the first 10 PCs. This is consistent with other studies of morphological variation, including studies of human facial variation (Bugaighis et al., 2013 ; Gonzalez et al., 2011; Jonke et al., 2008; Young et al., 2016). The major axes of covariation involve the facial width, midfacial shape, as well as orbital shape and orientation. These aspects of facial variation also have significant heritabilities and genetic correlations (Cole et al., 2017).
The two populations studied here differ significantly in facial shape. This is unsurprising, as facial morphology is known to vary geographically or by ancestry (Buck and Vidarsdottir, 2012; Hopman et al., 2014; Klimentidis and Shriver, 2009). This effect is fairly small, however, compared to the variation within each population. This is consistent with the many studies of human variation that show much greater magnitudes of variation within than among populations (Lewontin, 1972; Relethford, 2002). Importantly, the interactions between age and population or measures of size and population of origin is much smaller still. This shows that the age-related shape changes have similar trajectories in our two populations. Population differences in facial allometry have been reported (Freidline et al., 2015; Viđarsdóttir et al., 2002). The populations in our study are genetically and geographically very different, and furthermore likely experience very different environmental influences, such as nutrition. Yet, their patterns of facial shape allometry are very similar.
Our findings also offer clues to the developmental basis for size-related variation in shape. Integration is the tendency for variation in developmental processes to produce covariation in morphological traits (Hallgrimsson et al., 2009). Allometric variation occurs when variation in a process that affects size produces correlated effects on shape. These correlated effects often relate to function, as in the case of scaling relationships (Schmidt-Nielsen, 1984) and may be shaped by selection (Cheverud, 1996). Here, face size emerges as the largest contributor to allometric variation in the face. Facial size covaries with height and weight but also varies independently of overall somatic size. Face size interacts with age as well as with height and weight. The head, including the face, grows earlier than stature and smaller individuals have relatively larger heads and faces. We show that the size of the face contributes significantly to face shape in a manner that differs from the effects of overall growth, suggesting that variation in facial growth is a source of allometric variation over and above the effects of overall somatic growth. The developmental basis for variation in head size or face size is not well understood. It is interesting, however, that one of the strongest signals in our genome-wide association study of facial form is for face centroid size and its allometric consequences (Cole et al., 2016). The similarity of the shape vectors associated with age and height suggests an underlying commonality in ontogenetic and static allometry. Mitteroecker et al. (2013) report a similar finding in a small cross-sectional sample of facial images of male children (N=19) and adults (N=25). Investigating the precise relationship between ontogenetic and static allometry, however, would require a study with a longitudinal design.
Weight also correlates significantly with facial shape when other size factors are considered. Weight can relate to face shape through adiposity (Mayer et al., 2017; Windhager et al., 2013). Further, lean body mass may also be related to face shape independently of stature. Face shape correlates with 2d/4d ratio in boys, which is related to testosterone level (Meindl et al., 2012), and lean body mass is associated with facial morphology in adult males (Holzleitner and Perrett). Variation in lean mass, skeletal robusticity, or adiposity would translate to covariation between weight and face shape that departs from the allometric pattern associated with other size measures.
Finally, the distinctiveness of the facial shape effects of head circumference suggest a fairly independent role for brain size in determining facial shape. Brain size correlates only weakly with stature and weight in humans (Heymsfield et al., 2007) and brain size relative to cranial base length and width have been shown to influence facial shape in birds, mouse models and humans (Bright et al., 2016; Gonzalez et al., 2013; Hallgrímsson et al., 2007; Lieberman et al., 2008; Marcucio et al., 2011; Martinez-Abadias et al., 2012; Marugán-Lobón et al., 2016; Parsons et al., 2011). It is not surprising, therefore, that head circumference, influenced largely by brain size, relates to facial shape differently than other measures of size.
Size-related variation accounts for less than 5% of overall variation in face shape in our study. This surprisingly low value is consistent with other studies of human facial variation (Gonzalez et al., 2011; Mydlova et al., 2015; Veleminska et al., 2012), although it contrasts with a much higher estimate obtained from an analysis of 2D sagittal plane projections of 3D landmarks of the whole skull (Rosas and Bastir, 2002). Studies of craniofacial morphology in other primates species also show that the allometric correlates of head size tend to account for a much larger greater proportions of shape variance (Ito et al., 2011; Lieberman et al., 2007). This may reflect a tendency for covariances among craniofacial traits to be lower in humans overall as has been shown in large comparative study of craniofacial integration (Porto et al., 2009). This may also relate to a tendency for individual features of human facial shape to appear quite early in ontogeny (Vidarsdottir and O Higgins, 2003).
We find that allometric variation in the face is complex in that shape correlates of various measures of size and age converge only partially on a single underlying variable. This is important for two reasons. First, allometry is a central concept in the study of evolution and development. Growth changes proportions and shape as well as size, and variation in size influences most morphological traits. Body size varies among past and present human populations for both genetic and environmental reasons, producing correlated changes in facial shape. To understand size-related variation in human facial shape, it is important to know whether allometry is a single axis of integration or whether the relationship between shape and size is more complex. Second, many genetic syndromes appear to influence the shape of the face (Gorlin et al., 2001). Many such syndromes also influence stature, body mass and brain size. For these reasons, it can be difficult to disentangle facial shape effects that are produced as a side-effect of the alteration in growth from those that result from other, more distinctive, perturbations to development.
Conclusion
This study addresses the influence of distinct measures of size and age on facial shape in children. We find that facial shape variation is highly structured, with most variation falling along a few axes of morphological co-variation. Allometric variation represents a relatively small fraction of total variance in facial shape (5%). The allometric component of variation is complex with age and the various measures of size correlating with overlapping but distinct patterns of covariation in facial shape.
Klingenberg (2016) distinguishes two concepts of allometry. In the Gould-Mosimann (Gould, 1966; Mosimann, 1958) approach, allometry is the covariation of shape with size, while the Huxley-Jolicoeur (Huxley, 1932; Jolicoeur, 1963) approach defines allometry as the covariation among traits that contain information about size (Klingenberg, 1998). In the former approach, an a priori assumption is made about what constitutes size while in the latter, size is assumed to be a single latent variable that can be teased out of covariation patterns. Our finding that allometry is complex has implications for both approaches, and underscores the need to fully explore how size-parameters influence morphology in the context of questions where allometry is either a factor of interest or a factor that must be quantified and controlled in an analysis.
The structure of phenotypic variation is determined by multiple developmental processes acting at different times, scales and locations in development (Hallgrimsson et al., 2009). Here, we have shown that allometric variation is complex, determined by variation in incompletely overlapping mechanisms that contribute to growth. This is important for understanding the genetic and developmental basis for allometry. Due to the importance of size variation in most populations and the fact that allometry is generally the largest component of variation for any morphological trait, determining how size produces variation in shape is a question of central importance for evolutionary morphology and for understanding the structure of morphological variation in humans.
Supplementary Material
Supplementary Figure 1: Thin-plate spline warps for PC 6–10 of Tanzanian and European-Derived North American sample. Negative and positive PC scores represented. Color map diagrams represent areas of greatest difference (red) and least difference (blue). Figure corresponds to Table 3.
Supplementary Figure 2: Variance explained by linear versus polynomial regressions (2–5 terms) for each size variable and age.
Acknowledgments
Grant support: Supported by NIH-NIDCR (U01DE020054) to RS and BH, and U01DE020078 to SW, NSERC Grant #238992-12 to BH, and the University of Calgary (UIRG to MM, KL and BH).
Supported by NIH-NIDCR (1U01DE020054) to RS and BH, NSERC Grant #238992-12 to BH and U01DE020078 to SW, and the University of Calgary (UIRG to MM, KL and BH). Many people participated in various aspects of the Facebase Tanzania project, of which this study is part. Megan Wright, Maria Finnsdóttir, and Kimia Ghavani, contribute to reconstruction of the facial image data. Sariko Matari and Saleh Seleman Mganzil, Mitzi Murray, John Humphreys, Kai Lukowiak, Kris, Kannon, Hayley Britz, Rebecca Green, Kim McKenney, Kimani Leyaro, Margaret Kaisoe, Diana Dills, Nicola Hahn, assisted in the field. We also thank the teachers in the many schools in which this work was conducted and, most importantly, the children who participated as well as their parents. Primary data were deposited at FaceBase (https://www.facebase.org/, accession: FB00000667.01.
References Cited
- Adams DC, Collyer ML, Otarola-Castillo E, Sherratt E. geomorph: Software for geometric morphometric analyses. R package version 2.1. 2014 http://cran.r-project.org/web/packages/geomorph/index.html.
- Adams DC, Otarola-Castillo E. Geomorph: an R package for the collection and analysis of geometric morphometric shape data. Methods in Ecology and Evolution. 2013;4:393–399. [Google Scholar]
- Aldridge K, Kane AA, Marsh JL, Yan P, Govier D, Richtsmeier JT. Relationship of brain and skull in pre- and postoperative sagittal synostosis. J Anat. 2005;206(4):373–385. doi: 10.1111/j.1469-7580.2005.00397.x. [DOI] [PMC free article] [PubMed] [Google Scholar]
- Bastir M. A systems-model for the morphological analysis of integration and modularity in human craniofacial evolution. J Anthropol Sci. 2008;86:37–58. [PubMed] [Google Scholar]
- Bastir M, Rosas A. Correlated variation between the lateral basicranium and the face: a geometric morphometric study in different human groups. Archives of Oral Biology. 2006;51(9):814–824. doi: 10.1016/j.archoralbio.2006.03.009. [DOI] [PubMed] [Google Scholar]
- Bastir M, Rosas A, O’Higgins P. Craniofacial levels and the morphological maturation of the human skull. Journal of Anatomy. 2006;209(5):637–654. doi: 10.1111/j.1469-7580.2006.00644.x. [DOI] [PMC free article] [PubMed] [Google Scholar]
- Baume RM, Buschang PH, Weinstein S. Stature, head height, and growth of the vertical face. Am J Orthod. 1983;83(6):477–484. [PubMed] [Google Scholar]
- Bright JA, Marugan-Lobon J, Cobb SN, Rayfield EJ. The shapes of bird beaks are highly controlled by nondietary factors. Proc Natl Acad Sci U S A. 2016;113(19):5352–5357. doi: 10.1073/pnas.1602683113. [DOI] [PMC free article] [PubMed] [Google Scholar]
- Buck T, Vidarsdottir US. Craniofacial evolution in Polynesia: a geometric morphometric study of population diversity. Am J Hum Biol. 2012;24(6):776–785. doi: 10.1002/ajhb.22315. [DOI] [PubMed] [Google Scholar]
- Bugaighis I, Mattick CR, Tiddeman B, Hobson R. Three-dimensional gender differences in facial form of children in the North East of England. Eur J Orthod. 2013;35(3):295–304. doi: 10.1093/ejo/cjr033. [DOI] [PubMed] [Google Scholar]
- Cheverud JM. Developmental integration and the evolution of pleiotropy. American Zoologist. 1996;36:44–50. [Google Scholar]
- Cole JB, Manyama M, Kimwaga E, Mathayo J, Larson JR, Liberton DK, Lukowiak K, Ferrara TM, Riccardi SL, Li M, et al. Genomewide Association Study of African Children Identifies Association of SCHIP1 and PDE8A with Facial Size and Shape. PLoS Genet. 2016;12(8):e1006174. doi: 10.1371/journal.pgen.1006174. [DOI] [PMC free article] [PubMed] [Google Scholar]
- Cole JB, Manyama MF, Larson JR, Liberton DK, Ferrara TM, Riccardi SL, Li M, Mio W, Klein OD, Santorico SA, et al. Heritability and Genetic Correlations of Human Facial Shape and Size. Genetics. 2017 doi: 10.1534/genetics.116.193185. [DOI] [PMC free article] [PubMed] [Google Scholar]
- Collyer ML, Adams DC, Otarola-Castillo E, Sherratt E. A method for analysis of phenotypic change for phenotypes described by high-dimensional data. Heredity. 2015;115:357–365. doi: 10.1038/hdy.2014.75. [DOI] [PMC free article] [PubMed] [Google Scholar]
- Edgar HJ, Hunley KL. Race reconciled?: How biological anthropologists view human variation. Am J Phys Anthropol. 2009;139(1):1–4. doi: 10.1002/ajpa.20995. [DOI] [PubMed] [Google Scholar]
- Freidline SE, Gunz P, Hublin JJ. Ontogenetic and static allometry in the human face: contrasting Khoisan and Inuit. Am J Phys Anthropol. 2015;158(1):116–131. doi: 10.1002/ajpa.22759. [DOI] [PubMed] [Google Scholar]
- Fruciano C, Celik MA, Butler K, Dooley T, Weisbecker V, Phillips MJ. Sharing is caring? Measurement error and the issues arising from combining 3D morphometric datasets. Ecology and evolution. 2017;7(17):7034–7046. doi: 10.1002/ece3.3256. [DOI] [PMC free article] [PubMed] [Google Scholar]
- German RZ, Meyers LL. The role of time and size in ontogenetic allometry: I. Review. Growth Develop and Aging. 1989;53:101–106. [PubMed] [Google Scholar]
- Gonzalez PN, Kristensen E, Morck DW, Boyd S, Hallgrimsson B. Effects of growth hormone on the ontogenetic allometry of craniofacial bones. Evolution & Development. 2013;15(2):133–145. doi: 10.1111/ede.12025. [DOI] [PMC free article] [PubMed] [Google Scholar]
- Gonzalez PN, Perez SI, Bernal V. Ontogenetic allometry and cranial shape diversification among human populations from South America. Anat Rec (Hoboken) 2011;294(11):1864–1874. doi: 10.1002/ar.21454. [DOI] [PubMed] [Google Scholar]
- Gorlin RJ, Cohen MM, Hennekam RCM. Syndromes of the head and neck. Oxford [England] ; New York: Oxford University Press; 2001. p. xiv.p. 1283. [Google Scholar]
- Gould SJ. Allometry and size in ontogeny and phylogeny. Biol Rev. 1966;41(4):587–640. doi: 10.1111/j.1469-185x.1966.tb01624.x. [DOI] [PubMed] [Google Scholar]
- Hallgrimsson B, Brown JJY, Ford-Hutchinson AF, Sheets D, Zelditch ML, Jirik FR. The brachymorph mouse and the developmental-genetic basis for canalization and morphological integration. Evolution and Development. 2006;8(1):61–73. doi: 10.1111/j.1525-142X.2006.05075.x. [DOI] [PubMed] [Google Scholar]
- Hallgrimsson B, Jamniczky H, Young NM, Rolian C, Parsons TE, Boughner JC, Marcucio RS. Deciphering the Palimpsest: Studying the Relationship Between Morphological Integration and Phenotypic Covariation. Evol Biol. 2009;36(4):355–376. doi: 10.1007/s11692-009-9076-5. [DOI] [PMC free article] [PubMed] [Google Scholar]
- Hallgrímsson B, Lieberman DE, Liu W, Ford-Hutchinson A, Jirik F. Epigenetic interactions and the structure of phenotypic variation in the cranium. Evolution & development. 2007;9(1):76–91. doi: 10.1111/j.1525-142X.2006.00139.x. [DOI] [PubMed] [Google Scholar]
- Heymsfield SB, Gallagher D, Mayer L, Beetsch J, Pietrobelli A. Scaling of human body composition to stature: new insights into body mass index. The American journal of clinical nutrition. 2007;86(1):82–91. doi: 10.1093/ajcn/86.1.82. [DOI] [PMC free article] [PubMed] [Google Scholar]
- Hill CA, Martinez-Abadias N, Motch SM, Austin JR, Wang Y, Jabs EW, Richtsmeier JT, Aldridge K. Postnatal brain and skull growth in an Apert syndrome mouse model. Am J Med Genet A. 2013;161A(4):745–757. doi: 10.1002/ajmg.a.35805. [DOI] [PMC free article] [PubMed] [Google Scholar]
- Holzleitner IJ, Perrett DI. Perception of strength from 3D faces is linked to facial cues of physique. Evolution and Human Behavior. 37(3):217–229. [Google Scholar]
- Hopman SM, Merks JH, Suttie M, Hennekam RC, Hammond P. Face shape differs in phylogenetically related populations. Eur J Hum Genet. 2014;22(11):1268–1271. doi: 10.1038/ejhg.2013.289. [DOI] [PMC free article] [PubMed] [Google Scholar]
- Hunley KL, Healy ME, Long JC. The global pattern of gene identity variation reveals a history of long-range migrations, bottlenecks, and local mate exchange: implications for biological race. Am J Phys Anthropol. 2009;139(1):35–46. doi: 10.1002/ajpa.20932. [DOI] [PubMed] [Google Scholar]
- Huxley JS. Problems of Relative Growth. London: Methuen; 1932. [Google Scholar]
- Ito T, Nishimura T, Takai M. Allometry and interspecific differences in the facial cranium of two closely related macaque species. Anat Res Int. 2011;2011:849751. doi: 10.1155/2011/849751. [DOI] [PMC free article] [PubMed] [Google Scholar]
- Jolicoeur P. Note: the multivariate generalization of the allometry equation. Biometrics. 1963;19(3):497–499. [Google Scholar]
- Jonke E, Prossinger H, Bookstein FL, Schaefer K, Bernhard M, Freudenthaler JW. Secular trends in the European male facial skull from the Migration Period to the present: a cephalometric study. Eur J Orthod. 2008;30(6):614–620. doi: 10.1093/ejo/cjn065. [DOI] [PubMed] [Google Scholar]
- Klimentidis YC, Shriver MD. Estimating genetic ancestry proportions from faces. PLoS One. 2009;4(2):e4460. doi: 10.1371/journal.pone.0004460. [DOI] [PMC free article] [PubMed] [Google Scholar]
- Klingenberg CP. Heterochrony and allometry: the analysis of evolutionary change in ontogeny. Biol Rev Camb Philos Soc. 1998;73(1):79–123. doi: 10.1017/s000632319800512x. [DOI] [PubMed] [Google Scholar]
- Klingenberg CP. MorphoJ: an integrated software package for geometric morphometrics. Molecular ecology resources. 2011;11(2):353–357. doi: 10.1111/j.1755-0998.2010.02924.x. [DOI] [PubMed] [Google Scholar]
- Klingenberg CP. Size, shape, and form: concepts of allometry in geometric morphometrics. Dev Genes Evol. 2016;226(3):113–137. doi: 10.1007/s00427-016-0539-2. [DOI] [PMC free article] [PubMed] [Google Scholar]
- Klingenberg CP, Marugan-Lobon J. Evolutionary covariation in geometric morphometric data: analyzing integration, modularity, and allometry in a phylogenetic context. Syst Biol. 2013;62(4):591–610. doi: 10.1093/sysbio/syt025. [DOI] [PubMed] [Google Scholar]
- Klingenberg CP, Zimmermann M. Static, ontogenetic, and evolutionary allometry: a multivariate comparison in nine species of water striders. Amer Nat. 1992:601–620. [Google Scholar]
- Lewontin RC. Evol Biol. Springer; 1972. The apportionment of human diversity; pp. 381–398. [Google Scholar]
- Li M, Cole JB, Manyama M, Larson JR, Liberton DK, Riccardi SL, Ferrara TM, Santorico SA, Bannister JJ, Forkert ND, et al. Rapid automated landmarking for morphometric analysis of three-dimensional facial scans. J Anat. 2017;230(4):607–618. doi: 10.1111/joa.12576. [DOI] [PMC free article] [PubMed] [Google Scholar]
- Lieberman DE, Carlo J, Ponce de Leon M, Zollikofer CP. A geometric morphometric analysis of heterochrony in the cranium of chimpanzees and bonobos. J Hum Evol. 2007;52(6):647–662. doi: 10.1016/j.jhevol.2006.12.005. [DOI] [PubMed] [Google Scholar]
- Lieberman DE, Hallgrímsson B, Liu W, Parsons TE, Jamniczky HA. Spatial packing, cranial base angulation, and craniofacial shape variation in the mammalian skull: testing a new model using mice. Journal of Anatomy. 2008;212(6):720–735. doi: 10.1111/j.1469-7580.2008.00900.x. [DOI] [PMC free article] [PubMed] [Google Scholar]
- Magwene PM, Westneat M. Comparing Ontogenetic Trajectories Using Growth Process Data. Systematic Biology. 2001;50(5):640–656. doi: 10.1080/106351501753328785. [DOI] [PubMed] [Google Scholar]
- Marcucio R, Hallgrimsson B, Young NM. Facial Morphogenesis: Physical and Molecular Interactions Between the Brain and the Face. Curr Top Dev Biol. 2015;115:299–320. doi: 10.1016/bs.ctdb.2015.09.001. [DOI] [PMC free article] [PubMed] [Google Scholar]
- Marcucio RS, Young NM, Hu D, Hallgrimsson B. Mechanisms that underlie co-variation of the brain and face. Genesis. 2011;49(4):177–189. doi: 10.1002/dvg.20710. [DOI] [PMC free article] [PubMed] [Google Scholar]
- Martinez-Abadias N, Mitteroecker P, Parsons TE, Esparza M, Sjovold T, Rolian C, Richtsmeier JT, Hallgrimsson B. The Developmental Basis of Quantitative Craniofacial Variation in Humans and Mice. Evol Biol. 2012;39(4):554–567. doi: 10.1007/s11692-012-9210-7. [DOI] [PMC free article] [PubMed] [Google Scholar]
- Marugán-Lobón J, Watanabe A, Kawabe S. Studying avian encephalization with geometric morphometrics. Journal of anatomy. 2016 doi: 10.1111/joa.12476. [DOI] [PMC free article] [PubMed] [Google Scholar]
- Mayer C, Windhager S, Schaefer K, Mitteroecker P. BMI and WHR Are Reflected in Female Facial Shape and Texture: A Geometric Morphometric Image Analysis. PLOS ONE. 2017;12(1):e0169336. doi: 10.1371/journal.pone.0169336. [DOI] [PMC free article] [PubMed] [Google Scholar]
- Meindl K, Windhager S, Wallner B, Schaefer K. Second-to-fourth digit ratio and facial shape in boys: the lower the digit ratio, the more robust the face. Proceedings of the Royal Society of London B: Biological Sciences:rspb20112351. 2012 doi: 10.1098/rspb.2011.2351. [DOI] [PMC free article] [PubMed] [Google Scholar]
- Mitteroecker P, Gunz P, Bernhard M, Schaefer K, Bookstein FL. Comparison of cranial ontogenetic trajectories among great apes and humans. J Hum Evol. 2004;46(6):679–697. doi: 10.1016/j.jhevol.2004.03.006. [DOI] [PubMed] [Google Scholar]
- Mitteroecker P, Gunz P, Windhager S, Schaefer K. A brief review of shape, form, and allometry in geometric morphometrics, with applications to human facial morphology. Hystrix-Italian Journal of Mammalogy. 2013;24(1):59–66. [Google Scholar]
- Mosimann JE. An analysis of allometry in the chelonian shell. Rev Can Biol. 1958;17(2):137–228. [PubMed] [Google Scholar]
- Mydlova M, Dupej J, Koudelova J, Veleminska J. Sexual dimorphism of facial appearance in ageing human adults: A cross-sectional study. Forensic Sci Int. 2015;257:519, e511–519. doi: 10.1016/j.forsciint.2015.09.008. [DOI] [PubMed] [Google Scholar]
- Olson EC, Miller RA. Morphological Integration. Chicago: University of Chicago Press; 1958. [Google Scholar]
- Parsons TE, Downey CM, Jirik FR, Hallgrimsson B, Jamniczky HA. Mind the Gap: Genetic Manipulation of Basicranial Growth within Synchondroses Modulates Calvarial and Facial Shape in Mice through Epigenetic Interactions. PLoS One. 2015;10(2):e0118355. doi: 10.1371/journal.pone.0118355. [DOI] [PMC free article] [PubMed] [Google Scholar]
- Parsons TE, Schmidt EJ, Boughner JC, Jamniczky HA, Marcucio RS, Hallgrimsson B. Epigenetic integration of the developing brain and face. Developmental Dynamics. 2011;240(10):2233–2244. doi: 10.1002/dvdy.22729. [DOI] [PMC free article] [PubMed] [Google Scholar]
- Polychronis G, Christou P, Mavragani M, Halazonetis DJ. Geometric morphometric 3D shape analysis and covariation of human mandibular and maxillary first molars. Am J Phys Anthropol. 2013;152(2):186–196. doi: 10.1002/ajpa.22340. [DOI] [PubMed] [Google Scholar]
- Porto A, de Oliveira F, Shirai L, De Conto V, Marroig G. The Evolution of Modularity in the Mammalian Skull I: Morphological Integration Patterns and Magnitudes. Evol Biol. 2009;36(1):118–135. [Google Scholar]
- R Development Core Team. R: A language and environment for statistical computing. R Foundation for Statistical Computing; Vienna, Austria: 2014. 2013. [Google Scholar]
- Relethford JH. Apportionment of global human genetic diversity based on craniometrics and skin color. Am J Phys Anthropol. 2002;118(4):393–398. doi: 10.1002/ajpa.10079. [DOI] [PubMed] [Google Scholar]
- Rohlf FJ. Shape Statistics: Procrustes Superimposition and Tangent Spaces. Journal of Classification. 1999;16:197–223. [Google Scholar]
- Rosas A, Bastir M. Thin-plate spline analysis of allometry and sexual dimorphism in the human craniofacial complex. American Journal of Physical Anthropology. 2002;117(3):236–245. doi: 10.1002/ajpa.10023. [DOI] [PubMed] [Google Scholar]
- Schlager S. Morpho and Rvcg – R-packages for geometric morphometrics, shape analysis and surface manipulations. In: Zheng G, SL, GS, editors. Statistical Shape and Deformation Analysis. Chapter 9. New York: Academic Press; 2017. [Google Scholar]
- Schmidt-Nielsen K. Scaling: Why is animal size so important. Cambridge: Cambridge University Press; 1984. [Google Scholar]
- Shaffer JR, Orlova E, Lee MK, Leslie EJ, Raffensperger ZD, Heike CL, Cunningham ML, Hecht JT, Kau CH, Nidey NL, et al. Genome-Wide Association Study Reveals Multiple Loci Influencing Normal Human Facial Morphology. PLoS Genet. 2016;12(8):e1006149. doi: 10.1371/journal.pgen.1006149. [DOI] [PMC free article] [PubMed] [Google Scholar]
- Veleminska J, Bigoni L, Krajicek V, Borsky J, Smahelova D, Caganova V, Peterka M. Surface facial modelling and allometry in relation to sexual dimorphism. Homo. 2012;63(2):81–93. doi: 10.1016/j.jchb.2012.02.002. [DOI] [PubMed] [Google Scholar]
- Viđarsdóttir US, O’Higgins P, Stringer C. A geometric morphometric study of regional differences in the ontogeny of the modern human facial skeleton†. Journal of Anatomy. 2002;201(3):211–229. doi: 10.1046/j.1469-7580.2002.00092.x. [DOI] [PMC free article] [PubMed] [Google Scholar]
- Vidarsdottir US, Higgins OP. Developmental variation in the facial skeleton of anatomically modern Homo sapiens. In: Thompson JKG, Nelson, editors. Patterns of growth and development in the genus Homo. Cambridge: Cambridge University Press; 2003. pp. 114–143. [Google Scholar]
- Wang K-Y, Diewert VM. A morphometric analysis of craniofacial growth in cleft lip and noncleft mice. J Cranfac Genet Dev Biol. 1992;12(3):141–154. [PubMed] [Google Scholar]
- Webster M, Zelditch ML. Evolutionary modifications of ontogeny: heterochrony and beyond. Paleobiology. 2005;31(3):354–372. [Google Scholar]
- Wiley DF, Amenta N, Alcantara DA, Ghosh D, Kil YJ, Delson E, Harcourt-Smith W, Rohlf FJ, St John K, Hamann B. Visualization, 2005 VIS 05 IEEE. IEEE; 2005. Evolutionary morphing; pp. 431–438. [Google Scholar]
- Windhager S, Patocka K, Schaefer K. Body fat and facial shape are correlated in female adolescents. American Journal of Human Biology. 2013;25(6):847–850. doi: 10.1002/ajhb.22444. [DOI] [PubMed] [Google Scholar]
- Young NM, Sherathiya K, Gutierrez L, Nguyen E, Bekmezian S, Huang JC, Hallgrimsson B, Lee JS, Marcucio RS. Facial surface morphology predicts variation in internal skeletal shape. Am J Orthod Dentofacial Orthop. 2016;149(4):501–508. doi: 10.1016/j.ajodo.2015.09.028. [DOI] [PMC free article] [PubMed] [Google Scholar]
Associated Data
This section collects any data citations, data availability statements, or supplementary materials included in this article.
Supplementary Materials
Supplementary Figure 1: Thin-plate spline warps for PC 6–10 of Tanzanian and European-Derived North American sample. Negative and positive PC scores represented. Color map diagrams represent areas of greatest difference (red) and least difference (blue). Figure corresponds to Table 3.
Supplementary Figure 2: Variance explained by linear versus polynomial regressions (2–5 terms) for each size variable and age.