Abstract
Purpose
Existing methods for sorting, labeling, registering, and across-subject localization of electrodes in intracranial encephalography (iEEG) may involve laborious work requiring manual inspection of radiological images.
Methods
We describe a new open-source software package, the interactive electrode localization utility which presents a full pipeline for the registration, localization, and labeling of iEEG electrodes from CT and MR images. In addition, we describe a method to automatically sort and label electrodes from subdural grids of known geometry.
Results
We validated our software against manual inspection methods in twelve subjects undergoing iEEG for medically intractable epilepsy. Our algorithm for sorting and labeling performed correct identification on 96% of the electrodes.
Conclusions
The sorting and labeling methods we describe offer nearly perfect performance and the software package we have distributed may simplify the process of registering, sorting, labeling, and localizing subdural iEEG grid electrodes by manual inspection.
Keywords: Electrocorticography, Image registration, CT, MRI, Software
Introduction
Intracranial electroencephalography (iEEG) is routinely used prior to resective surgery in patients with medically refractory epilepsy to precisely localize epileptogenic and eloquent cortical areas [1–3]. Because of considerable advantages in spatial and temporal resolution compared to noninvasive modalities, in recent years iEEG has additionally been widely used to study cognitive processes and intrinsic brain activity [4–8].
In iEEG it is crucial to precisely identify the electrode locations with respect to the individual’s neuroanatomical structures. Numerous methods have been proposed to coregister electrode locations to the individual subject’s anatomy or to a standardized coordinate space such as MNI coordinates, utilizing techniques such as intraoperative photography, postoperative MRI, and postoperative CT scans to identify electrode locations [9–11].
After ascertaining the electrode locations, it is necessary to identify to which array the electrode belongs, and to then to match the electrode locations with the names assigned in the raw data files. We refer to these tasks as sorting and labeling of the electrodes, respectively.
Sorting and labeling of intracranial electrodes is nontrivial and has not been widely addressed by previous work. Using existing methods, the sorting and labeling procedures are typically done by manual inspection, which can be laborious and time-consuming. While the process can sometimes be expedited with use of appropriate tools such as 3D visualizations and renderings [12–14], further gains could be realized by automation. Although many studies have been published for localization of electrodes, to the best of our knowledge, no prior work has described an automated method to perform automated sorting and labeling.
In the current manuscript, we introduce a new standalone software package performing automated electrode sorting and labeling of subdural grid arrays: the intracranial electrode localization utility (IELU). In addition to sorting and labeling, IELU provides a complete pipeline for electrode localization, incorporating existing key algorithms from electrode localization, image registration, and anatomical ROI identification using FreeSurfer anatomical parcellations [15–18].
Materials and methods
Description of electrode sorting and labeling algorithm
The algorithm takes as input a set of candidate electrode positions in an isotropic coordinate space, and attempts to identify the most likely position of an N × M grid. The grid dimensions N and M are known in advance. The algorithm attempts to iteratively construct a working set of electrodes comprising the target grid. There are three steps: (1) triangle identification, (2) grid expansion, (3) grid selection.
1. Triangle identification
In triangle identification, we identify triplets of candidate electrodes which form a right or nearly right angle. More specifically, we search for triangles containing an angle of |90 − ε| degrees. All such triangles are computed and sorted by angle measure; triangles with angles closest to right angles are ordered first, and are examined in order.
2. Grid expansion
We here introduce the concept of a working set. The working set is defined as an unbounded, growing 2-dimensional Cartesian plane, with some integral positions in the plane marked by candidate electrodes. Initially, a working set is comprised of the three electrodes in the next candidate triangle. All candidate electrodes in the working set mark a unique integral-valued point in the plane; thus each electrode has a 3-dimensional position in the brain, and if additionally in a working set has a 2-dimensional position specific to that working set. The working set represents a search space for the true grid electrodes, however not all electrodes in the working set are true grid electrodes. Electrodes can be added to a working set, but never removed.
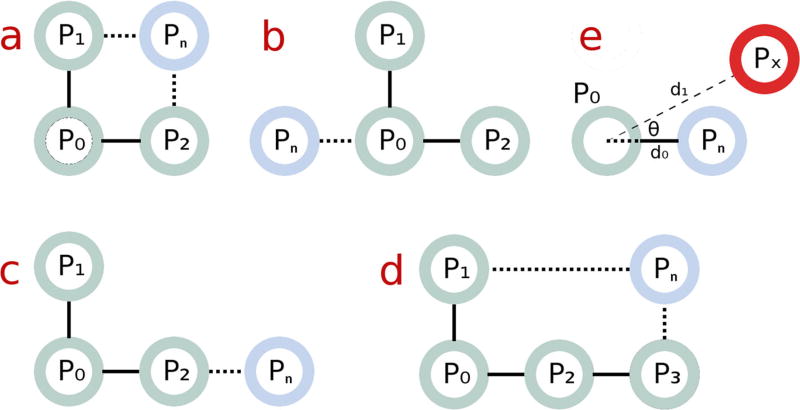
We iterate through the electrodes already in the working set, called reference points, searching for candidates to extend the grid. This iteration can be done in any order, as long as every reference point is examined in sequence; in our implementation the iteration is done in a random order. Candidate electrodes are added to the working set, if their location is sufficiently close to the expected location of a new electrode in the working set plane (see Fig. 1a–d).
Fig. 1.
a–d Possible orientations for the expansion of a working set with additional electrodes. The working set predicts the presence of a Pn near a reference point P0 and additional working set electrodes P1, P2, P3. e The actual measured position of the real candidate electrode Px must be within a certain distance and a certain angle of the position of the predicted electrode Pn, relative to the reference point P0
A sufficiently close match is defined as follows. The 3-dimensional euclidean distance d1 between the candidate electrode and the reference point in the working set must be approximately c, the average distance between all orthogonally adjacent electrode pairs in the working set. Additionally, the candidate electrode must form approximately a right angle θ with other electrodes in the working set. For parameters δ and ρ, we formalize the following two conditions:
Distance condition c (1 − δ) < d1 < c (1 + δ)
Angle condition
Iteration of the working set repeats continuously, starting again from the beginning reference point, and continues exhaustively until no more candidate electrodes can be added to the working set from any reference point in the working set.
3. Grid selection
The working set may contain gaps or missing electrodes. Intuitively, we select the grid which overlays the working set with the fewest gaps. More formally, we examine every possible N by M rectangle in the 2-dimensional working set. Let the number of electrodes (excluding gaps) contained within this N by M rectangle be η. The rectangle which maximizes η is selected as the final configuration if η ≥ NMτ for 0 < τ ≤ 1. If no rectangle satisfies this condition, all electrodes in the working set are returned to the set of candidate electrodes and we return to step 2, grid expansion, and proceed with the next candidate triangle.
Algorithm parameters and properties
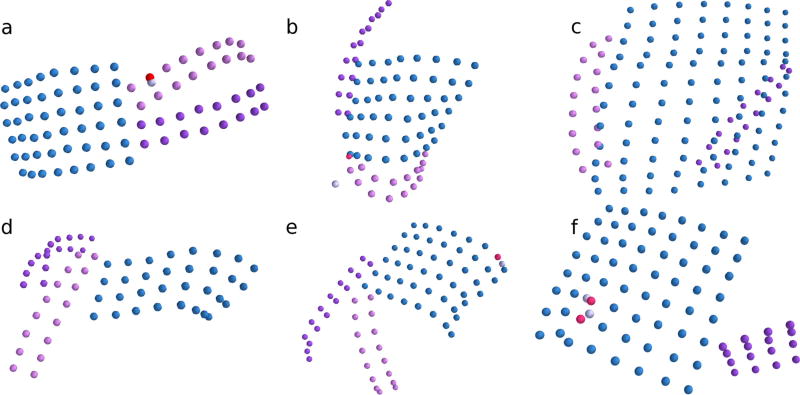
The algorithm described here has three favorable properties. Firstly, as described above, our algorithm is robust to small numbers of missing electrodes caused by noise, minor image defects, etc. Second, because the algorithm only considers local geometric constraints, it is extremely robust to recognizing complex grid curvature, even in cases where the grid is sharply folded (see Fig. 4). Finally, the algorithm runs quickly, taking no more than a minute or two to complete.
Fig. 4.
Results of the sorting and labeling algorithm are shown for six of twelve subjects with subdural grids implanted. The algorithm is robust to identifying correct electrode configurations even when grids are substantially folded (e.g., across the cortex). a–f Correctly sorted electrodes are displayed by grid color in blue, purple, and pink. Incorrectly sorted electrodes are displayed in red. True electrodes that were not identified correctly by the sorting algorithm are displayed in light gray. Additional candidate electrode locations correctly identified as noise are not shown
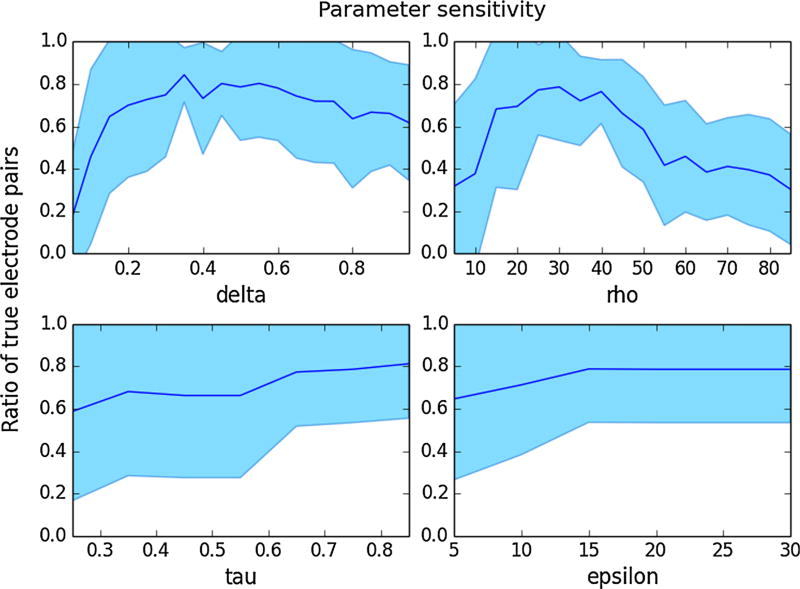
In our implementation, we use δ = 0.45, ρ = 2π/9, and τ = 0.85 as default values. To exclude candidate triangles, we use the default value ε = 15 degrees. The default parameter values were selected using a Monte-Carlo hyperparameter sensitivity analysis examining these four parameters. The true electrode configurations were determined manually a priori, and the objective function was defined as the proportion of electrode pairs that were grouped into the same grid in the test configuration, compared to the true configuration. In the first step, a local maximum of the four-dimensional parameter space was estimated using a Monte-Carlo simulation. In the second step, the parameters were tuned individually using the local maximum from the first step as a starting point, while the other parameters were held constant (see Fig. 5). The local maxima from the first and second steps were averaged together to determine the default parameter values.
Fig. 5.
Sensitivity analyses showing local maxima within a range for four hyperparameters of the sorting and labeling algorithm. One parameter was varied, while the others were held constant. The objective function is defined as the proportion of correct electrode pairs in the test electrode configuration as compared to the true configuration. Standard error windows are shown in light blue
Software details
We here describe the details of the pipeline of our software package IELU, and accompanying technical information.
The pipeline consists of four main steps. First, the presurgical structural MRI is registered with a postsurgical CT and candidate electrodes are extracted. Second, the subdural electrodes are sorted and labeled with the algorithm described above. Third, if depth electrodes are present, they are interactively identified and labeled. Finally, subdural electrodes are snapped to the cortical surface to account for the deformation of the CT image. After each step, the user is given the opportunity to interactively examine and modify the results of previous steps.
Registration and extraction of candidate electrode positions
The first step in IELU’s pipeline is the registration of a presurgical structural MRI with a postimplantation CT. To perform the initial rigid-body alignment, we use a mutual information maximization algorithm. We use mri_robust_register, a tool bundled with FreeSurfer, to perform this registration [15].
Candidate electrode positions are extracted nearly as described by Taimouri et al. [17]. First, the CT is thresholded to remove medium intensity structures such as the skull. Subsequently, to remove noise, suprathreshold voxels are eroded using a spherical kernel of radius one. The candidate electrode positions are the centers of mass of any remaining clusters. Candidate electrodes falling outside a dilated brain-mask are regarded as noise and removed.
Interactive visualization and adjustment
Following extraction of candidate electrode positions, the sorting and labeling algorithm described above is performed. After the sorting procedure, IELU displays the sorted electrodes to the user and provides a point-and-click interface to make corrections if necessary.
The sorting procedure is a greedy algorithm; it returns the first identified configuration which matches the known geometric constraints. Use of greedy algorithms confers the benefit of speed; instead of inspecting all possible electrode configurations (which is NP-hard) we simply select the first sufficiently close configuration we encounter. Therefore sometimes the algorithm produces configurations with minor errors. Using IELU’s interactive interface, such configurations are easy for the user to detect and correct (see Fig. 4).
Labeling
After sorting by the algorithm described above, the user may associate the sorted electrodes with channel names contained in the raw data files.
Following interactive correction of any errors in the initial sorting, the sorting and labeling algorithm is repeated for labeling. During labeling, the input set of candidate electrodes constrained to the true set of electrodes, and the parameter τ is set to 1.0; that is, 100% of the predicted electrodes must be accounted for.
The channel names are then assigned according to the electrodes’ positions in the resultant grid. Naming conventions commonly use integer values to describe grid position; for example, the channel at position (7, 8) in grid G might be called G78 in a concatenating naming convention, or G56 in a serial convention. Several naming conventions are supported.
The labeling algorithm does not disambiguate rotations and reflections. The user can rotate or reflect the assigned label names from the GUI.
Snapping electrodes to the cortical surface
Accurately registering electrode positions to a preoperative MRI scan is hindered by brain shift following implantation. More specifically, the craniotomy necessary for implantation of subdural electrodes causes swelling of fluids in the dura, introducing a nonlinear deformation in the shape of the cortical surface not present in the preoperative structural MRI [19]. We utilize a snapping technique described in previous literature which accounts for some of the brain shift [16]. The full details of this algorithm are omitted from this manuscript; however, a brief summary follows.
Electrode positions extracted from the CT and registered to the MRI are initially located in the subcortical parenchyma. First, electrodes are projected onto the nearest vertex. Imaginary “springs” are then positioned between electrodes. The potential energy of the springs—i.e., the energy necessary to lengthen or compress the spring away from its equilibrium distance—is summed together in a global cost function. The global cost function is minimized using an optimization algorithm such as simulated annealing [20]. The final electrodes locations are approximately equidistant, and electrode locations deviate as little as possible from initial estimates.
Implementation details
IELU is written in python and uses other tools written in python. For interactive 3D visualization, IELU uses Mayavi [21]. For interactive 2D plotting, IELU uses chaco and matplotlib [22]. The GUI is written using the Qt toolkit and traitsui framework. Additionally, IELU depends on MNE-python [23], nibabel, PySurfer, and PyMCubes.
IELU is built on top of the FreeSurfer [24] image processing suite. Therefore, IELU works only on unix-like platforms which FreeSurfer supports such as Linux and OS X.
IELU is distributed as free software under the GPLv3 license. The source code can be accessed at https://github.com/aestrivex/ielu. Extensive documentation, including installation instructions, can be accessed at https://github.com/aestrivex/ielu/wiki.
To simplify installation, we suggest that users use a precompiled scientific python distribution such as Anaconda (https://www.continuum.io/downloads). Dependencies can then be installed with a few simple commands.
Validation
Subjects
Twelve participants with pharmacologically intractable epilepsy participated in the study. Informed consent was obtained from all individual participants included in the study. The study was approved by the Massachusetts General Hospital IRB. Subjects were implanted with a combination of subdural grid arrays and depth arrays. Preoperative imaging consisted of MRI of the head including a T1 MPRAGE with 1.0 mm3 isotropic voxels. Postimplantation CT scans were also acquired, with variable acquisition parameters.
Procedure
To validate our sorting algorithm, we calculated the intersection between the sorted electrodes using our algorithm and the true set of sorted electrodes, identified manually by an experienced technician.
Results
Electrode localization and visualization
Twelve subjects’ data were processed with the IELU pipeline. For each subject, the electrodes are visualized as spheres located inside a transparent glass brain. Electrodes are sorted into grids and strips according to color. Following sorting and labeling, the user is given the opportunity to change the sorting assignments, and to add, remove, or relocate electrodes using a simple point-and-click interface.
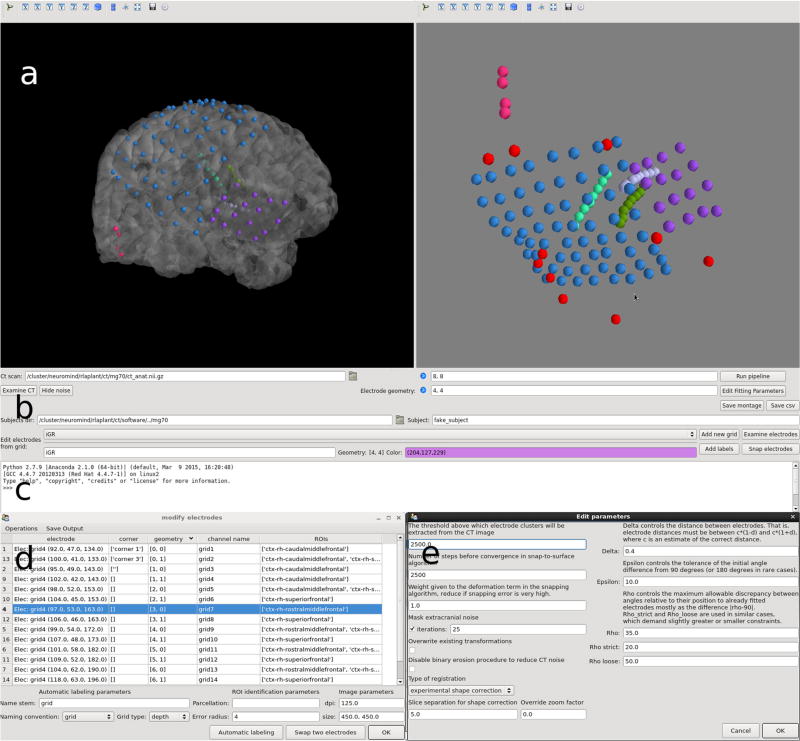
Figure 2 shows the full GUI, with 3D visualizations of one subject’s finalized electrode positions displayed along the glass brain, in addition to many other features.
Fig. 2.
The main features of IELU’s GUI are shown. a Two interactive 3D visualizations, in the MRI space with a glass cortical surface, and in the CT space with no surface. Implanted depth electrodes are also shown. b At the bottom of the GUI, the user can manage the current data, interact with the visualization, alter node assignments and configure program settings settings. c A python shell is also provided, exposing the program’s internals for short scripting. d The local electrode geometry can be adjusted in a separate window. e IELU has many configuration options available
Execution time
The most expensive step in the pipeline to localize electrodes is the registration between the CT and structural MRI images. This step usually completes within ten minutes, although it depends on the size of the CT image. The full pipeline, including interactive visualization and adjustments, usually takes no more than 30 minutes to run to completion.
Table 1 describes a typical pipeline along with the estimated execution time of each step.
Table 1.
Typical execution times of IELU pipeline steps
| Step | Description | Time (min) | Notes |
|---|---|---|---|
| Registration | CT image registered to the structural MRI using mutual information algorithm in FreeSurfer | ~4–12 | Execution time varies depending on CT quality and registration parameters |
| Localization | Morphological filtering; electrodes identified from suprathreshold clusters | 1–2 | Execution time varies depending on number of suprathreshold clusters and CT size |
| Noise removal | Electrodes far from brain mask are removed | <1 | |
| Sorting | Electrodes organized into likely grid configurations matching user-specified geometry | 1–3 | Execution time varies depending on number of grids implanted and amount of image noise |
| Interactive adjustment | User reviews and makes corrections to electrode positions, sorting assignments | ~5–10 | Varies considerably depending on complexity of implantation configuration and CT quality |
| Labeling | Electrodes associated with channel names. User corrects for rotation or reflection | 1 | |
| Snapping | Electrodes projected to smoothed pial surface and adjusted based on potential energy of invisible springs | 2–3 | Execution time varies depending on annealing parameters |
| Total | ~15–30 |
Sorting and labeling
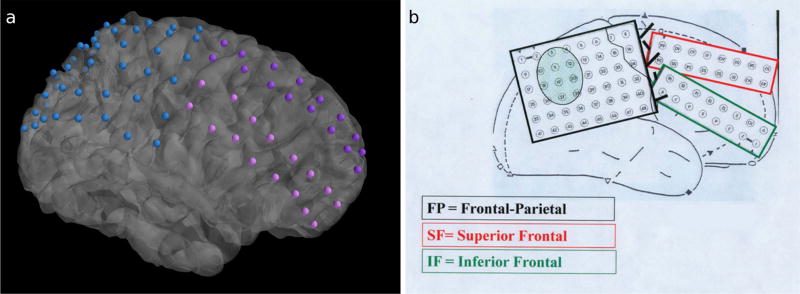
We evaluated the correctness of our sorting and labeling algorithm by comparing the sorting and labeling results of our algorithm with the true sorting and labeling results, which were determined manually by a technician. As some of the CT images were highly anisotropic, we linearly transformed the candidate electrodes to an isotropic coordinate space before sorting (Fig. 3).
Fig. 3.
Comparison of 3D visualizations produced by IELU and electrode implantation schematics for one subject. a The electrode configurations output by IELU are shown following execution of the full pipeline alongside b the surgical schematic
The sorting results are described fully in Table 2, and depicted partially in Fig. 4. 94.8% of the true electrodes were accurately identified by our algorithm. Miscategorized electrodes usually occurred when noise was mistaken for a true electrode, causing an electrode to appear far from the true electrode position (Fig. 5).
Table 2.
Sorting results for twelve subjects with subdural grids
| Subject | Grid 1 accuracy | Grid 2 accuracy | Grid 3 accuracy | Grid 4 accuracy | Total accuracy |
|---|---|---|---|---|---|
| Subject 1 | 8 × 6 | 8 × 2 | 8 × 2 | 79/80 (99%) | |
| 48/48 | 16/16 | 15/16 | |||
| Subject 2 | 8 × 8 | 61/64 (95%) | |||
| 61/64 | |||||
| Subject 3 | 8 × 8 | 8 × 4 | 94/96 (98%) | ||
| 62/64 | 32/32 | ||||
| Subject 4 | 8 × 8 | 8 × 4 | 92/96 (96%) | ||
| 63/64 | 29/32 | ||||
| Subject 5 | 8 × 8 | 60/64 (94%) | |||
| 60/64 | |||||
| Subject 6 | 8 × 8 | 4 × 4 | 78/80 (98%) | ||
| 62/64 | 16/16 | ||||
| Subject 7 | 12 × 8 | 8 × 2 | 8 × 2 | 128/128 (100%) | |
| 96/96 | 16/16 | 16/16 | |||
| Subject 8 | 8 × 4 | 8 × 2 | 8 × 2 | 64/64 (100%) | |
| 32/32 | 16/16 | 16/16 | |||
| Subject 9 | 8 × 8 | 8 × 2 | 8 × 2 | 95/96 (99%) | |
| 64/64 | 16/16 | 15/16 | |||
| Subject 10 | 8 × 4 | 8 × 2 | 8 × 2 | 64/64 (100%) | |
| 32/32 | 16/16 | 16/16 | |||
| Subject 11 | 8 × 6 | 8 × 2 | 8 × 2 | 79/80 (99%) | |
| 47/48 | 16/16 | 16/16 | |||
| Subject 12 | 8 × 2 | 8 × 2 | 8 × 2 | 8 × 2 | 31/64 (48%) |
| 16/16 | 15/16 | 0/16 | 0/16 | ||
| 925/976 (95%) |
Results compare overlap between automatically sorted grids using novel sorting and labeling algorithm and true grids determined by manual inspection
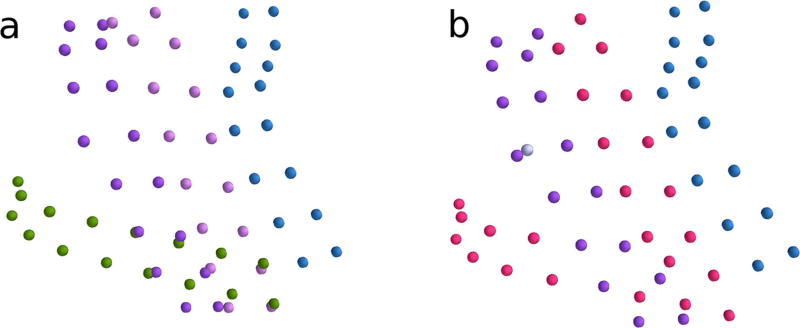
Another type of miscategorization occurred when the software failed to locate an entire grid. This occurred in only one of twelve subjects, who was implanted with a particularly complex pattern of 8 × 2 overlapping grids. The algorithm failed to isolate two of the 8 × 2 grids, and only 48% of the electrodes from this subject were identified correctly. The error was corrected by manually indicating the true electrode positions of the missing grid in IELU’s point-and-click interface, which takes an experienced user less than five minutes. Figure 6a depicts the true electrode positions following correction in IELU, and Fig. 6b depicts the automatically generated grid configuration for this subject.
Fig. 6.
a True grid configuration of one subject with overlapping grids. Each color represents a distinct grid. b Results of sorting and labeling algorithm for the same subject. Correctly sorted electrodes are shown in blue and purple. True electrodes that were not identified correctly by the sorting algorithm are displayed in light gray. The improperly omitted electrodes, belonging to two grids which were not identified, are shown in red
Following manual correction of miscategorized electrodes, automated labeling was performed. 100% of the electrodes were labeled correctly across all subjects.
Discussion
Here, we describe IELU, a standalone interactive software pipeline for the localization, sorting, labeling, and anatomical identification of electrodes from intracranial EEG data.
We introduce in IELU an algorithm for the automated sorting and labeling of subdural-type electrodes. In currently established methods, the process of localizing and labeling subdural electrodes can be a laborious manual procedure. Our sorting and labeling algorithm may help to obviate this labor.
We evaluated the correctness of the sorting and labeling algorithm by applying it to twelve subjects with subdural grid electrodes. 94.8% of the electrodes were identified correctly, relative to the true electrodes found by manual inspection.
Our algorithm therefore does not offer perfect performance. Consequently, our software package IELU is designed to provide an interactive, rather than fully automated pipeline. Our design philosophy is that some problems are easy for the computer, while other problems are difficult for the computer to solve (in reasonable time) but very easy for the user. We therefore designed IELU with customized tools to diagnose and fix common sources of error quickly and easily. Future work might instead seek to develop approximation algorithms to perform perfect sorting and labeling in a reasonable time.
Our software has several limitations. IELU cannot be used when CT images are unavailable, such as when resection occurs immediately following implantation. Furthermore IELU depends on reasonably good quality CT images; the use of poor quality CT acquisitions with high slice thickness, low resolution, or high anisotropy, often results in large amounts of registration error. A further limitation is that our automated sorting and labeling algorithm only operates on electrodes from subdural grids, although other electrode types such as N × 1 subdural strips, depth leads, and deep brain leads, can be manually sorted and labeled in IELU. Development of additional algorithms for automated sorting and labeling of other electrode types is a possible direction of future work.
However, in spite of these limitations, IELU offers a unique integrated user experience, to simplify the anatomical identification and co-registration of intracranial EEG electrodes.
Acknowledgments
We thank Giovanni Piantoni for his assistance with hardware and technical support. We thank Kristen K. Ellard, Samuel Zorowitz, Tatiana Sitnikova, Afsana Afzal, Anna L. Gilmour, Amanda R. Arulpragasam, and Thilo Deckersbach for their assistance with data collection. This work was made possible by grants NCRR S10RR014978, NIH S10RR031599, R01-NS069696, 5RO1-NS060918, U01MH093765, 1S10RR023043, 1S10RR023401, P41-EB015896. This work was sponsored by the U.S. Army Research Office and Defense Advanced Research Projects Agency under Cooperative Agreement Number W911NF-14-2-0045. The aforementioned sponsor played no role in collection, analysis, or interpretation of data, and played no role in preparation of the manuscript.
Footnotes
Compliance with ethical standards
Statement of human rights All procedures performed in studies involving human participants were in accordance with the ethical standards of the institutional and/or national research committee and with the 1964 Helsinki Declaration and its later amendments or comparable ethical standards.
Statement on the welfare of animals This article does not contain any studies with animals performed by any of the authors.
Conflict of interest The authors have no conflicts of interest to declare.
References
- 1.Penfield W, Jasper HH. Epilepsy and the functional anatomy of the human brain. Oxford University Press; Oxford: 1954. [Google Scholar]
- 2.Engel AK, Moll CK, Fried I, Ojemann G. Invasive recordings from the human brain: clinical insights and beyond. Nat Rev Neurosci. 2005;6:35–47. doi: 10.1038/nrn1585. [DOI] [PubMed] [Google Scholar]
- 3.Tao JX, Ray A, Hawes-Ebersole S, Ebersole JS. Intracranial EEG substrates of scalp EEG interictal spikes. Epilepsia. 2005;46:669–676. doi: 10.1111/j.1528-1167.2005.11404.x. [DOI] [PubMed] [Google Scholar]
- 4.Crone NE, Boatman D, Gordon B, Hao L. Induced electrocorticographic gamma activity during auditory perception. Clin Neurophysiol. 2001;112:565–582. doi: 10.1016/s1388-2457(00)00545-9. [DOI] [PubMed] [Google Scholar]
- 5.Meltzer JA, Zaveri HP, Goncharova II, Distasio MM, Papademetris X, Spencer SS, Constable RT. Effects of working memory load on oscillatory power in human intracranial EEG. Cereb Cortex. 2008;18:1843–1855. doi: 10.1093/cercor/bhm213. [DOI] [PMC free article] [PubMed] [Google Scholar]
- 6.Lachaux JP, Fonlupt P, Kahane P, Minotti L, Hoffman D, Bertrand O, Baclu M. Relationship between task-related gamma oscillations and BOLD signal: new insights from combined fMRI and intracranial EEG. Hum Brain Mapp. 2007;28:1368–1375. doi: 10.1002/hbm.20352. [DOI] [PMC free article] [PubMed] [Google Scholar]
- 7.Jerbi K, Ossandon T, Hamame CM, Senova S, Dalal SS, Jung J, Minotti L, Bertrand O, Berthaz A, Kahane P, Lachaux JP. Task-related gamma-band dynamics from an intracerebral perspective: review and implications for surface EEG and MEG. Hum Brain Mapp. 2009;30:1758–1771. doi: 10.1002/hbm.20750. [DOI] [PMC free article] [PubMed] [Google Scholar]
- 8.Cash SS, Halgren E, Dehghani N, Rossetti AO, Thesen T, Wang C, Devinsky O, Kuzniecky R, Doyle W, Madsen JR, Bromfield E. The human K-complex represents an isolated cortical down-state. Science. 2009;324:1084–1087. doi: 10.1126/science.1169626. [DOI] [PMC free article] [PubMed] [Google Scholar]
- 9.Hermes D, Miller KJ, Noordmans HJ, Vansteensel MJ, Ramsey NF. Automated electrocorticographic electrode localization on individually rendered brain surfaces. J Neurosci Methods. 2010;185:293–298. doi: 10.1016/j.jneumeth.2009.10.005. [DOI] [PubMed] [Google Scholar]
- 10.Dalal SS, Edwards E, Kirsch HE, Barbaro NM, Knight RT, Nagarajan SS. Localization of neurosurgically implanted electrodes via photograph-MRI-radiograph coregistration. J Neurosci Methods. 2008;174:106–115. doi: 10.1016/j.jneumeth.2008.06.02. [DOI] [PMC free article] [PubMed] [Google Scholar]
- 11.Yang AI, Wang X, Doyle WK, Halgren E, Carlson C, Belcher TL, Cash SS, Devinsky O, Thesen T. Localization of dense intracranial electrode arrays using magnetic resonance imaging. NeuroImage. 2012;63:157–165. doi: 10.1016/j.neuroimage.2012.06.039. [DOI] [PMC free article] [PubMed] [Google Scholar]
- 12.Schulze-Bonhage AH, Huppertz HJ, Comeau RM, Honegger JB, Spreer JM, Zentner JK. Visualization of subdural strip and grid electrodes using curvilinear reformatting of 3D MR imaging data sets. Am J Neuroradiol. 2002;23:400–403. [PMC free article] [PubMed] [Google Scholar]
- 13.Kovalev D, Spreer JM, Honegger JB, Zentner JK, Schulze-Bonhage AH, Huppertz H-J. Rapid and fully automated visualization of subdural electrodes in the presurgical evaluation of epilepsy patients. Am J Neuroradiol. 2005;26:1078–1083. [PMC free article] [PubMed] [Google Scholar]
- 14.Kamida T, Anan M, Shimotaka K, Abe T, Fujiki M, Kobayashi H. Visualization of subdural electrodes with fusion CT scan/MRI during neuronavigation-guided epilepsy surgery. J Clin Neurosci. 2010;17:511–513. doi: 10.1016/j.jocn.2009.06.038. [DOI] [PubMed] [Google Scholar]
- 15.Reuter M, Rosas HD, Fischl B. Highly accurate inverse consistent registration: a robust approach. NeuroImage. 2010;53:1181–1196. doi: 10.1016/j.neuroimage.2010.07.020. [DOI] [PMC free article] [PubMed] [Google Scholar]
- 16.Dykstra AR, Chan AM, Quinn BT, Zepeda R, Keller CJ, Cormier J, Madsen JR, Eskandar EN, Cash SS. Individualized localization and cortical surface-based registration of intracranial electrodes. NeuroImage. 2012;59:3563–3570. doi: 10.1016/j.neuroimage.2011.11.046. [DOI] [PMC free article] [PubMed] [Google Scholar]
- 17.Taimouri V, Akhonda-Asi A, Tomas-Fernandez T, Peters JM, Prabhu SP, Poduri A, Takeoka M, Loddenkemper T, Bergin AMR, Harini C, Madsen JR, Warfield SK. Electrode localization for planning surgical resection of the epileptogenic zone in pediatric epilepsy. Int J Comput Assist Radiol Surg. 2014;9:91–105. doi: 10.1007/s11548-013-0915-6. [DOI] [PMC free article] [PubMed] [Google Scholar]
- 18.Princich JP, Wassermann D, Latini F, Oddo S, Blenkmann AO, Seifer G, Kochen S. Rapid and efficient localization of depth electrodes and cortical labeling using free and open source medical software in epilepsy surgery candidates. Front Neurosci. 2013;7:260. doi: 10.3389/fnins.2013.00260. [DOI] [PMC free article] [PubMed] [Google Scholar]
- 19.Hill DL, Maurer CR, Maciunas RJ, Barwise JA, Fitzpatrick MJ, Wang MY. Measurement of intraoperative brain surface deformation under a craniotomy. Neurosurgery. 1998;43:514–526. doi: 10.1097/00006123-199809000-00066. [DOI] [PubMed] [Google Scholar]
- 20.Van Laarhoven PJ, Aarts EH. Simulated annealing: theory and applications. Springer; Berlin: 1987. [Google Scholar]
- 21.Ramachandran P, Varoquaux G. Mayavi: 3D visualization of scientific data. Comput Sci Eng. 2011;13:40–51. [Google Scholar]
- 22.Hunter JD. Matplotlib: A 2D graphics environment. IEEE Comput Sci Eng. 2007;9:90–95. [Google Scholar]
- 23.Gramfort A, Luessi M, Larson E, Engemann DA, Strohmeier D, Brodbeck C, Goj R, Jas M, Brooks T, Parkkonen L, Hämäläinen M. MEG and EEG data analysis with MNE-python. Front Neurosci. 2013;7:267. doi: 10.3389/fnins.2013.00267. [DOI] [PMC free article] [PubMed] [Google Scholar]
- 24.Fischl B. FreeSurfer. NeuroImage. 2012;62:774–781. doi: 10.1016/j.neuroimage.2012.01.021. [DOI] [PMC free article] [PubMed] [Google Scholar]


