

ABSTRACT
Isolates of a given bacterial pathogen often display phenotypic variation, and this can negatively impact public health, for example, by reducing the efficacy of preventative measures. Here, we identify that the human pathogen group A Streptococcus (GAS; Streptococcus pyogenes) expresses pili on its cell surface in a serotype-specific manner. Specifically, we show that serotype M3 GAS isolates, which are nonrandomly associated with causing particularly severe and lethal invasive infections, produce negligible amounts of pili relative to serotype M1 and M49 isolates. Performance of an interserotype transcriptome comparison (serotype M1 versus serotype M3) was instrumental in this discovery. We also identified that the transcriptional regulator Nra positively regulates pilus expression in M3 GAS isolates and that the low level of pilus expression of these isolates correlates with a low level of nra transcription. Finally, we discovered that the phenotypic consequences of low levels of pilus expression by M3 GAS isolates are a reduced ability to adhere to host cells and an increased ability to survive and proliferate in human blood. We propose that an enhanced ability to survive in human blood, in part due to reduced pilus expression, is a contributing factor in the association of serotype M3 isolates with highly invasive infections. In conclusion, our data show that GAS isolates express pili in a serotype-dependent manner and may inform vaccine development, given that pilus proteins are being discussed as possible GAS vaccine antigens.
KEYWORDS: phenotypic variation, gene regulation, Streptococcus pyogenes, pili, bacterial virulence
INTRODUCTION
Bacterial pathogens often show significant intraspecies phenotypic variation, with colony morphology, growth requirements, adherence, and disease manifestations being just a few of the variable phenotypes described (1, 2). In some instances, phenotypic variation can be divided along type-specific (e.g., serotype, clonal type, haplotype) lines, indicating that there are type-specific genetic components responsible for the observed phenotypic differences (3, 4). For example, Staphylococcus aureus isolates from pulsed-field type USA300 show enhanced virulence relative to isolates from pulsed-field type USA200, and this is in part explained by differences in the Agr regulatory system, which is a major regulator of virulence factor expression (5, 6). In another example, the group A Streptococcus (GAS; Streptococcus pyogenes) shows serotype-specific variation in virulence and disease manifestations (7–9).
GAS isolates cause more than 700 million human infections globally per year, the majority of which are self-limiting infections of the upper respiratory tract (10). However, GAS isolates also cause severe invasive infections, including streptococcal toxic shock syndrome and necrotizing fasciitis (11). GAS infections may also result in one of several debilitating postinfection sequelae, such as acute rheumatic fever (12) or acute poststreptococcal glomerulonephritis (13). GAS isolates are grouped into serotypes on the basis of the sequence of the 5′ end of the emm gene, a gene which encodes the classical virulence factor, the M protein (14). While all GAS isolates are thought to have the potential to cause all GAS diseases, there are several long-known GAS serotype-disease phenotype associations. For instance, serotype M3 isolates are nonrandomly associated with causing particularly severe and lethal invasive infections (15), while serotype M18 GAS isolates are nonrandomly associated with cases of acute rheumatic fever (16).
In the process of investigating the association of serotype M3 GAS isolates with severe invasive infections, we and others identified that since at least the 1920s M3 isolates have harbored null mutations in three regulator-encoding genes (rocA, rivR, and fasC) (7, 17, 18). These mutations result in a significant reassortment of virulence factor expression in M3 isolates, including expression of the antiphagocytic hyaluronic acid capsule (7), the human protease inhibitor-binding protein G-related α2-macroglobulin-binding protein (GRAB) (17), and the thrombolytic factor streptokinase (19). For at least one regulatory gene mutation (rocA), the altered regulation enhances the ability of M3 GAS to survive in human blood and cause disease in mouse models of invasive infection (7). The data are consistent with the regulatory consequences of these mutations, with a serotype M3 GAS-specific virulence factor profile being the driving force behind the association of M3 GAS with severe invasive infections.
Pili are cell surface proteins that have long been a subject of study due to their role in promoting bacterial adherence (20, 21). In what was a surprise to the field, it was reported in 2005 that GAS isolates express pili (22). Pili facilitate GAS binding to host cells/tissues, promote biofilm formation, and modify the capacity of GAS to evade the host immune system in what appears to be a serotype-specific fashion (22–26). Thus, pili play key roles in the ability of GAS to cause disease. The pilus biosynthesis genes are found within a region of the genome that is both polymorphic and polygenic, a region referred to as the fibronectin-binding, collagen-binding, T-antigen (FCT) region (27). There are nine known FCT types, and in almost all cases, isolates of any given serotype harbor the same FCT region (28). The pilus biosynthesis genes are under the regulatory control of a transcription factor encoded by a sequence within the FCT region. Depending on the FCT type, this regulatory protein is one of two orthologues, the regulator of F (RofA) or negative regulator of GAS (Nra), which share 62% amino acid sequence identity (29). How Nra regulates pilus expression differs in a strain- and/or serotype-specific manner. Podbielski et al., working in a serotype M49 background (FCT type 3 [FCT-3]), described Nra to be a negative regulator of pilus expression (30), while Luo et al., working in a serotype M53 background (FCT-3), identified Nra to be a positive regulator of pilus expression (31). FCT types 2, 3, and 4 also encode a second transcription factor, the multiple sugar metabolism regulator (MsmR) (32). Similar to RofA/Nra, there are strain- and/or serotype-specific differences as to whether MsmR positively or negatively regulates pilus expression (31, 32). Importantly, while published data suggest that there may be serotype-specific differences in how pili are expressed (29–31) and in how pili function (25, 33, 34), no data point to there being serotype-specific differences on whether or not pili are expressed.
Here, we identify that pili are expressed on the GAS cell surface in a serotype-specific manner. Specifically, relative to serotype M1 and M49 GAS isolates, M3 isolates produce negligible amounts of pili. Investigation into the mechanism behind the diminished pilus expression of M3 isolates identified that Nra is a positive regulator of the pilus in isolates of this serotype and that attenuated nra transcription underlies the pilus phenotype. We also demonstrate that MsmR has no effect on pilus expression in M3 GAS isolates. Low levels of pilus expression were shown to reduce the adherence of M3 isolates in a tissue culture-based model of adherence and to increase the ability of M3 strains to survive and replicate in nonimmune whole human blood. Given these phenotypes, we propose that the serotype-specific reduction in pilus expression is a factor contributing to the association of M3 GAS isolates with severely invasive and lethal infections.
RESULTS
Significant interserotype variation in the abundances of virulence factor-encoding mRNAs.
Epidemiological studies have identified that serotype M3 GAS isolates are nonrandomly associated with particularly severe and lethal invasive infections (35). We propose that an M3 GAS-specific transcriptional pattern, due partly to inactivating mutations in the rocA, rivR, and fasC regulator-encoding genes (7, 17), is the major contributor to the differential disease profile of M3 isolates. To further investigate possible serotype M3 GAS-specific variations in gene transcription, but this time investigating it at the transcriptome level, we compared the transcriptomes of representative serotype M1 and M3 GAS isolates via a transcriptome sequencing (RNA-Seq)-based approach. GAS isolates MGAS2221 (serotype M1) and MGAS10870 (serotype M3), which are representative of their respective serotypes, as evident from several large population-based studies (36, 37), were compared. A total of 210 mRNAs were differentially regulated between MGAS2221 and MGAS10870 at a 2-fold cutoff level (Fig. 1; see also Table S1 in the supplemental material). Importantly, a majority of the genes with the highest disparity in mRNA levels between the two isolates encode known or hypothesized virulence factors. Given that M1 GAS strains are rocA positive and M3 GAS strains are rocA negative, the finding that the capsule biosynthesis operon (hasABC; black circles in Fig. 1) was transcribed at a higher level in M3 isolates than M1 isolates was expected since RocA negatively regulates this operon (7, 18). However, an unanticipated finding was that the levels of mRNAs from the pilus biosynthesis locus (red circles in Fig. 1) were dramatically (230- to 463-fold) lower in the M3 isolate. Similarly, the level of expression of the mRNA encoding the regulatory protein Nra was 29-fold lower in the M3 isolate than the level of expression of rofA mRNA in the M1 isolate. Together, these data raise the possibility that a distinguishing attribute of serotype M3 GAS isolates is that they do not harbor pili on their cell surface at appreciable levels.
FIG 1.
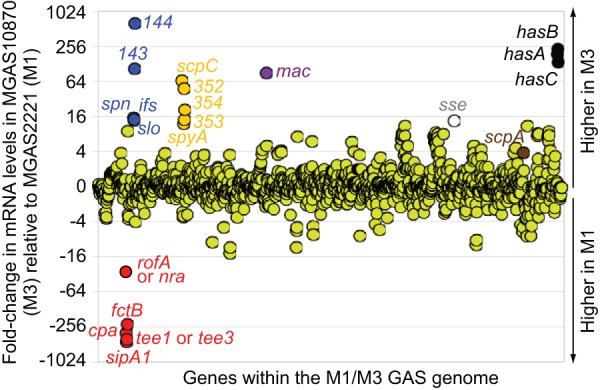
Interserotype transcriptome comparison. Scatterplot graph depicting differential gene expression between representative serotype M1 (MGAS2221) and M3 (MGAS10870) isolates. Triplicate cultures of each strain were grown to the mid-exponential phase of growth in THY broth. Total RNA was isolated and subjected to RNA-Seq analysis. The relative expression levels of all genes present in both M1 and M3 GAS strains are graphed, with each one being represented by a circle. Select virulence factor-encoding genes are labeled, and the color of the circle is changed from green. Genes encoding pilus regulatory and biosynthesis proteins are colored red. Genes are arranged in the same order in which they appear in the chromosome.
Serotype M3 GAS isolates have a reduced level of transcripts from the pilus biosynthesis region.
We next assessed whether the low level of pilus gene expression in MGAS10870, as identified from the RNA-Seq analysis (Fig. 1), is a serotype-defining characteristic of M3 isolates. To achieve this we performed absolute quantification of select pilus (test) and nonpilus (control) transcript levels by quantitative reverse transcription-PCR (qRT-PCR). We compared the expression levels among 10 clinical M1 GAS isolates (recovered between 1973 and 2010 from Finland, Canada, Denmark, the United States, Australia, or the Czech Republic), 19 clinical M3 GAS isolates (recovered between 1937 and 2010 from Germany, the United, Canada, the United Kingdom, or undefined locations), and 8 clinical M49 GAS isolates (recovered between the 1970s and 2004 from Germany, the Czech Republic, the United States, or undefined locations) (see Table S2 for more information about the GAS strains used). We included serotype M49 isolates in the analysis due to the fact that they share the same FCT type as M3 isolates (FCT-3) (Fig. 2), but unlike for M3 isolates, the presence of pili on the surface of M49 GAS isolates has been well characterized (38). Note that serotype M1 isolates have an FCT-2 type and, hence, differ from M3 and M49 isolates by harboring the regulatory gene rofA and not nra and lacking the second regulatory gene, msmR (Fig. 2). As expected, given that the regulator-encoding gene covR is not part of the FCT region, no differences in the abundance of covR mRNA were observed among the M1, M3, and M49 isolates (Fig. 3). In contrast, statistically significant differences in the abundance of mRNAs from genes encoding the pilus regulatory gene (rofA or nra), a minor pilus protein (cpa), or the major pilus protein (tee) were observed between the M3 isolates and the serotype M1 and M49 isolates (Fig. 3). The pilus transcripts were present in the M3 isolates at levels between 39- and 177-fold lower than the levels observed in the M1 or M49 isolates. Thus, at least relative to serotype M1 and M49 GAS isolates, serotype M3 isolates transcribe the genes required for pilus biosynthesis at significantly reduced levels.
FIG 2.

FCT region of serotype M1, M3, and M49 isolates. The schematic shows the GAS pilus biosynthesis locus in isolates of the M1 and M3/M49 serotypes. Genes are represented by arrows, with the direction of the arrows mirroring the direction of transcription. The colors of the arrows highlight the functions of the encoded proteins (see the key).
FIG 3.

Pilus biosynthesis and regulatory genes are transcribed at a significantly lower level in serotype M3 isolates than in serotype M1 or M49 isolates. TaqMan-based absolute quantification was performed to enable comparison of the abundance of mRNAs encoding the major (tee) and minor (cpa) pilus proteins and pilus regulatory proteins (rofA or nra) and the abundance of the regulator-encoding gene covR (as a control) in 10 clinical M1, 19 clinical M3, and 8 clinical M49 GAS isolates. The abundances of the mRNAs were determined from a minimum of duplicate exponential-phase GAS cultures of each strain, and the experiment was performed at least in duplicate. Each bar represents the mean ± standard deviation for each strain, with the serotype M1 isolates indicated in red (in the following order from left to right, respectively: MGAS2221, MGAS313, MGAS1264, MGAS1508, MGAS22259, SF370, MGAS5005, MGAS3350, MGAS5456, and MGAS9127), the M3 isolates indicated in blue (in the following order from left to right, respectively: MGAS315, MGAS10870, MGAS491, MGAS159, MGAS15049, MGAS182, MGAS1254, MGAS1428, MGAS9056, MGAS9507, MGAS22283, 31616/3065, 90-254, 90-132, L-035, PD-824, Di944, Di1216, and Di1253) and the M49 isolates indicated in green (in the following order from left to right, respectively: 49/123, 591, 71-716, 90-053, 90-397, 88-299, 89-288, and 90-306). The mean for the grouped M1, M3, and M49 samples is also shown for each transcript investigated. Statistical significance was determined via the t test. n/s, not significant.
Pili are not detected on the surface of clinical M3 GAS isolates but can be detected following the addition of an nra-expressing plasmid.
Given the published data showing the strain and/or serotype-specific variation in the roles that Nra and MsmR have in controlling pilus expression (30–32), we investigated this in M3 GAS isolates by creating nra and msmR deletion mutant derivatives of our parental M3 isolate MGAS10870. We also created plasmids pNra and pMsmR, which harbor, respectively, nra and msmR alleles similar to those observed in serotype M49 GAS isolates. We chose to work with M49 GAS alleles, as isolates of the M49 serotype are known to express pili (38) and these genes lack any serotype-specific mutations (see later). The pNra and pMsmR plasmids and the empty vector were individually transformed into the MGAS10870, MGAS10870 Δnra, and MGAS10870 ΔmsmR backgrounds. These strains were grown to the exponential phase of growth, cell wall-anchored proteins were isolated, and the proteins were used in Western blot analysis with an antipilus (T3) antibody. No pilus-specific reactivity between the antibody and the protein samples from any strain that harbored either the vector or pMsmR was observed (Fig. 4A). In contrast, all three derivatives containing pNra expressed high levels of pili on their surface. The data are consistent with clinical M3 GAS isolates expressing negligible amounts of cell surface pili, with Nra positively regulating M3 GAS pilus expression and with MsmR having no effect on pilus expression in this serotype.
FIG 4.
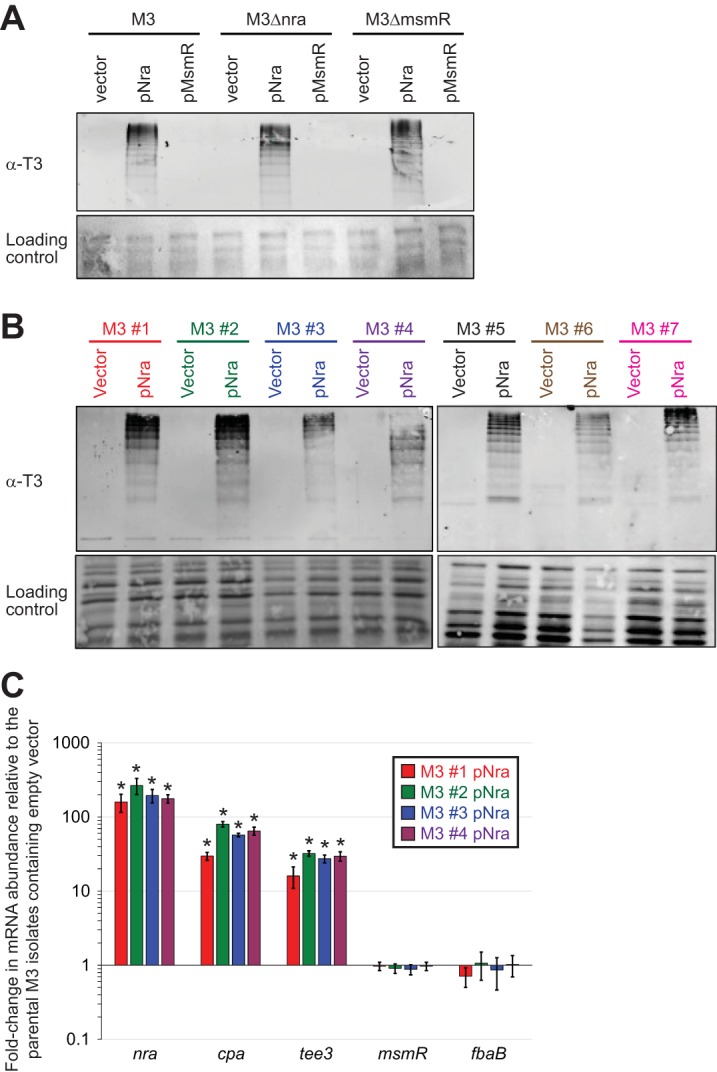
Plasmid-expressed nra, but not plasmid-expressed msmR, enhances pilus expression in serotype M3 GAS isolates. (A) Western blot analysis. The parental M3 isolate MGAS10870 (M3), an nra deletion mutant derivative (M3Δnra), and an msmR deletion mutant derivative (M3ΔmsmR) were transformed with the empty vector or plasmids expressing Nra (pNra) or MsmR (pMsmR). Cell wall proteins from exponential-phase cultures were isolated and used with an anti-T3 antibody. Note the characteristic laddering pattern. The membrane was stained following protein transfer to serve as a loading control. (B) Western blot analysis. Seven serotype M3 GAS isolates were transformed with the empty vector or pNra, and cell wall proteins were analyzed by Western blotting. The isolates were MGAS22283 (M3 #1), MGAS9056 (M3 #2), MGAS15049 (M3 #3), MGAS10870 (M3 #4), MGAS491 (M3 #5), MGAS159 (M3 #6), and MGAS182 (M3 #7). (C) TaqMan-based quantitative RT-PCR. Derivatives of MGAS22283 (M3 #1), MGAS9056 (M3 #2), MGAS15049 (M3 #3), and MGAS10870 (M3 #4) containing either the empty vector or pNra were grown to the exponential phase of growth before they were harvested and analyzed via quantitative RT-PCR. Shown are the averages ± standard deviations for duplicate samples run in duplicate. *, statistically significant difference relative to the parental isolates containing empty vector (t test, P < 0.05).
To ensure that our data gained with MGAS10870 were representative, we introduced the empty vector and pNra into six additional M3 isolates and tested the isolates for pilus expression via Western blot analysis. Similar to the data for MGAS10870, none of the additional M3 isolates containing the empty vector produced detectable pili, while the pNra-containing derivatives had robust pilus expression (Fig. 4B). Thus, the absence of detectable pilus expression by clinical M3 isolates and the dramatic increase in pilus expression in these isolates following the addition of plasmid pNra appear to be characteristic of serotype M3 GAS.
Nra positively regulates M3 GAS pilus expression at the transcriptional level.
To assess whether the regulation of pilus expression by Nra in M3 GAS occurs at the transcriptional or posttranscriptional level, we used quantitative RT-PCR analysis. Comparing four strain pairs harboring the empty vector or pNra, we identified that all pNra-containing derivatives showed enhanced abundances of mRNAs encoding the major pilus protein (tee3; mean increase, 26-fold) and a minor pilus protein (cpa; mean increase, 58-fold) (Fig. 4C). The abundances of msmR and fbaB mRNAs were unaffected, while nra mRNAs were present at levels an average of 199-fold higher than those in the empty-vector-containing strains, a finding which equates to a level of nra mRNA abundance in clinical M3 isolates ∼3-fold higher than that observed in clinical M49 isolates. In combination with the data in Fig. 3, our data are consistent with the lack of pilus expression by clinical serotype M3 isolates being a consequence of a low level of expression of Nra, a protein that positively regulates transcription of the pilus biosynthesis genes.
M3 and M18 GAS isolates harbor mutations within nra.
We next turned our attention to investigating why serotype M3 isolates transcribe nra at a level significantly lower than the levels at which M1 GAS isolates transcribe rofA and M49 GAS isolates transcribe nra. One possibility could be that Nra positively regulates its own expression and that the M3 nra allele produces an afunctional protein. To look at this, we compared the nra alleles from isolates of different GAS serotypes and identified that the M3 allele contains a serotype-specific single nucleotide polymorphism (SNP). The M3-specific nra SNP, identified in the sequenced M3 isolates MGAS315 and SSI-1 (39, 40), results in a nonsynonymous amino acid change (D267E) compared to the sequences of other nra alleles (Fig. 5A). We sequenced nra in seven additional M3 strains (Table S2), isolated in a temporally and geographically disparate fashion, and determined that the M3-specific nra mutation was present in them all. In the process of comparing nra alleles across serotypes, we also identified that the serotype M18 strain MGAS8232 harbors a premature stop codon in nra (Fig. 5A). Whether this mutation is encoded by the genomes of all serotype M18 GAS isolates and the regulatory consequences of this for pilus expression in M18 GAS are under investigation.
FIG 5.
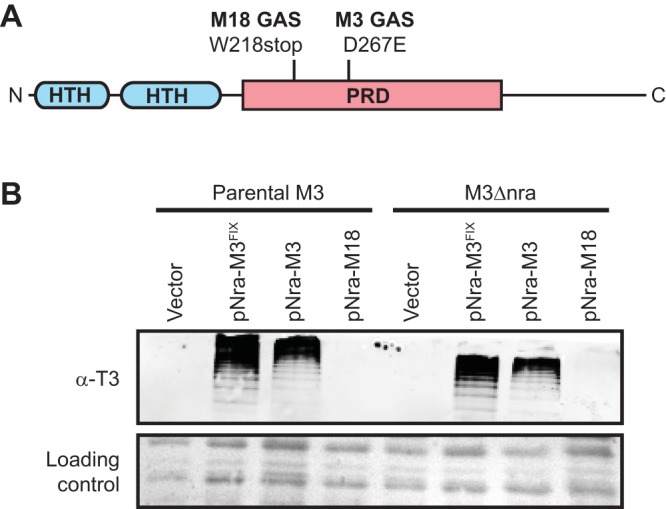
The M3 nra allele promotes pilus expression when expressed from a low-copy-number plasmid. (A) The 511-amino-acid Nra protein shares a domain architecture similar to that of other Mga-family members, with helix-turn-helix (HTH; blue) DNA-binding domains at their N termini, one or more centrally located phosphotransferase system regulatory domains (PRD; pink), and unstructured C termini. Highlighted are the locations of the M3 and M18 serotype-specific changes in the Nra protein, which are an aspartate-to-glutamate change or a truncation, respectively. (B) Western blot analysis. The parental M3 isolate (MGAS10870) and nra deletion mutant derivative (M3Δnra) were transformed with the empty vector or plasmids harboring the M3 nra allele (pNra-M3), a modified M3 nra allele in which the M3-specific SNP has been fixed (pNra-M3FIX), or the M18 nra allele (pNra-M18). Cell wall proteins were isolated from exponential-phase cultures and visualized by Western blotting using an anti-T3 antibody. The membrane was stained following protein transfer to serve as a loading control.
The M3 and M49 nra alleles, but not the M18 nra allele, enhance pilus expression in M3 GAS when overexpressed.
To test whether the M3 and M18 nra alleles produce functional proteins, we created plasmids pNra-M3 and pNra-M18, respectively. We also constructed a derivative of pNra-M3 in which the D267E mutation was fixed, plasmid pNra-M3FIX, to enable us to assay the effects of this polymorphism on Nra activity. All three plasmids were transformed into MGAS10870 and its derivative, M3Δnra, and the six strains, along with vector-containing derivatives, were evaluated for pilus expression by Western blotting. Similar to the vector-containing strains, the strains carrying pNra-M18 failed to express detectable levels of pili (Fig. 5B), consistent with the presence of a premature stop codon in the MGAS8232 nra gene, resulting in an inactive Nra protein. However, all strains containing either pNra-M3 or pNra-M3FIX expressed cell surface pili (Fig. 5B). As plasmid pNra-M3 induces pilus expression, the D267E mutation within the M3 GAS nra allele is not a null mutation. While it is not a null mutation, we observed a small but reproducible increase in pilus expression by strains containing pNra-M3FIX relative to those containing pNra-M3. This is consistent with the D267E mutation marginally reducing the activity of the Nra protein. Given that the difference in activity was only minor, this mutation cannot be the main factor behind the low level of nra transcription in M3 isolates. Further evidence that the D267E mutation somewhat reduces Nra activity but is not the critical reason why M3 isolates produce very low levels of pili was gained by chromosomally fixing the D267E mutation within the MGAS10870 nra gene. The resultant strain, M3nraFIXED, expressed very low but detectable levels of cell surface pili, in contrast to the parental strain (Fig. S1).
The low abundance of nra mRNA in serotype M3 GAS is not a consequence of an upstream VNTR.
Variable-number tandem repeats (VNTRs) are nucleotide repeat sequences that can increase or decrease in number, and when they are located within a promoter region, the number of repeats can influence gene transcription and/or mRNA translation. Indeed, it was recently shown that a VNTR upstream of rocA in GAS controls the translation of mRNA from this regulator-encoding gene (41). We identified a polynucleotide tract within the nra-cpa intergenic region that differed, in a serotype-specific manner, in the number of nucleotides that were present. In M3 GAS isolates there are eight A nucleotides, while in M49 GAS isolates there are seven (Fig. S2A). To assess whether this one-nucleotide difference could be behind the reduced levels of pilus expression in M3 GAS isolates, we created an MGAS10870 derivative in which we deleted an A nucleotide, to bring the number into line with that observed in M49 GAS isolates. Comparison of this derivative with the parental strain identified no difference in pilus expression (Fig. S2B), and hence, the VNTR does not seem to influence pilus expression.
CovR is a contributing factor in the serotype-specific regulation of pilus expression.
Previously, it was reported that mutation of covR, which encodes the response regulator component of the CovR/S two-component regulatory system, enhances pilus expression (42, 43). We investigated this in our representative serotype M1 (MGAS2221) and serotype M3 (MGAS10870) backgrounds. Through TaqMan-based qRT-PCR analysis, we identified that the covR mutation increased the abundance of nra, cpa, and tee3 transcripts in our M3 background (Fig. 6A) but did not alter the abundance of rofA, cpa, or tee1 transcripts in our M1 background (Fig. 6B). Western blot analysis of cell wall proteins determined that low but detectable levels of pili were observed in the strain M3ΔcovR background (Fig. 6C). Additionally, we determined that disruption of covS (strain M3ΔcovS) or introduction of a functional rocA gene (strain M3rocAFIXED) did not alter pilus expression, which, given that CovS and RocA enhance the abundance of phosphorylated CovR (7, 44), is consistent with nonphosphorylated CovR binding and repressing M3 GAS pilus expression. Our data show that CovR represses pilus expression in a serotype-specific manner and that while this contributes to the low level of pilus transcription in M3 isolates, it does not appear to be the major factor.
FIG 6.
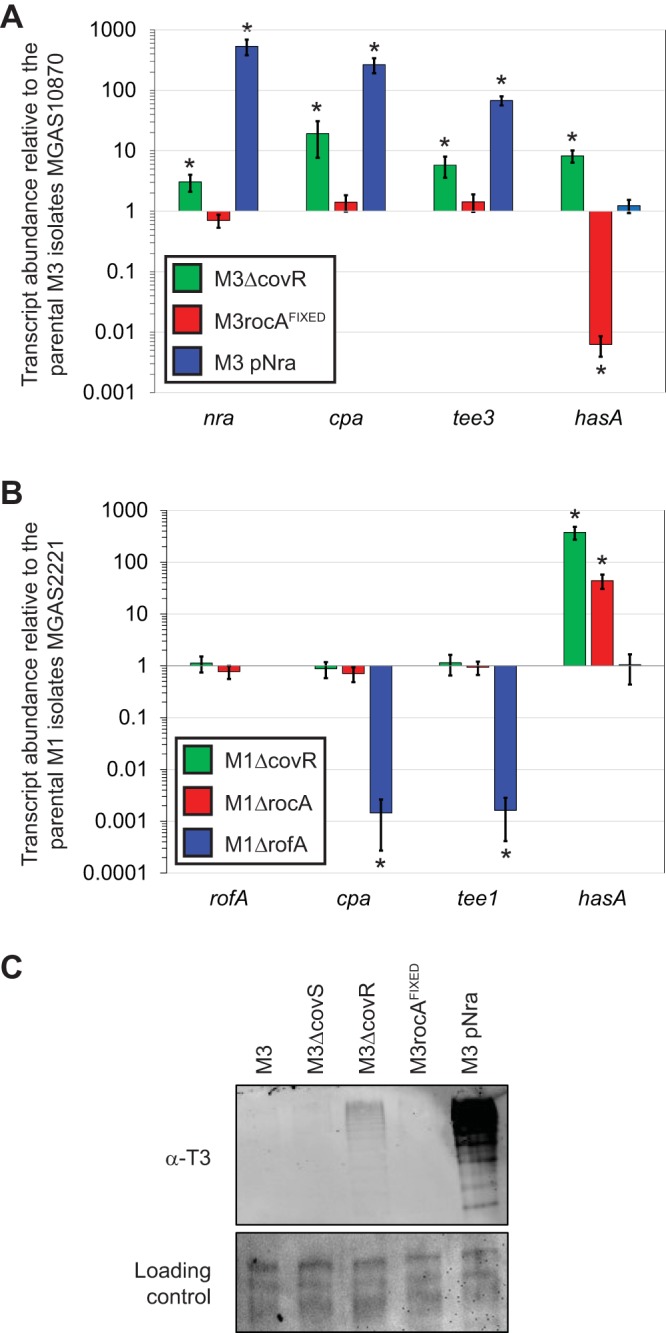
CovR represses pilus expression in serotype M3, but not M1, GAS. (A) TaqMan-based quantitative RT-PCR. The parental M3 isolate MGAS10870 and derivatives M3ΔcovR, M3rocAFIXED, and M3 pNra were grown to the exponential phase before they were harvested and analyzed via quantitative RT-PCR. Shown are the averages ± standard deviations for triplicate biological samples run in duplicate. *, statistically significant difference relative to the parental isolate (t test, P < 0.05). (B) As in panel A, except that parental M1 isolate MGAS2221 is compared to the derivatives M1ΔcovR, M1ΔrocA, and M1ΔrofA. (C) Western blot analysis. Cell wall proteins were isolated from the five indicated M3 GAS strains and analyzed by Western blotting with an anti-T3 antibody. The membrane was stained following protein transfer to serve as a loading control.
Relative to pilus-expressing derivatives, clinical M3 GAS isolates display a reduced ability to adhere to host cells.
Given that in isolates of other serotypes pili have been shown to promote the adherence of GAS to host cells (24, 45, 46), we hypothesized that M3 isolates would have reduced adherence capabilities relative to pilus-producing derivatives. To test this hypothesis, we used derivatives of MGAS10870, M3Δnra, and M3Δtee3 (a strain which does not produce pili due to the deletion of the tee3 gene, encoding the major pilus protein) containing either the empty vector or pNra in two tissue culture-based models of adherence. The data were similar for each of the models, which used VK2/E6E7 or HaCaT tissue culture cells, namely, that the expression of pili, due to the presence of pNra, increased adherence ∼2-fold over that for strains carrying only the empty vector (Fig. 7A and B). That this phenotype was a consequence of pilus expression was determined by the absence of any phenotype for pNra in the strain M3Δtee3 background. Thus, through the reduction in the level of pilus expression, clinical serotype M3 GAS isolates have a reduced adherence phenotype.
FIG 7.

Serotype M3 isolates have reduced rates of adherence as a consequence of low pilus expression. Tissue culture-based assay of adherence using HaCaT cells (a human keratinocyte line) (A) and VK2/E6E7 cells (a human epithelial cell line) (B). Derivatives of the parental M3 isolate MGAS10870, an nra deletion mutant (M3Δnra), and a tee3 deletion mutant (M3Δtee3; which does not produce pili) containing either the empty vector or pNra were assessed for their ability to adhere to lawns of tissue culture cells. The percentage of the inoculum that adhered was determined, and the data are displayed as the adherence level relative to that of the empty-vector-containing strains. The experiments were performed in triplicate, with mean values ± standard deviations being shown. Statistical significance was determined via the t test. n.s., not significant.
Clinical M3 GAS isolates have an increased ability to evade the innate immune system relative to pilus-expressing derivatives.
Published studies differ as to the influence of pili on the survival and proliferation of GAS in nonimmune whole human blood (25, 26, 33). A study with M1 GAS isolates identified that pili reduce survival (33), while studies with M2 and M53 GAS isolates identified that pili enhance survival (25, 26). To investigate this in the serotype M3 GAS background, we performed bactericidal assays. In agreement with the work performed in the M1 background (33), pilus expression through the presence of plasmid pNra reduced survival rates ∼2-fold in both the strain MGAS10870 and strain M3Δnra backgrounds but not in the strain M3Δtee3 background (Fig. 8). Thus, the low level of pilus expression observed for clinical M3 isolates enhances their ability to survive in human blood and likely contributes to the association of serotype M3 isolates with particularly severe invasive infections.
FIG 8.
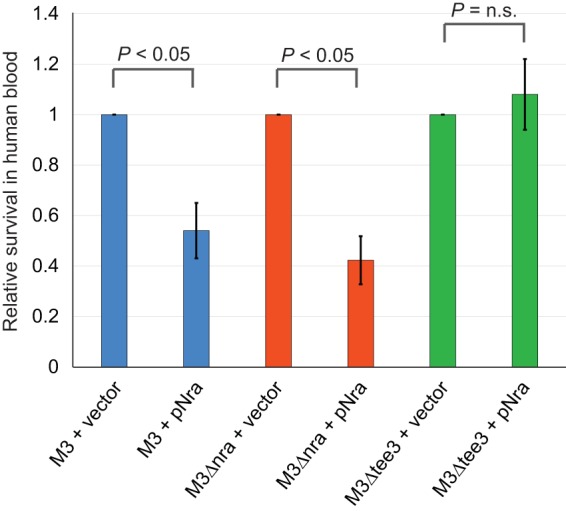
Serotype M3 isolates have an enhanced ability to survive in human blood as a consequence of low levels of pilus expression. The results of the Lancefield bactericidal assay are shown. The same six isolates described in Fig. 7 were assessed for their ability to survive and replicate in human blood. The survival of each isolate was determined, and the data are presented as the survival level relative to that observed for the respective empty-vector-containing isolates. The experiment was performed in triplicate, with mean values ± standard deviations being shown. Statistical significance was determined via the t test. n.s., not significant.
DISCUSSION
Bacterial intraspecies phenotypic variation can negatively impact public health by reducing the efficacy of diagnostic, treatment, and/or preventative measures (47–49). Thus, insights into the molecular mechanisms that drive this variation stand to benefit both basic science and clinical research. Here, we identified that GAS isolates show variation in the expression of pili on their cell surface. Specifically, unlike other GAS serotypes studied to date (e.g., serotypes M1, M2, M6, M28, M49, and M53), serotype M3 isolates produce no or very limited levels of pili, and hence, pilus expression occurs in a serotype-specific manner. In part, this finding was based upon data from our interserotype transcriptome comparison, which are the first data from such a comparison to be reported. We also identified that the regulatory protein Nra is a positive regulator of pilus expression in M3 GAS isolates, while MsmR has no regulatory effect on pilus expression, and that the low level of pilus production by M3 GAS isolates correlates with low nra transcript levels. Finally, we discovered that the phenotypic consequences of the low levels of pilus expression by M3 GAS isolates are a reduced ability to adhere to host cells and an increased ability to survive and proliferate in human blood.
We propose that the high level of M3 GAS survival in human blood, in part as a consequence of having reduced pilus expression, contributes to the association of M3 isolates with severe invasive infections. While a full explanation for why M3 isolates do not express significant levels of pili remains to be determined, our data are consistent with this being due to the attenuated transcription of nra, as nra transcript levels in M3 GAS are ∼177-fold lower than rofA transcript levels in M1 GAS and 60-fold lower than nra transcript levels in M49 GAS (Fig. 3). Possible reasons for the low nra transcript levels in M3 GAS isolates include the following: (i) an M3 GAS-specific repressor protein negatively regulates nra transcription, (ii) nra mRNA could be highly unstable, or (iii) the nra promoter in M3 GAS may be functionally different (it may be weaker or have an additional repressor binding site) from that in pilus-expressing strains (note that only 8 SNPs differentiate the 430-bp nra-cpa intergenic regions in M3 and M49 GAS isolates, and none obviously influence promoter strength; see Fig. S3A in the supplemental material). Ultimately, regardless of the mechanism behind the low nra transcript abundance in M3 GAS, this represents a serotype-specific difference in gene regulation. Thus, along with mutations in the regulator-encoding genes rivR, fasC, and rocA, the reduction in nra transcription influences virulence factor expression in M3 GAS, producing a serotype-specific virulence factor expression profile that we propose underpins the association of M3 isolates with particularly severe and lethal invasive infections.
The Fas regulatory system consists of the putative sensor kinases FasB and FasC, the putative response regulatory FasA, and the small regulatory RNA FasX (50). All three Fas proteins are required for the significant production of FasX, and hence, FasX is essentially absent from serotype M3 isolates due to the natural fasC mutation (17). Where investigated (serotype M1, M2, M6, and M28 GAS isolates), FasX posttranscriptionally enhances the expression of streptokinase and represses the expression of the adhesins PrtF1 and PrtF2 and pili (51, 52). Thus, prior to the work presented here we had expected M3 isolates to show enhanced, not reduced, pilus expression relative to isolates of other serotypes. As pilus expression reduces GAS survival in human blood, at least in the serotype M1 and M3 backgrounds, it is possible that the apparent reduction in nra transcript levels in M3 GAS was selected for to combat the increase in pilus expression due to the fasC mutation, thus maintaining a substantial ability to survive and proliferate in blood. However, the order in which these genetic events (fasC mutation and nra transcript reduction) occur has yet to be determined.
The key finding of this research, that serotype M3 GAS isolates produce only negligible amounts of pili on their cell surface, was unexpected, given the findings presented in three previously published collections of articles. First, studies described in two publications biochemically characterized the ability of the M3 GAS pilus proteins to form pili (53, 54). Importantly, however, the findings from these studies were primarily gained using protein extracts from Escherichia coli strains overexpressing the M3 GAS pilus proteins, and thus, an analysis of whether M3 isolates themselves actually express pili was not performed. Second, pilus expression by M3 GAS was investigated in a study looking into the regulatory role of environmental pH, and similar to the findings for most other serotypes, the investigators identified that a low pH (pH 6.4) increased the level of M3 GAS pilus expression (55). However, while a lower pH increased the level of pilus expression, no pili were produced in the sample at neutral pH, consistent with our data. Note that the regulators responsible for this pH-specific regulation of pilus expression are unknown, but recent data indicate that the LiaFSR proteins may contribute (56, 57). Third, T typing is a serology-based method for dividing GAS isolates into different types (T types), and the major pilus protein (Tee) is the T antigen. A study by Johnson et al. typed more than 2,000 serotype M3 isolates and found that ∼90% of them typed as T3 (the other 10% could not be typed) (58), which would indicate that most M3 isolates produce the Tee protein and therefore produce pili. However, several factors negatively affect the ability to T-type isolates; indeed, as stated by Johnson et al., “a strain with the very common T3 agglutination pattern may lose some, or even all, of the reactions making up that pattern depending on the intensity of trypsinization” (58). Trypsinization of the GAS protein samples prior to T typing is performed to reduce cross-reactivity to antibodies present in the T-typing sera that are not targeted toward the major pilus protein (pili are trypsin resistant) and, hence, would give false-positive results. The finding that extensive trypsinization can prevent the M3 GAS sample from typing as T3 would be consistent with the reacting antibodies in the typing sera being targeted against nonpilus proteins, in addition to pilus proteins. Indeed, we observed extensive cross-reactivity when using the T3 typing sera in our Western blot analyses, even in strains, such as M3Δtee3, that do not produce pili. Consistent with this, we found that some T-typing sera do not harbor any antibodies against pilus proteins (data not shown). Thus, we hypothesize that M3 isolates type as T3 primarily due to the reactivity of antibodies against nonpilus proteins in the sera, which would be consistent with the data presented here and the observation that extensive trypsinization prevents T typing of M3 isolates.
Building upon previous work showing that CovR represses pilus expression in serotype M3 GAS (42), we generated data consistent with CovR regulating pilus expression indirectly by repressing nra transcription and thus the abundance of the nra transcript (Fig. 6A). While CovR appears to repress pilus expression in a serotype-specific manner (Fig. 6B), this regulation does not appear to be the major factor behind the negligible pilus expression of clinical M3 isolates, as evident by the still low level of pilus expression seen by strain M3ΔcovR (Fig. 6C). Why CovR represses pilus expression in M3, but not M1, GAS is unclear. However, the nra-cpa intergenic region in M3 GAS and the rofA-cpa intergenic region in M1 GAS are highly divergent (Fig. S3B). We propose that CovR binds only to the M3 intergenic region.
The nine characterized FCT types are variable in gene content, gene order, and gene sequence (28). Thus, it is not surprising that there are differences in the regulation and function of pili from different FCT types. In addition to those already described (e.g., the expression of rofA or nra, or the production of pili that increase or decrease GAS resistance to human blood), there are also differences in the functioning of individual pilus proteins. For example, a recent report of a study working in a serotype M2 background (FCT-6) identified that the pilus backbone protein Tee2 is the adhesive (collagen-binding) component (25). This is in contrast to pili from the FCT-2 and FCT-3 regions, in which the ancillary protein Cpa is the adhesive component (34, 38). Given the regulatory and functional differences between pili from different FCT types and their different contributions to GAS virulence, the further study of pili from the different FCT types is warranted.
Despite decades of research, no licensed GAS vaccine is currently available. Perhaps the most advanced effort to date, a multivalent vaccine encompassing multiple M protein hypervariable regions, has yielded promising preliminary results (59). However, while an M protein-based vaccine may be of value, the large diversity of M types in the population prevents this approach from producing a universally protective vaccine. It has been identified that Tee, the pilus backbone protein, provides antigenic protection in murine models of infection (22). Thus, development of a vaccine based upon the targeting of pilus proteins, by themselves or in combination with other GAS proteins, is an area of interest (60, 61). While this approach, like the M protein-based approach, also suffers from differences in antigen sequence across GAS isolates, there is less complexity in the population (62). A potential problem unique to the creation of a pilus-based vaccine, however, is highlighted by the data generated in this study, namely, that isolates of at least one GAS serotype (serotype M3) do not express appreciable levels of pili on their cell surface, bringing into question the efficacy of such a vaccine against infections caused by this serotype. Thus, our data may inform vaccine development, and we are currently investigating whether a phenotype of low levels of pilus expression is shared by additional prevalent GAS serotypes.
MATERIALS AND METHODS
Bacterial strains and growth conditions.
The representative serotype M1 and M3 clinical GAS isolates MGAS2221 and MGAS10870, respectively, were the main strains used in this study. Additional GAS isolates and derivatives of the clinical isolates that we created are listed in Table S2 in the supplemental material. GAS isolates were grown in Todd-Hewitt broth containing 0.2% yeast extract (THY broth). Chloramphenicol (4 μg/ml), kanamycin (300 μg/ml), or spectinomycin (150 μg/ml) was added to the THY broth when needed.
Total RNA isolation and RNA-Seq analysis.
Total RNA was isolated as previously described (9). Briefly, triplicate cultures of the parental serotype M1 strain MGAS2221 and the parental serotype M3 GAS strain MGAS10870 were grown to the exponential phase of growth (corresponding to an optical density at 600 nm [OD600] of 0.5) in THY broth. One volume of GAS culture was subsequently added to 2 volumes of RNAprotect Bacteria reagent (Qiagen) and incubated at room temperature for 5 min. Following centrifugation at 5,000 × g for 10 min at 4°C, the bacterial pellets were snap-frozen in liquid nitrogen and stored at −80°C until they were ready for use. Bacterial cells were processed for RNA isolation using a mechanical lysis method in conjunction with an RNeasy minikit (Qiagen). Contaminating DNA was removed with three 40-min treatments with the Turbo DNase-free reagent (Life Technologies). The quality and quantity of the isolated RNA were assessed by using a Bioanalyzer 2100 system (Agilent Technologies). To process the RNA for RNA-Seq analysis, rRNAs were depleted using a Ribo-Zero gram-positive rRNA removal kit (Epicentre). The rRNA-depleted RNA was then used to generate cDNA libraries using a ScriptSeq kit (Epicentre) (63). To do this, RNA was fragmented, cDNA was synthesized using random hexamers containing a 5′ tagging sequence, the RNA was hydrolyzed, and the cDNA was tagged at the 3′ end. A limited number of PCR cycles (n = 12) was used to amplify the libraries via the 5′ and 3′ tags (the libraries were barcoded by using different primers), and the libraries were selected by size (170 to 300 bp). The size-selected and barcoded libraries were run on an Illumina MiSeq flow cell. Data were analyzed using the bioinformatic program Rockhopper (63). The M1 GAS data files were run against the MGAS5005 (a fully sequenced M1 GAS isolate [64]) genome sequence, while the M3 GAS data files were run against the MGAS315 (a fully sequenced M3 GAS isolate [39]) genome sequence. Sequencing data from different experiments were normalized using upper-quartile normalization (65). Orthologous genes between the two data sets were identified and tested for differential expression using the approach of DESeq (66), with correction for multiple tests (67).
Absolute quantification assays.
In order to compare the baseline levels of the expression of the transcripts encoding the regulatory proteins RofA and Nra, as well as those encoding the major (tee) and minor (cpa) pilus proteins, in M1, M3, and M49 GAS isolates, we performed a TaqMan-based absolute quantification assay. Ten M1, 19 M3, and 8 M49 clinical GAS isolates, recovered in a temporally and spatially diverse manner (Table S2), were grown in duplicate to mid-exponential phase (OD600, 0.5), total RNA was collected and treated twice with DNase (Turbo DNase; Ambion), and its integrity and concentration were evaluated with a Bioanalyzer instrument (model 2100; Agilent). cDNA was synthesized using a SuperScript III kit (Invitrogen) and analyzed by quantitative RT-PCR using a CFX Connect real-time system (Bio-Rad). Specifically, we compared the expression of target genes in these strains against a standard curve generated using 10-fold dilutions of MGAS2221 (M1), MGAS10870 (M3), or 591 (M49) genomic DNA, normalized to the genome size of the respective strains. The TaqMan primers and probes used for this assay are listed in Table S3.
Creation of plasmids pNra, pMsmR, pNra-M3, pNra-M3FIX, and pNra-M18.
Plasmids pNra, pNra-M3, and pNra-M18 were created by amplifying the nra genes (via primers UNR443 and UNR444; Table S3) from M49, M3, and M18 GAS genomes, respectively, and cloning them into the shuttle vector pDCBB, which is a derivative of pDC123 (68). Plasmid pMsmR was created by amplifying the msmR gene (via primers UNR441 and UNR442) from M49 GAS and cloning it into the vector pDCBB. Plasmid pNra-M3FIX was created by amplifying the nra gene from GAS strain M3nraFIXED using primers UNR443 and UNR444. The sequences of all plasmids were verified.
Creation of M3 GAS derivatives M3Δnra, M3ΔmsmR, M3nraFIXED, M3nraFIXEDΔmsmR, M3.VNTR, M3ΔcovR, and M3ΔcovS.
To facilitate the investigation of pilus expression in serotype M3 GAS isolates, we created derivatives of the representative M3 isolate MGAS10870. The PCR primers used to make these strains are listed in Table S3. Note that all constructed GAS strains were subjected to targeted PCR and sequencing to ensure that the expected DNA change(s) had occurred. Strains M3Δnra and M3ΔmsmR were created by replacing the nra and msmR genes, respectively, with a spectinomycin resistance cassette. Flanking sequences (∼1 kb in size) upstream and downstream of each gene were joined by overlap extension PCR to either side of the spectinomycin resistance cassette (1 kb), and the sequences were cloned into pCR2.1-TOPO (Thermo Fisher). After sequence verification, the 3-kb insert was PCR amplified and used to transform MGAS10870 competent cells, selecting on THY agar containing spectinomycin. Strain M3nraFIXED was created by an allelic exchange method, using the suicide vector pBBL740, similar to our previously described method (7). Briefly, primers UNR222/UNR224 and UNR96/UNR223 were used to amplify 1-kb regions of nra such that, when joined together via Gibson assembly, they generate a 2-kb product that contains the required DNA change. This product was cloned into pBBL740, also via Gibson assembly, and the sequence was verified. The plasmid was subsequently transformed into MGAS10870 competent cells, selecting on THY agar containing chloramphenicol (to ensure plasmid integration into the GAS chromosome). Transformants were passaged in THY broth (no antibiotics) to allow the excision of the plasmid out of the chromosome, and chloramphenicol-sensitive colonies were identified by patch plating onto both THY agar and THY agar containing chloramphenicol. Sensitive strains were subjected to targeted PCR and sequencing to identify whether they contained the parental or modified nra allele. One strain that harbored the modified allele was retained and named M3nraFIXED. Strain M3nraFIXEDΔmsmR is a derivative of M3nraFIXED in which msmR was replaced with the spectinomycin resistance cassette, as described above for strain M3ΔmsmR. Strain M3.VNTR was created by an allelic exchange method, using suicide vector pBBL740, similar to that described above for strain M3nraFIXED. The primers used to create the plasmid insert in this case were UNR619/UNR623 and UNR620/UNR625. Strain M3ΔcovS, which contains a 2-bp deletion within covS, was also created by allelic exchange, with the plasmid insert being created via overlap extension PCR using the PCR products generated with primers BBLCS1/BBLCS4 and BBLCS2/BBLCS3. Strain M3ΔcovR was created by replacement of an internal fragment of covR with a promoterless aphA3 gene encoding kanamycin resistance (amplified from strain JRS950 via primers COVUPUP and COVSR1) (69).
Isolation of cell wall proteins.
Bacterial cultures for all strains were grown to mid-exponential phase (OD600, 0.5) in THY broth. Forty-five-milliliter aliquots were recovered, and the bacteria were pelleted by centrifugation (5,000 × g, 11 min). The bacterial pellets were washed once in 10 ml of TE (Tris-EDTA) buffer and then resuspended in 900 μl of TE-sucrose buffer (50 mM Tris-HCl, pH 7.5, 550 mM sucrose, 1 mM EDTA, 250 μg ml−1 hyaluronidase, 1 mg ml−1 lysozyme, 250 μg ml−1 mutanolysin). Samples were incubated at 37°C with end-over-end rotation for 2 h and then centrifuged at 15,000 × g for 5 min in order to pellet the protoplasts. The supernatants, containing cell wall proteins, were removed to clean 1.5-ml tubes, and the centrifugation step was repeated. The final supernatants were buffered 1:1 with 2× Laemmli buffer and stored at −20°C until analysis.
Western blot analysis of cell wall proteins.
The cell wall protein fractions were separated on a 7.5% SDS-polyacrylamide gel and transferred to a nitrocellulose membrane, and the membrane was stained for use as a loading control using a MemCode reversible protein stain kit (Pierce). The same membrane was then subjected to overnight incubation with an anti-T3 monoclonal antibody (1:1,000 dilution; TransEurope Chemicals). The next day, the blot was washed thoroughly and then incubated with anti-rabbit IgG secondary antibody labeled with Alexa Fluor 680, and a Li-Cor Odyssey system was used to visualize and capture the fluorescent signal.
TaqMan-based quantitative RT-PCR analysis.
Total RNA was isolated for quantitative RT-PCR analysis of the pilus transcripts. All cultures were grown to mid-exponential phase (corresponding to an OD600 of 0.5), mechanically disrupted, and harvested for RNA using an RNeasy minikit (Qiagen). cDNA was synthesized using an Invitrogen SuperScript kit per the manufacturer's protocols. Through utilization of the CFX Connect real-time system (Bio-Rad), RT-PCR analysis was conducted with the primers and probes listed in Table S3.
Tissue culture adherence assay.
Cells of the human epithelial cell line VK2/E6E7 were cultured using keratinocyte serum-free medium (KSF; Gibco) containing 0.1 ng/ml human recombinant epidermal growth factor 1-53 (EGF 1-53) and 0.05 mg/ml bovine pituitary extract (BPE), calcium chloride at 44.1 mg/liter (final concentration, 0.4 mM), 50 μg/ml streptomycin, and 50 units/ml of penicillin. Upon nearing confluence, cells were resuspended in KSF medium without antibiotics, seeded into 12 wells of a 12-well tissue culture plate, and then incubated for 24 h at 37°C in a 5% CO2 atmosphere. Cells of the HaCaT (immortalized human keratinocyte) cell line were cultured using Dulbecco modified Eagle medium (DMEM; ATCC) containing 10% fetal bovine serum, 50 μg/ml streptomycin, and 50 units/ml of penicillin. Upon nearing confluence, the cells were resuspended in DMEM without antibiotics, seeded into 12 wells of a 12-well tissue culture plate, and then incubated for 24 h at 37°C in a 5% CO2 atmosphere. To prepare GAS isolates for this assay, the strains were grown to an OD600 of 0.4, 1 ml of culture was pelleted, and the cell pellets were resuspended in 1 ml of phosphate-buffered saline (PBS). One hundred microliters of each GAS solution was added to separate wells of the seeded 12-well tissue culture plates (VK2/E6E7 or HaCaT cells; resulting in a multiplicity of infection of ∼50). At the same time, 100 μl of the PBS-diluted GAS cultures (1:1,000,000) was plated onto blood agar plates to enable accurate calculation of the initial inocula. The plate was incubated for 5 min (37°C in 5% CO2). The liquid in the wells was removed, and the wells were washed five times with 1 ml of PBS. The tissue culture cells were lysed by incubating them for 15 min in 1% saponin in PBS at room temperature. The lysed tissue culture cells and adhered GAS cells were scraped from the bottom of each well. The lysate was serially diluted (1:100 and 1:1,000), and 100 μl of each dilution was plated onto blood agar plates in duplicate. The average number of bacteria was determined, and the percentage of adhering bacteria relative to the size of the inoculum was calculated.
Lancefield bactericidal assay.
To test the ability of individual GAS strains to survive in human blood, we performed Lancefield bactericidal assays. Cultures of each strain were grown to early exponential phase (OD600, 0.15 to 0.20). Each GAS culture was diluted to 10−4 in sterile phosphate-buffered saline, and 450 μl of whole heparinized blood was added to 50 μl dilute culture. These mixtures were then incubated for 3 h at 37°C with end-over-end rotation. Fifty microliters of each inoculum was simultaneously plated on blood agar plates to allow enumeration on the next day. Following incubation, the GAS-blood cultures were diluted and plated on blood agar plates. All samples were incubated overnight at 37°C in a 5% CO2 atmosphere. The number of CFU was calculated, and the data are presented as the rate of survival relative to that of the empty-vector-containing strains after performing the calculation [(number of surviving CFU/initial number of CFU) × 100].
Accession number(s).
The RNA-Seq data have been deposited at the Gene Expression Omnibus (GEO) database at the National Center for Biotechnology Information and are accessible through accession number GSE97935.
Supplementary Material
ACKNOWLEDGMENTS
This publication was made possible by grants from the National Institute of Allergy and Infectious Diseases (R03AI128290 to P.S.) and the National Institute of General Medical Sciences (R15GM102755 to B.T.; P20GM103440 to G.C.).
In addition, we thank Mick Hitchcock for his support of Jessica Danger, who is a Hitchcock Scholar.
Footnotes
Supplemental material for this article may be found at https://doi.org/10.1128/IAI.00792-17.
REFERENCES
- 1.Bolotin E, Hershberg R. 2015. Gene loss dominates as a source of genetic variation within clonal pathogenic bacterial species. Genome Biol Evol 7:2173–2187. doi: 10.1093/gbe/evv135. [DOI] [PMC free article] [PubMed] [Google Scholar]
- 2.Heithoff DM, Shimp WR, House JK, Xie Y, Weimer BC, Sinsheimer RL, Mahan MJ. 2012. Intraspecies variation in the emergence of hyperinfectious bacterial strains in nature. PLoS Pathog 8:e1002647. doi: 10.1371/journal.ppat.1002647. [DOI] [PMC free article] [PubMed] [Google Scholar]
- 3.Felgner S, Frahm M, Kocijancic D, Rohde M, Eckweiler D, Bielecka A, Bueno E, Cava F, Abraham WR, Curtiss R III, Haussler S, Erhardt M, Weiss S. 2016. aroA-deficient Salmonella enterica serovar Typhimurium is more than a metabolically attenuated mutant. mBio 7:e01220-. doi: 10.1128/mBio.01220-16. [DOI] [PMC free article] [PubMed] [Google Scholar]
- 4.Sahl JW, Sistrunk JR, Fraser CM, Hine E, Baby N, Begum Y, Luo Q, Sheikh A, Qadri F, Fleckenstein JM, Rasko DA. 2015. Examination of the enterotoxigenic Escherichia coli population structure during human infection. mBio 6:e00501-. doi: 10.1128/mBio.00501-15. [DOI] [PMC free article] [PubMed] [Google Scholar]
- 5.Cheung GY, Wang R, Khan BA, Sturdevant DE, Otto M. 2011. Role of the accessory gene regulator agr in community-associated methicillin-resistant Staphylococcus aureus pathogenesis. Infect Immun 79:1927–1935. doi: 10.1128/IAI.00046-11. [DOI] [PMC free article] [PubMed] [Google Scholar]
- 6.Uhlemann AC, Otto M, Lowy FD, DeLeo FR. 2014. Evolution of community- and healthcare-associated methicillin-resistant Staphylococcus aureus. Infect Genet Evol 21:563–574. doi: 10.1016/j.meegid.2013.04.030. [DOI] [PMC free article] [PubMed] [Google Scholar]
- 7.Miller EW, Danger JL, Ramalinga AB, Horstmann N, Shelburne SA, Sumby P. 2015. Regulatory rewiring confers serotype-specific hyper-virulence in the human pathogen group A Streptococcus. Mol Microbiol 98:473–489. doi: 10.1111/mmi.13136. [DOI] [PMC free article] [PubMed] [Google Scholar]
- 8.Sarkar P, Sumby P. 2017. Regulatory gene mutation: a driving force behind group A Streptococcus strain- and serotype-specific variation. Mol Microbiol 103:576–589. doi: 10.1111/mmi.13584. [DOI] [PMC free article] [PubMed] [Google Scholar]
- 9.Sumby P, Whitney AR, Graviss EA, DeLeo FR, Musser JM. 2006. Genome-wide analysis of group A streptococci reveals a mutation that modulates global phenotype and disease specificity. PLoS Pathog 2:e5. doi: 10.1371/journal.ppat.0020005. [DOI] [PMC free article] [PubMed] [Google Scholar]
- 10.Cunningham MW. 2008. Pathogenesis of group A streptococcal infections and their sequelae. Adv Exp Med Biol 609:29–42. doi: 10.1007/978-0-387-73960-1_3. [DOI] [PubMed] [Google Scholar]
- 11.Olsen RJ, Musser JM. 2010. Molecular pathogenesis of necrotizing fasciitis. Annu Rev Pathol 5:1–31. doi: 10.1146/annurev-pathol-121808-102135. [DOI] [PubMed] [Google Scholar]
- 12.Carapetis JR, Beaton A, Cunningham MW, Guilherme L, Karthikeyan G, Mayosi BM, Sable C, Steer A, Wilson N, Wyber R, Zuhlke L. 2016. Acute rheumatic fever and rheumatic heart disease. Nat Rev Dis Primers 2:15084. doi: 10.1038/nrdp.2015.84. [DOI] [PMC free article] [PubMed] [Google Scholar]
- 13.VanDeVoorde RG., III 2015. Acute poststreptococcal glomerulonephritis: the most common acute glomerulonephritis. Pediatr Rev 36:3–12. doi: 10.1542/pir.36-1-3. [DOI] [PubMed] [Google Scholar]
- 14.Steer AC, Law I, Matatolu L, Beall BW, Carapetis JR. 2009. Global emm type distribution of group A streptococci: systematic review and implications for vaccine development. Lancet Infect Dis 9:611–616. doi: 10.1016/S1473-3099(09)70178-1. [DOI] [PubMed] [Google Scholar]
- 15.Meisal R, Hoiby EA, Caugant DA, Musser JM. 2010. Molecular characteristics of pharyngeal and invasive emm3 Streptococcus pyogenes strains from Norway, 1988-2003. Eur J Clin Microbiol Infect Dis 29:31–43. doi: 10.1007/s10096-009-0814-5. [DOI] [PubMed] [Google Scholar]
- 16.Cunningham MW. 2014. Rheumatic fever revisited. Nat Rev Cardiol 11:123. doi: 10.1038/nrcardio.2012.197-c1. [DOI] [PMC free article] [PubMed] [Google Scholar]
- 17.Cao TN, Liu Z, Cao TH, Pflughoeft KJ, Trevino J, Danger JL, Beres SB, Musser JM, Sumby P. 2014. Natural disruption of two regulatory networks in serotype M3 group A Streptococcus isolates contributes to the virulence factor profile of this hypervirulent serotype. Infect Immun 82:1744–1754. doi: 10.1128/IAI.01639-13. [DOI] [PMC free article] [PubMed] [Google Scholar]
- 18.Lynskey NN, Turner CE, Heng LS, Sriskandan S. 2015. A truncation in the regulator RocA underlies heightened capsule expression in serotype M3 group A streptococci. Infect Immun 83:1732–1733. doi: 10.1128/IAI.02892-14. [DOI] [PMC free article] [PubMed] [Google Scholar]
- 19.Ramirez-Pena E, Trevino J, Liu Z, Perez N, Sumby P. 2010. The group A Streptococcus small regulatory RNA FasX enhances streptokinase activity by increasing the stability of the ska mRNA transcript. Mol Microbiol 78:1332–1347. doi: 10.1111/j.1365-2958.2010.07427.x. [DOI] [PMC free article] [PubMed] [Google Scholar]
- 20.Pearce WA, Buchanan TM. 1978. Attachment role of gonococcal pili. Optimum conditions and quantitation of adherence of isolated pili to human cells in vitro. J Clin Invest 61:931–943. [DOI] [PMC free article] [PubMed] [Google Scholar]
- 21.Proft T, Baker EN. 2009. Pili in Gram-negative and Gram-positive bacteria—structure, assembly and their role in disease. Cell Mol Life Sci 66:613–635. doi: 10.1007/s00018-008-8477-4. [DOI] [PMC free article] [PubMed] [Google Scholar]
- 22.Mora M, Bensi G, Capo S, Falugi F, Zingaretti C, Manetti AG, Maggi T, Taddei AR, Grandi G, Telford JL. 2005. Group A Streptococcus produce pilus-like structures containing protective antigens and Lancefield T antigens. Proc Natl Acad Sci U S A 102:15641–15646. doi: 10.1073/pnas.0507808102. [DOI] [PMC free article] [PubMed] [Google Scholar]
- 23.Koller T, Manetti AG, Kreikemeyer B, Lembke C, Margarit I, Grandi G, Podbielski A. 2010. Typing of the pilus-protein-encoding FCT region and biofilm formation as novel parameters in epidemiological investigations of Streptococcus pyogenes isolates from various infection sites. J Med Microbiol 59:442–452. doi: 10.1099/jmm.0.013581-0. [DOI] [PubMed] [Google Scholar]
- 24.Manetti AG, Zingaretti C, Falugi F, Capo S, Bombaci M, Bagnoli F, Gambellini G, Bensi G, Mora M, Edwards AM, Musser JM, Graviss EA, Telford JL, Grandi G, Margarit I. 2007. Streptococcus pyogenes pili promote pharyngeal cell adhesion and biofilm formation. Mol Microbiol 64:968–983. doi: 10.1111/j.1365-2958.2007.05704.x. [DOI] [PubMed] [Google Scholar]
- 25.Tsai JC, Loh JM, Clow F, Lorenz N, Proft T. 2017. The group A Streptococcus serotype M2 pilus plays a role in host cell adhesion and immune evasion. Mol Microbiol 103:282–298. doi: 10.1111/mmi.13556. [DOI] [PubMed] [Google Scholar]
- 26.Rouchon CN, Ly AT, Noto JP, Luo F, Lizano S, Bessen DE. 2017. Incremental contributions of FbaA and other impetigo-associated surface proteins to fitness and virulence of a classical group A streptococcal skin strain. Infect Immun 85:e00374-. doi: 10.1128/IAI.00374-17. [DOI] [PMC free article] [PubMed] [Google Scholar]
- 27.Bessen DE. 2002. Genomic localization of a T serotype locus to a recombinatorial zone encoding extracellular matrix-binding proteins in Streptococcus pyogenes. Infect Immun 70:1159–1167. doi: 10.1128/IAI.70.3.1159-1167.2002. [DOI] [PMC free article] [PubMed] [Google Scholar]
- 28.Kratovac Z, Manoharan A, Luo F, Lizano S, Bessen DE. 2007. Population genetics and linkage analysis of loci within the FCT region of Streptococcus pyogenes. J Bacteriol 189:1299–1310. doi: 10.1128/JB.01301-06. [DOI] [PMC free article] [PubMed] [Google Scholar]
- 29.Lizano S, Luo F, Tengra FK, Bessen DE. 2008. Impact of orthologous gene replacement on the circuitry governing pilus gene transcription in streptococci. PLoS One 3:e3450. doi: 10.1371/journal.pone.0003450. [DOI] [PMC free article] [PubMed] [Google Scholar]
- 30.Podbielski A, Woischnik M, Leonard BA, Schmidt KH. 1999. Characterization of nra, a global negative regulator gene in group A streptococci. Mol Microbiol 31:1051–1064. doi: 10.1046/j.1365-2958.1999.01241.x. [DOI] [PubMed] [Google Scholar]
- 31.Luo F, Lizano S, Bessen DE. 2008. Heterogeneity in the polarity of Nra regulatory effects on streptococcal pilus gene transcription and virulence. Infect Immun 76:2490–2497. doi: 10.1128/IAI.01567-07. [DOI] [PMC free article] [PubMed] [Google Scholar]
- 32.Nakata M, Podbielski A, Kreikemeyer B. 2005. MsmR, a specific positive regulator of the Streptococcus pyogenes FCT pathogenicity region and cytolysin-mediated translocation system genes. Mol Microbiol 57:786–803. doi: 10.1111/j.1365-2958.2005.04730.x. [DOI] [PubMed] [Google Scholar]
- 33.Crotty Alexander LE, Maisey HC, Timmer AM, Rooijakkers SH, Gallo RL, von Kockritz-Blickwede M, Nizet V. 2010. M1T1 group A streptococcal pili promote epithelial colonization but diminish systemic virulence through neutrophil extracellular entrapment. J Mol Med (Berl) 88:371–381. doi: 10.1007/s00109-009-0566-9. [DOI] [PMC free article] [PubMed] [Google Scholar]
- 34.Kreikemeyer B, Nakata M, Oehmcke S, Gschwendtner C, Normann J, Podbielski A. 2005. Streptococcus pyogenes collagen type I-binding Cpa surface protein. Expression profile, binding characteristics, biological functions, and potential clinical impact. J Biol Chem 280:33228–33239. [DOI] [PubMed] [Google Scholar]
- 35.Johnson DR, Stevens DL, Kaplan EL. 1992. Epidemiologic analysis of group A streptococcal serotypes associated with severe systemic infections, rheumatic fever, or uncomplicated pharyngitis. J Infect Dis 166:374–382. doi: 10.1093/infdis/166.2.374. [DOI] [PubMed] [Google Scholar]
- 36.Beres SB, Carroll RK, Shea PR, Sitkiewicz I, Martinez-Gutierrez JC, Low DE, McGeer A, Willey BM, Green K, Tyrrell GJ, Goldman TD, Feldgarden M, Birren BW, Fofanov Y, Boos J, Wheaton WD, Honisch C, Musser JM. 2010. Molecular complexity of successive bacterial epidemics deconvoluted by comparative pathogenomics. Proc Natl Acad Sci U S A 107:4371–4376. doi: 10.1073/pnas.0911295107. [DOI] [PMC free article] [PubMed] [Google Scholar]
- 37.Nasser W, Beres SB, Olsen RJ, Dean MA, Rice KA, Long SW, Kristinsson KG, Gottfredsson M, Vuopio J, Raisanen K, Caugant DA, Steinbakk M, Low DE, McGeer A, Darenberg J, Henriques-Normark B, Van Beneden CA, Hoffmann S, Musser JM. 2014. Evolutionary pathway to increased virulence and epidemic group A Streptococcus disease derived from 3,615 genome sequences. Proc Natl Acad Sci U S A 111:E1768–E1776. doi: 10.1073/pnas.1403138111. [DOI] [PMC free article] [PubMed] [Google Scholar]
- 38.Nakata M, Koller T, Moritz K, Ribardo D, Jonas L, McIver KS, Sumitomo T, Terao Y, Kawabata S, Podbielski A, Kreikemeyer B. 2009. Mode of expression and functional characterization of FCT-3 pilus region-encoded proteins in Streptococcus pyogenes serotype M49. Infect Immun 77:32–44. doi: 10.1128/IAI.00772-08. [DOI] [PMC free article] [PubMed] [Google Scholar]
- 39.Beres SB, Sylva GL, Barbian KD, Lei B, Hoff JS, Mammarella ND, Liu MY, Smoot JC, Porcella SF, Parkins LD, Campbell DS, Smith TM, McCormick JK, Leung DY, Schlievert PM, Musser JM. 2002. Genome sequence of a serotype M3 strain of group A Streptococcus: phage-encoded toxins, the high-virulence phenotype, and clone emergence. Proc Natl Acad Sci U S A 99:10078–10083. doi: 10.1073/pnas.152298499. [DOI] [PMC free article] [PubMed] [Google Scholar]
- 40.Nakagawa I, Kurokawa K, Yamashita A, Nakata M, Tomiyasu Y, Okahashi N, Kawabata S, Yamazaki K, Shiba T, Yasunaga T, Hayashi H, Hattori M, Hamada S. 2003. Genome sequence of an M3 strain of Streptococcus pyogenes reveals a large-scale genomic rearrangement in invasive strains and new insights into phage evolution. Genome Res 13:1042–1055. doi: 10.1101/gr.1096703. [DOI] [PMC free article] [PubMed] [Google Scholar]
- 41.Zhu L, Olsen RJ, Horstmann N, Shelburne SA, Fan J, Hu Y, Musser JM. 2016. Intergenic variable-number tandem-repeat polymorphism upstream of rocA alters toxin production and enhances virulence in Streptococcus pyogenes. Infect Immun 84:2086–2093. doi: 10.1128/IAI.00258-16. [DOI] [PMC free article] [PubMed] [Google Scholar]
- 42.Horstmann N, Sahasrabhojane P, Suber B, Kumaraswami M, Olsen RJ, Flores A, Musser JM, Brennan RG, Shelburne SA III. 2011. Distinct single amino acid replacements in the control of virulence regulator protein differentially impact streptococcal pathogenesis. PLoS Pathog 7:e1002311. doi: 10.1371/journal.ppat.1002311. [DOI] [PMC free article] [PubMed] [Google Scholar]
- 43.Kreth J, Chen Z, Ferretti J, Malke H. 2011. Counteractive balancing of transcriptome expression involving CodY and CovRS in Streptococcus pyogenes. J Bacteriol 193:4153–4165. doi: 10.1128/JB.00061-11. [DOI] [PMC free article] [PubMed] [Google Scholar]
- 44.Horstmann N, Sahasrabhojane P, Saldana M, Ajami NJ, Flores AR, Sumby P, Liu CG, Yao H, Su X, Thompson E, Shelburne SA. 2015. Characterization of the effect of the histidine kinase CovS on response regulator phosphorylation in group A Streptococcus. Infect Immun 83:1068–1077. doi: 10.1128/IAI.02659-14. [DOI] [PMC free article] [PubMed] [Google Scholar]
- 45.Abbot EL, Smith WD, Siou GP, Chiriboga C, Smith RJ, Wilson JA, Hirst BH, Kehoe MA. 2007. Pili mediate specific adhesion of Streptococcus pyogenes to human tonsil and skin. Cell Microbiol 9:1822–1833. doi: 10.1111/j.1462-5822.2007.00918.x. [DOI] [PubMed] [Google Scholar]
- 46.Lizano S, Luo F, Bessen DE. 2007. Role of streptococcal T antigens in superficial skin infection. J Bacteriol 189:1426–1434. doi: 10.1128/JB.01179-06. [DOI] [PMC free article] [PubMed] [Google Scholar]
- 47.Aracil B, Slack M, Perez-Vazquez M, Roman F, Ramsay M, Campos J. 2006. Molecular epidemiology of Haemophilus influenzae type b causing vaccine failures in the United Kingdom. J Clin Microbiol 44:1645–1649. doi: 10.1128/JCM.44.5.1645-1649.2006. [DOI] [PMC free article] [PubMed] [Google Scholar]
- 48.Croucher NJ, Harris SR, Fraser C, Quail MA, Burton J, van der Linden M, McGee L, von Gottberg A, Song JH, Ko KS, Pichon B, Baker S, Parry CM, Lambertsen LM, Shahinas D, Pillai DR, Mitchell TJ, Dougan G, Tomasz A, Klugman KP, Parkhill J, Hanage WP, Bentley SD. 2011. Rapid pneumococcal evolution in response to clinical interventions. Science 331:430–434. doi: 10.1126/science.1198545. [DOI] [PMC free article] [PubMed] [Google Scholar]
- 49.Tientcheu LD, Koch A, Ndengane M, Andoseh G, Kampmann B, Wilkinson RJ. 2017. Immunological consequences of strain variation within the Mycobacterium tuberculosis complex. Eur J Immunol 47:432–445. doi: 10.1002/eji.201646562. [DOI] [PMC free article] [PubMed] [Google Scholar]
- 50.Kreikemeyer B, Boyle MD, Buttaro BA, Heinemann M, Podbielski A. 2001. Group A streptococcal growth phase-associated virulence factor regulation by a novel operon (Fas) with homologies to two-component-type regulators requires a small RNA molecule. Mol Microbiol 39:392–406. doi: 10.1046/j.1365-2958.2001.02226.x. [DOI] [PubMed] [Google Scholar]
- 51.Danger JL, Makthal N, Kumaraswami M, Sumby P. 2015. The FasX small regulatory RNA negatively regulates the expression of two fibronectin-binding proteins in group A Streptococcus. J Bacteriol 197:3720–3730. doi: 10.1128/JB.00530-15. [DOI] [PMC free article] [PubMed] [Google Scholar]
- 52.Danger JL, Cao TN, Cao TH, Sarkar P, Trevino J, Pflughoeft KJ, Sumby P. 2015. The small regulatory RNA FasX enhances group A Streptococcus virulence and inhibits pilus expression via serotype-specific targets. Mol Microbiol 96:249–262. doi: 10.1111/mmi.12935. [DOI] [PMC free article] [PubMed] [Google Scholar]
- 53.Quigley BR, Zahner D, Hatkoff M, Thanassi DG, Scott JR. 2009. Linkage of T3 and Cpa pilins in the Streptococcus pyogenes M3 pilus. Mol Microbiol 72:1379–1394. doi: 10.1111/j.1365-2958.2009.06727.x. [DOI] [PubMed] [Google Scholar]
- 54.Zahner D, Scott JR. 2008. SipA is required for pilus formation in Streptococcus pyogenes serotype M3. J Bacteriol 190:527–535. doi: 10.1128/JB.01520-07. [DOI] [PMC free article] [PubMed] [Google Scholar]
- 55.Manetti AG, Koller T, Becherelli M, Buccato S, Kreikemeyer B, Podbielski A, Grandi G, Margarit I. 2010. Environmental acidification drives S. pyogenes pilus expression and microcolony formation on epithelial cells in a FCT-dependent manner. PLoS One 5:e13864. doi: 10.1371/journal.pone.0013864. [DOI] [PMC free article] [PubMed] [Google Scholar]
- 56.Isaka M, Tatsuno I, Maeyama J, Matsui H, Zhang Y, Hasegawa T. 2016. The YvqE two-component system controls biofilm formation and acid production in Streptococcus pyogenes. APMIS 124:574–585. doi: 10.1111/apm.12538. [DOI] [PubMed] [Google Scholar]
- 57.Flores AR, Olsen RJ, Cantu C, Pallister KB, Guerra FE, Voyich JM, Musser JM. 2017. Increased pilus production conferred by a naturally occurring mutation alters host-pathogen interaction in favor of carriage in Streptococcus pyogenes. Infect Immun 85:e00949-. doi: 10.1128/IAI.00949-16. [DOI] [PMC free article] [PubMed] [Google Scholar]
- 58.Johnson DR, Kaplan EL, VanGheem A, Facklam RR, Beall B. 2006. Characterization of group A streptococci (Streptococcus pyogenes): correlation of M-protein and emm-gene type with T-protein agglutination pattern and serum opacity factor. J Med Microbiol 55:157–164. doi: 10.1099/jmm.0.46224-0. [DOI] [PubMed] [Google Scholar]
- 59.Dale JB, Penfound TA, Tamboura B, Sow SO, Nataro JP, Tapia M, Kotloff KL. 2013. Potential coverage of a multivalent M protein-based group A streptococcal vaccine. Vaccine 31:1576–1581. doi: 10.1016/j.vaccine.2013.01.019. [DOI] [PMC free article] [PubMed] [Google Scholar]
- 60.Steemson JD, Moreland NJ, Williamson D, Morgan J, Carter PE, Proft T. 2014. Survey of the bp/tee genes from clinical group A streptococcus isolates in New Zealand—implications for vaccine development. J Med Microbiol 63:1670–1678. doi: 10.1099/jmm.0.080804-0. [DOI] [PubMed] [Google Scholar]
- 61.Young PG, Moreland NJ, Loh JM, Bell A, Atatoa Carr P, Proft T, Baker EN. 2014. Structural conservation, variability, and immunogenicity of the T6 backbone pilin of serotype M6 Streptococcus pyogenes. Infect Immun 82:2949–2957. doi: 10.1128/IAI.01706-14. [DOI] [PMC free article] [PubMed] [Google Scholar]
- 62.Falugi F, Zingaretti C, Pinto V, Mariani M, Amodeo L, Manetti AG, Capo S, Musser JM, Orefici G, Margarit I, Telford JL, Grandi G, Mora M. 2008. Sequence variation in group A Streptococcus pili and association of pilus backbone types with Lancefield T serotypes. J Infect Dis 198:1834–1841. doi: 10.1086/593176. [DOI] [PubMed] [Google Scholar]
- 63.McClure R, Balasubramanian D, Sun Y, Bobrovskyy M, Sumby P, Genco CA, Vanderpool CK, Tjaden B. 2013. Computational analysis of bacterial RNA-Seq data. Nucleic Acids Res 41:e140. doi: 10.1093/nar/gkt444. [DOI] [PMC free article] [PubMed] [Google Scholar]
- 64.Sumby P, Porcella SF, Madrigal AG, Barbian KD, Virtaneva K, Ricklefs SM, Sturdevant DE, Graham MR, Vuopio-Varkila J, Hoe NP, Musser JM. 2005. Evolutionary origin and emergence of a highly successful clone of serotype M1 group A Streptococcus involved multiple horizontal gene transfer events. J Infect Dis 192:771–782. doi: 10.1086/432514. [DOI] [PubMed] [Google Scholar]
- 65.Bullard JH, Purdom E, Hansen KD, Dudoit S. 2010. Evaluation of statistical methods for normalization and differential expression in mRNA-Seq experiments. BMC Bioinformatics 11:94. doi: 10.1186/1471-2105-11-94. [DOI] [PMC free article] [PubMed] [Google Scholar]
- 66.Anders S, Huber W. 2010. Differential expression analysis for sequence count data. Genome Biol 11:R106. doi: 10.1186/gb-2010-11-10-r106. [DOI] [PMC free article] [PubMed] [Google Scholar]
- 67.Benjamini Y, Hochberg Y. 1995. Controlling the false discovery rate: a practical and powerful approach to multiple testing. J R Stat Soc Series B Stat Methodol 57:289–300. [Google Scholar]
- 68.Chaffin DO, Rubens CE. 1998. Blue/white screening of recombinant plasmids in Gram-positive bacteria by interruption of alkaline phosphatase gene (phoZ) expression. Gene 219:91–99. doi: 10.1016/S0378-1119(98)00396-5. [DOI] [PubMed] [Google Scholar]
- 69.Federle MJ, McIver KS, Scott JR. 1999. A response regulator that represses transcription of several virulence operons in the group A streptococcus. J Bacteriol 181:3649–3657. [DOI] [PMC free article] [PubMed] [Google Scholar]
Associated Data
This section collects any data citations, data availability statements, or supplementary materials included in this article.