Abstract
Atypical DNA secondary structures play an important role in expandable trinucleotide repeat (TR) and hexanucleotide repeat (HR) diseases. The cytosine mismatches in C-rich homoduplexes and hairpin stems are weakly bonded; experiments show that for certain sequences these may flip out of the helix core, forming an unusual structure termed an ‘e-motif’. We have performed molecular dynamics simulations of C-rich TR and HR DNA homoduplexes in order to characterize the conformations, stability and dynamics of formation of the e-motif, where the mismatched cytosines symmetrically flip out in the minor groove, pointing their base moieties towards the 5′-direction in each strand. TRs have two non-equivalent reading frames, (GCC)n and (CCG)n; while HRs have three: (CCCGGC)n, (CGGCCC)n, (CCCCGG)n. We define three types of pseudo basepair steps related to the mismatches and show that the e-motif is only stable in (GCC)n and (CCCGGC)n homoduplexes due to the favorable stacking of pseudo GpC steps (whose nature depends on whether TRs or HRs are involved) and the formation of hydrogen bonds between the mismatched cytosine at position i and the cytosine (TRs) or guanine (HRs) at position i − 2 along the same strand. We also characterize the extended e-motif, where all mismatched cytosines are extruded, their extra-helical stacking additionally stabilizing the homoduplexes.
INTRODUCTION
Atypical DNA secondary structures have been identified as a common and causative factor for expansion in trinucleotide and hexanucleotide repeat sequences that underlie approximately 30 DNA expandable simple sequence repeat (SSR) diseases (1–3). SSRs exhibit ‘dynamic mutations’ that do not follow Mendelian inheritance: intergenerational expansion of SSRs is behind inherited neurodegenerative and neuromuscular disorders known as ‘anticipation diseases’, where the age of the onset of the disease decreases and its severity increases with each successive generation (4–10). After a certain threshold in the length of the repeated sequence, the probability of further expansion and the severity of the disease increase with the length of the repeat. The expansion is believed to be primarily caused by some sort of slippage during DNA replication, repair, recombination or transcription (2,3,7–15), that involves transient separation of complementary DNA strands or exposure of a single DNA strand. This, in turn, can lead to the formation of hairpins and other secondary structures in the exposed strand. Cell toxicity and death have been linked to the atypical conformation and functional changes of the RNA transcripts, of DNA itself (3,16) and, when TRs are present in exons, of the translated proteins (3,17–26).
In particular, sequences of the form d(CGG)·d(CCG) are overexpressed in the exons of the human genome: CGG SSRs are found in the 5′-untranslated region (5′-UTR) of the fragile X mental retardation gene (FMR1) (27), while CCGs are found both in the 5′-UTR and translated regions of more than one gene. The normal range of the CGG SSRs in the population is 5-54, with the last ten repeats increasing the probability of disease in descendants (28,29). SSRs of 55–200 CGGs constitute premutations associated with fragile X-associated tremor ataxia syndrome (FXTAS) in males (30) and premature ovarian failure in females (31). SSRs longer than 200 CGG cause the inherited fragile X mental retardation syndrome (32). CCG SSRs are related to three SSR diseases: the longest expansion occurs in the FRM2 gene giving rise to chromosome X-linked mental retardation (FRAXE) (33), and they also seem to play a role in Huntington’s disease (34), and myotonic dystrophy type 1 (35). More recently, it has been found that a d(GGGGCC)·d(GGCCCC) SSR in the first intron of the C9ORF72 gene leads to a hexanucleotide repeat expansion identified as the major cause behind frontotemporal dementia (FTD) and amyotrophic lateral sclerosis (ALS) (36,37). While the unaffected population carries <20 repeats (generally no more than a couple), large expansions greater than 70 repeats and usually encompassing 250–1600 repeats have been found in C9FTD and ALS patients.
In this work, we are interested in the C-rich repeat sequences. In order to understand the mechanisms underlying sequence expansion, gene hypermethylation, and folate-induced chromosomal fragile sites, it is crucial to elucidate the secondary structure adopted by the C-rich sequences d(CCG)n of various repeat length n. These sequences attracted considerable interest over 20 years ago, when it was found that the homoduplexes d(CCG)·d(CCG) (i.e. duplexes formed by the same CCG SSR strands) exhibited an unusual DNA secondary structure termed the ‘e-motif’ (38,39). This motif was seen in a solution NMR DNA antiparallel duplex where each strand consisted of two repeats, 5′-(CCG)2-3′ (PDB ID 1NOQ). In this helical duplex, the slipping of the strands leaves the two 5′-C terminal unpaired, and a single central C·C mismatch surrounded by two Watson-Crick pairs. The central mismatch gave rise to the ‘e-motif’, where the C bases in the mismatch symmetrically flip out in the minor groove, pointing their base moieties towards the 5′ direction in each strand.
Remarkably, since the initial publication of the NMR DNA 5′-(CCG)2-3′duplex results in 1995, there has been no other direct structural observation of the e-motif, reflecting the difficulty of experimental observation of flexible DNA duplexes, made probably more labile by the presence of the mismatches. However, there has been indirect observations that support the presence of e-motifs in DNA homoduplexes and hairpins of various lengths. The two most important results in this direction were obtained by chemical modification of the bases followed by subsequent cleavage (40,41). These studies also provided indirect evidence to the proposition that d(GCC)n homoduplexes or hairpin stems exhibit an extended e-motif formed by consecutive extrahelical C·C mismatches. Finally, notice that the GCC alignment in these duplexes is different from the CCG alignment in the NMR DNA duplex. However, since the short strands slip with respect to each other in the two-repeat duplex, the NMR structure also exhibits CpG steps between the Watson–Crick pairs.
In this work we present results from molecular dynamics simulations that provide a detailed structural and dynamical characterization of the e-motif. We first encountered an e-motif in our study of the hexanucleotide repeats behind ALS and C9FTD diseases (42). Here, we extend this study and add the C-rich trinucleotide repeats in order to determine which sequences give rise to the e-motif, how stable they are, and what are the transistion mechanisms which transform the internal C·C mismatch to an e-motif.
MATERIALS AND METHODS
Molecular dynamics (MD)
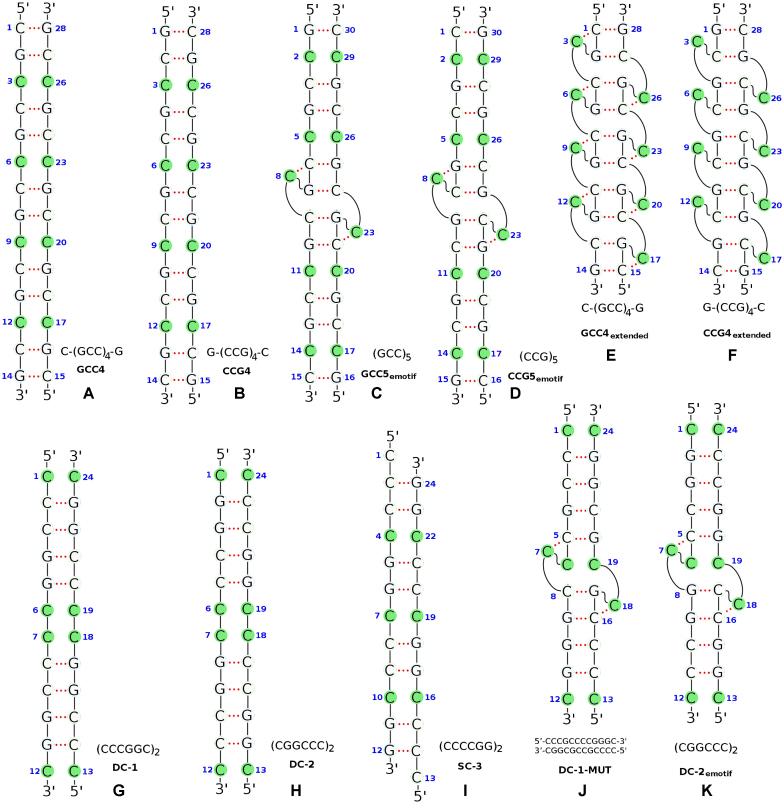
The sequences employed in this work are shown in Figure 1. The simulations were carried out using the PMEMD module of the AMBER v.16 (43) software package with force fields ff99 BSC1 (44), ff99 BSC0 (45) and OL15 (46) used in different cases. A summary of the sequences and force fields used is presented in Table 1. All the C·C mismatches are initially chosen in the anti-anti conformation, which represents the minimum free energy conformation of the mismatches in the phase space mapped out by the torsion angle conformations.
Figure 1.
Schematics of the initial DNA helical duplexes considered in this study. The C mismatched bases are marked by solid green circles. Nucleotide indexes are labeled by blue numbers. Hydrogen bonds are indicated by dashed red lines. More details about the duplexes and the corresponding simulation results are provided in Table 1.
Table 1. Summary of molecular dynamics simulation results for the different DNA helical duplexes considered.
| Label | Sequence | Initial E-motif | Force Field | Time (ns) | E-motif Status |
|---|---|---|---|---|---|
| GCC4 | C-(GCC)4-G | No | BSC0, BSC1 | 1000 | e-motif formation at 600 ns in BSC0 |
| CCG4 | G-(CCG)4-C | No | BSC0, BSC1 | 1000 | No e-motif transition |
| DC-1 | (CCCGGC)2 | No | BSC0, BSC1, OL15 | 1000 | e-motif formation at 300 ns in BSC0 |
| DC-2 | (CGGCCC)2 | No | BSC0, BSC1, OL15 | 1000 | No e-motif transition |
| SC-3 | (CCCCGG)2, slipped | No | BSC0 | 1000 | No e-motif transition |
| GCC5emotif | (GCC)5 | Yes | BSC0, BSC1, OL15 | 1000 | Stable |
| CCG5emotif | (CCG)5 | Yes | BSC0, BSC1, OL15 | 1000 | Mismatches become intra-helical for BSC1 & OL15; e-motif in BSC0 loses H-bonds |
| GCC4extended | C-(GCC)4-G | Yes, extended e-motif | BSC0, BSC1, OL15 | 2000 | Stable extended e-motif for all three force fields |
| CCG4extended | C-(GCC)4-G | Yes, extended e-motif | BSC0, BSC1, OL15 | 2000 | Unstable e-motif for BSC1 and OL15; RMSD around e-motif increases for BSC0 |
| DC-1-MUT | 5′(CCCGCCCCGGGC)3′ 3′(CGGCGCCGCCCC)5′ | Yes | BSC0, BSC1, OL15 | 1200 | e-motif lost at 250 ns in BSC0, at 170 ns in BSC1, at 35 ns in OL15 |
| DC-2emotif | (CGGCCC)2 | Yes | BSC0, BSC1, OL15 | 1200 | e-motif lost at 350 ns in BSC0, at 60 ns in BSC1, at 32 ns in OL15 |
The TIP3P model (47) was used for the water molecules, along with the standard parameters for ions in the AMBER force fields (48). The long-range Coulomb interaction was evaluated by means of the Particle-Mesh Ewald (PME) method (49) with a 9 Å cutoff and an Ewald coefficient of 0.30768. Similarly, the van der Waals interaction were calculated by means of a 9 Å atom-based nonbonded list, with a continuous correction applied to the long-range part. The production runs for MD were generated using the leap-frog algorithm with a 2 fs timestep with Langevin dynamics with a collision frequency of 1 ps−1. Conformations were saved every picosecond. The SHAKE algorithm was applied to all bonds involving hydrogen atoms. Regular MD was run for all sequences, for times that vary between 1 and 2 μs. For completion, we discuss results related to hexanucleotides repeats DC-1, DC-2 and SC-3, previously presented in Ref. (42), which are revisited in order to find the common denominator behind the e-motif formation. These simulations are extended in the present work in order to include DC-1-MUT, and DC-2emotif as specified in Table 1. DC-1-MUT is obtained from sequence DC-1 by mutating bases G5, G16 to C’s and bases C9, C20 to G’s. These changes enable one to probe the stability of e-motif structures in DC-1 HRs when the mismatched cytosines form hydrogen bonds between C’s rather than G’s. In addition, the DC-1-MUT and DC-2emotif structures were constructed with an initial e-motif as shown in Figure 1.
RESULTS
The duplexes considered in this study are shown in Figure 1, and the main features of each duplex simulation are listed in Table 1. An important issue when considering possible SSR conformations is the nature of the Watson-Crick pairs that surround the mismatches: sequences of the form 5′-(CCG)n-3′ and 5′-(GCC)n-3′ (without slipping such that strand ends are paired) exhibit Watson-Crick base pairs with GpC and CpG steps, respectively. In order to facilitate the discussion of our results, we have labeled the standard steps as L = GpC=GC/GC, M = CpG=CG/CG and N = GG/CC; and defined three classes of pseudo steps, as listed in Table 2. With this notation, the step patterns, before and after e-motif formation, are given in Table 3. In the following we present our main results.
Table 2. Steps and pseudo steps exhibited by the homoduplexes with mismatches.
| Nomenclature | Description |
|---|---|
| L = GpC=GC/GC | Standard basepair step |
| M = CpG=CG/CG | |
| N = GG/CC=CC/GG | |
| LC = GC/CC=CC/GC | Pseudo GpC step L containing intrahelical C mismatches |
| MC = CG/CC=CC/CG | Pseudo CpG step M containing intrahelical C mismatches |
| W = CC/CC | Pseudo step containing two intrahelical C mismatches |
| LL = GC//GC MM = CG//CG | Pseudo steps where the two basepairs of the step are simply stacked on top of each other but not covalently linked along the backbone (because C’s have been extruded) |
| LLC = GC//CC=CC//GC MMC = CG//CC=CC//CG | Pseudo steps like LC and MC, but the G–C or C–G basepairs are not covalently linked to the C intrahelical mismatches (because one of the two C–C mismatches has been extruded) |
Table 3. Step changes for different DNA homoduplexes before and after e-motif formation.

|
Spontaneous formation of e-motif in regular molecular dynamics
We carried out regular, unconstrained MD simulations for sequences GCC4 and CCG4 shown in Figure 1A and B with force fields BSC0 and BSC1 for 1 μs. Two initial conformations were chosen: ideal A-DNA and ideal B-DNA. For each force field, the two initial conformations quickly converge. For the GCC4 sequence (but not for CCG4), spontaneous formation of an e-motif occurs in the BSC0 force field. With respect to the hexanucleotides, we previously presented results corresponding to two sets of 1 μs regular MD with the BSC0 force field for the sequences DC-1, DC-2, SC-3, Figure 1G–I. The DC-1 CCCGGC sequence showed spontaneous formation of the e-motif. These transitions are shown in Movie S1 for GCC4 (residues 10th to 14th, and complementary) where the e-motif forms at approximately 600 ns, and Movie S2 for CCCGGC in DC-1 (residues 4th to 9th, and complementary) where the e-motif forms around 300 ns and is stable for the remaining 700 ns of the simulation.
Description and characterization of the e-motif
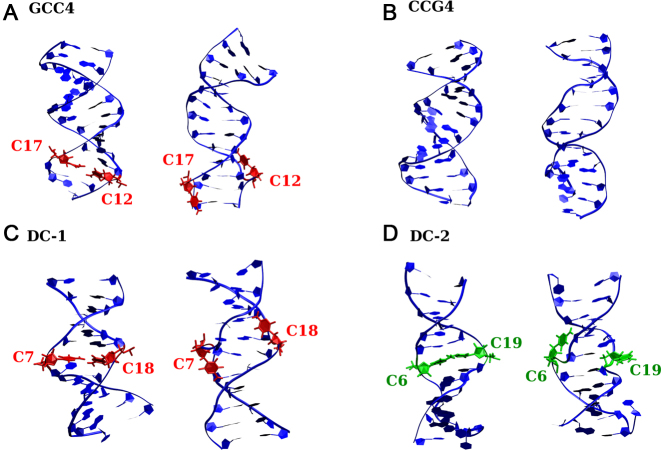
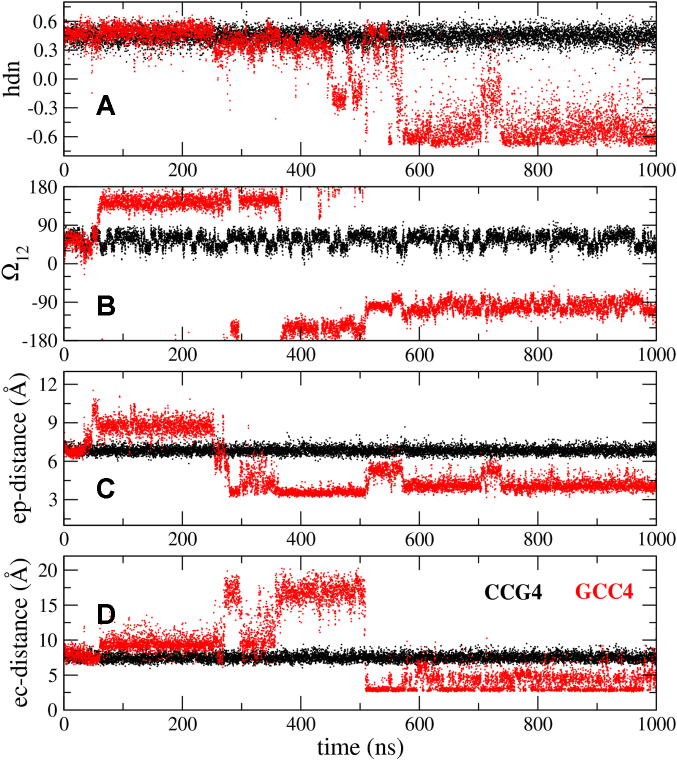
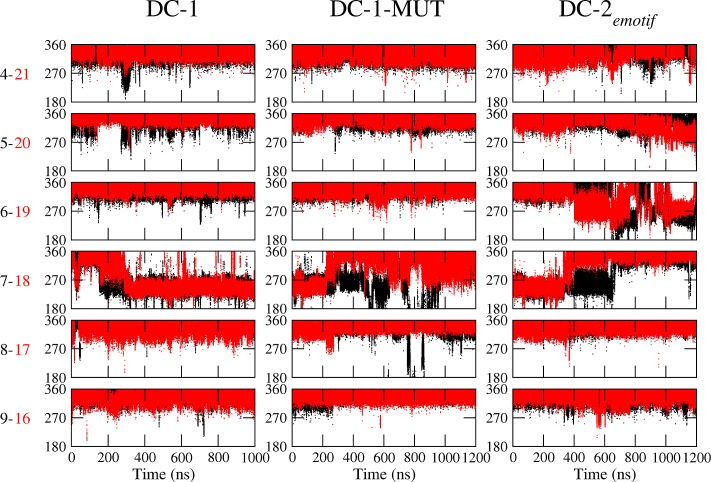
In the e-motif, the C bases (i residue) in a mismatch symmetrically flip out in the minor groove, pointing their base moieties in the direction of the i − 2 residue (i.e. toward the 5′ direction in each strand). Figure 2 shows initial and late conformations for GCC4 and DC-1, which form an e-motif, and CCG4 and DC-2, which do not form an e-motif. Several quantities can be defined to clearly describe the transition from an intra-helical C–C mismatch to an e-motif. In Figure 3 we show some of these quantities for the formation of an e-motif in GCC4 (compared to CCG4, which does not exhibit an e-motif). In the figure we can see clear transitions for the mismatch in GCC4, involving some intermediate transition states, between well defined initial and final average values. Shown are the partial handedness (50) of the C12–C17 mismatch (from 0.5 to –0.5); the pseudodihedral angle (Ω12) that describes the base unstacking of C12 with respect to the helical axis (51) (from ∼60° to ∼−100°); the center-of-mass distance (ep-distance) between basepairs adjacent to the mismatch, in this case basepairs 11–16 and 13–18 (from 7 to 4 Å); and the ‘e-motif distance’ (ec-distance), defined as the distance between the N4 atom of C12 and the O2 atom of C10 in GCC4 or the N3 atom of G10 in CCG4 (from 7.5 Å to 4 Å). Since the spontaneous transition did not happen in the BSC1 and OL15 force fields in this time scale, the values of these quantities stay consistently near the initial values, as shown for instance in Supplementary Figures S1 and S2. In our work with the hexanucleotides (42), we showed that the backbone torsion angles α and γ (that normally display an anticorrelation such that their sum stays constant) behave such that α + γ corresponding to a mismatched base decreases approximately by 100° when the base flips into the minor groove. Thus, intrahelical C mismatches have α + γ ≃ 340° while C mismatches flipped out into the minor groove have α + γ ≃ 240°, as shown in Figures 5 and 8. Hydrogen bonding for the e-motif is discussed below.
Figure 2.
Initial (left) and final (right) structures for (A) GCC4, (B) CCG4, (C) DC-1 and (D) DC-2 structures obtained from the molecular dynamics simulations. The bases in the C·C mismatches that form an e-motif are shown in red. Those flipped out of the inner helix but not forming an e-motif are shown in green.
Figure 3.
Time dependence of quantities characterizing the transition to an e-motif. Results for duplexes CCG4 and GCC4 are shown in black and red, respectively. (A) Partial handedness of the C12–C17 mismatch; (B) pseudodihedral angle (Ω12) describing the base unstacking of C12 with respect to the helical axis; (C) center-of-mass distance (ep-distance) between basepairs 11–16 and 13–18; (D) ‘e-motif distance’ (ec-distance), defined as the distance between the N4 atom of C12 and the O2 atom of C10 in GCC4 or the N3 atom of G10 in CCG4.
Figure 5.
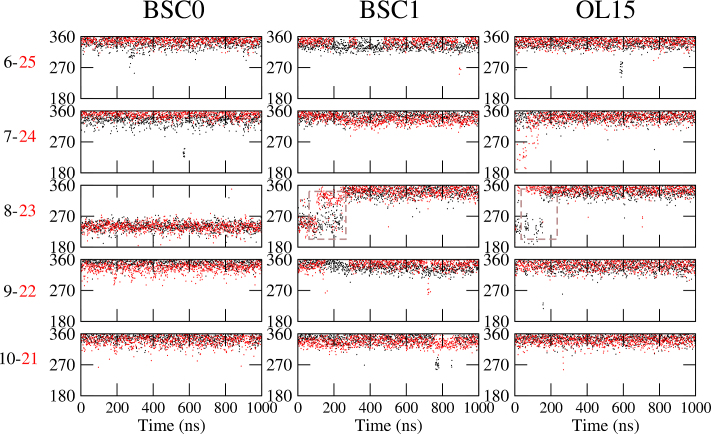
Backbone torsion angles (α + γ) for trinucleotide repeats. Sum of torsion angles (α + γ) for bases 6–10 (black) and 21–25 (red) as a function of time for CCG5emotif as obtained from the different force fields. The rectangle with dashed lines indicates the transition in BSC1 and OL15.
Figure 8.
Backbone torsion angles (α + γ) for hexanucleotide repeats. Sum of torsion angles (α + γ) for bases 4–6 (black) and 16–21 (red) as a function of time for DC-1 (left), DC-1-MUT (middle) and DC-2emotif (right).
The e-motif is stable under the three force fields
Since the time scale for the spontaneous formation of the e-motif under the force fields BSC1 and OL15 can potentially be rather large, we decided to check the stability of an initial, built-in e-motif. Thus, we have built a (GCC)5 duplex with an internal e-motif Figure 1C and checked for stability. Results for GCC5emotif under the three force fields are shown in Supplementary Figures S3 and S4 in the SI. Supplementary Figure S3 shows the RMSD of the middle 14 residues around the e-motif (R5-R11 and R20-R26), while Supplementary Figure S4 shows the RMSD of the bases participating in the pseudo GpC step (bases G7, C9, G22 and C24). Up to 1 μs, the e-motif is stable in the three force fields; the only change occurs in BSC0 where there are fluctuations in the e-motif in the interval 200–300 ns, after which the e-motif stabilizes again. One final observation: the e-motif in our simulations is stable for four and five trinucleotide repeats. The NMR study showed that two repeats can also form an e-motif, so we additionally ran 1 μs simulations of a single trinucleotide surrounded by one G–C Watson–Crick base pair at the end. For the single trinucleotide, the e-motif unraveled in our simulations.
A single e-motif is partially stabilized by the formation of hydrogen bonds between the C bases (i residue) in a mismatch and the i − 2 bases: these are C bases in the case of (GCC), and G bases in the case of (CCCGGC) in DC-1
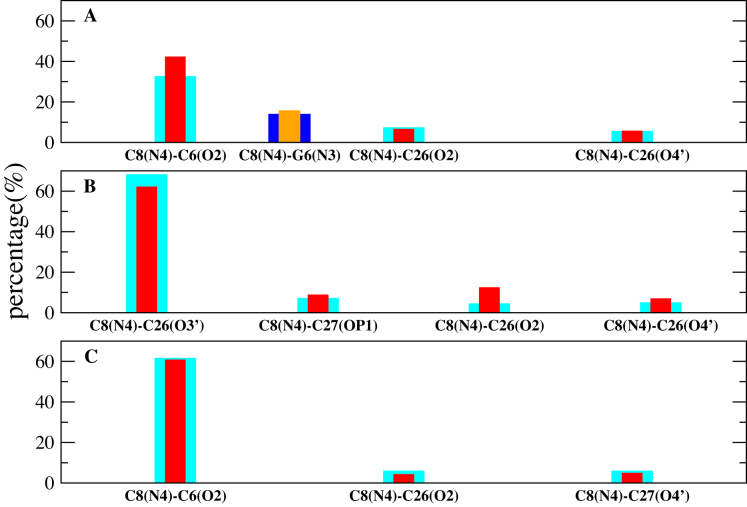
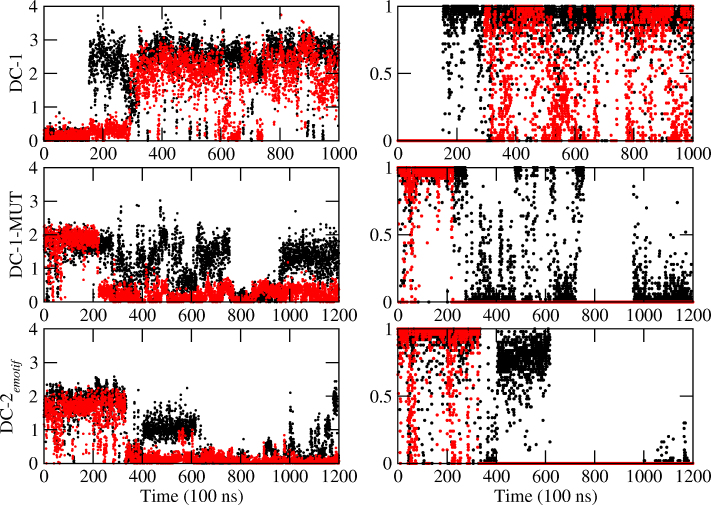
A hydrogen bond analysis for the e-motif in GCC5emotif and CCG5emotif is shown in Figure 4. The most important hydrogen bonds stabilizing the extruded bases in GCC5emotif are C8(N4)–C6(O2) and its equivalent C23(N4)–C21(O2) for both BSC0 and OL15; and C8(N4)–C26(O3′) and its equivalent C23(N4)–C11(O3′) for BSC1, which—unlike the previous bond—represents hydrogen bonding across strands. We notice that in the experimental NMR duplex (PDB ID 1NOQ) the hydrogen bonds are of the type C8(N4)-C6(O2) and its equivalent C23(N4)-C21(O2), validating the results for BSC0 and OL15. For CCG5emotif the only hydrogen bonds that have any measurable presence are C8(N4)–G6(N3) and its equivalent on the other strand, C23(N4)–G21(N3). Now we turn to the hexanucleotides. Figure 7 shows the time evolution of the number of hydrogen bonds for the hexanucleotides. The top panel shows the data for DC-1, where the initial mismatches are all intra-helical. Before 100 ns, the mismatch C7-C18 is still intrahelical. After the flipping out of the mismatched bases C7 and C18 into the minor groove is completed, C7 forms hydrogen bonds with G5 and C18 does so with G16. Of these bonds, the most important are C7(N4)-G5(N3) and its equivalent on the other strand, C18(N4)–G16(N3).
Figure 4.
Hydrogen bond population for 1 μs simulation of GCC5emotif as obtained form the three force fields: (A) BSC0; (B) BSC1; (C) OL15. The x-axis indicates the hydrogen bond, while the y-axis gives its percentage over the duration of the simulation. Cyan color shows the percentage of the hydrogen bond on one strand and the red color shows the symmetric bond on the other strand. Blue and orange bars show hydrogen bonds for CCG5emotif.
Figure 7.
For hexanucleotide repeats, number of hydrogen bonds between mismatched bases at position i and nucleotides along the same strand at position i − 2. Left: Number of total hydrogen bonds between C7 and nucleotide 5 (black); and C18 and nucleotide 16 (red). Right: Number of most important hydrogen bonds, in black: C7(N4)–G5(N3) for DC-1; C7(N4)–C5(O2) for DC-1-MUT and DC-2emotif; and between equivalent positions in the other strand (C18 and G16 or C16) in red. Data is averaged every 250 ps.
The e-motif occurs in paired-end homoduplexes of (GCC) and (CCCGGC) SSRs, but not in the other reading frames
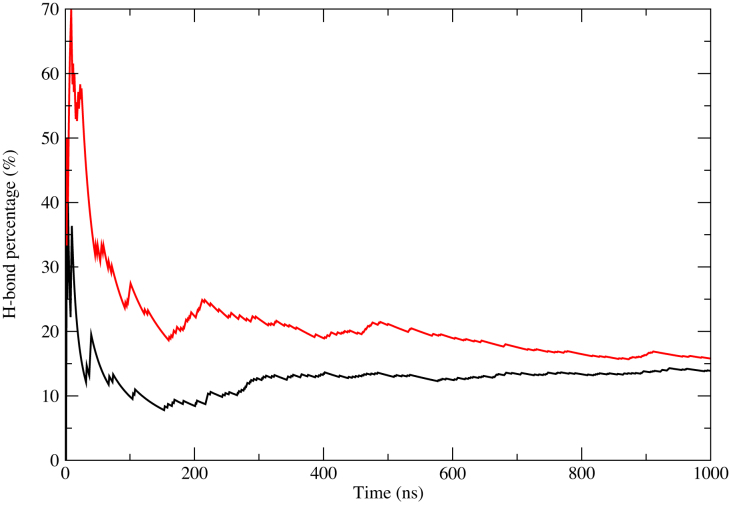
First, we discuss the trinucleotide repeat results. For none of the three force fields did the CCG4 duplexes spontaneously formed an e-motif. To further check the stability of the e-motif in CCG sequences, we built a (CCG)5 duplex with an internal e-motif Figure 1D and probed its stability. Results for the CCG5emotif under the three force fields are shown in Supplementary Figures S5 and S6 in the SI. Supplementary Figure S5 shows the RMSD of the middle 14 residues around the e-motif (R5-R11 and R20-R26), while Supplementary Figure S6 shows the RMSD of the bases participating in the pseudo CpG step (bases C7, G9, C22 and G24). The e-motif quickly unravels and the mismatched C bases become intrahelical for both BSC1 and OL15. This transition is shown in Movie S3 (residues 6th to 10th, and complementary) for force field BSC1. The transition for these two force fields can be identified by the sum of the backbone torsion angles α + γ, as shown in Figure 5 which goes from ≃240° to ≃340° as the mismatched bases become intrahelical. For BSC0 the mismatched bases continue being extrahelical in the 1 μs of the simulation, but their characteristic hydrogen bond pattern decays with time as shown in Figure 6.
Figure 6.
Hydrogen bond population versus time for CCG5emotif as obtained from BSC0 simulations. Black: C8(N4)–G6(N3); red: C23(N4)–G21(N3).
Now we turn to the hexanucleotides. In previous work (42), we showed that the sequence in DC-1 led to the formation of an e-motif, that forms around 300 ns and is stable for the remaining 700 ns of the simulation. By contrast, sequences in DC-2 and SC-3 did not form an e-motif. In DC-2, the bases of a mismatch alternate between the minor and major grooves, while SC-3 is unstable and either unfolds or converts to the more stable DC-1 duplex. To dispel the possibility that DC-2 may not have formed an e-motif because the simulation was not long enough, we have extended this work by choosing as initial conformation for DC-2 one with an e-motif. A movie showing the time evolution of this duplex is shown in Movie S4. The initial e-motif unravels at different times for each of the force fields (Table 1), lasting longer for BSC0, where it is stable for about 350 ns. However after that, the bases turn back into the helix. They also push the bases in the flanking mismatch into the major and minor grooves occasionally, but none of the mismatches formed an e-motif again. In fact, the dynamical configurations are the same as those observed for DC-2 in our previous work. Finally, the time evolution of the mutated case in DC-1-MUT (which does not belong to any SSR) is shown in Movie S5. The initial e-motif also unravels at different times for each of the force fields (Table 1), lasting longer for BSC0, where it is stable for about 250 ns, but then the bases turn towards the inner helix, with the base C7 flipping in and out of the helix, and affecting with its motion the base C6 in the flanking mismatch. The unraveling of the e-motif is quantified in the middle and bottom panels of Figure 7 and in Figure 8, and in Figure 10. In Figure 7, duplex DC-1 starts with no e-motif but forms one at mismatch C7-C18 at about 300 ns. Both DC-1-MUT and DC-2emotif start with an e-motif at C7–C18 and hydrogen bonds between mismatched bases at position i and those at i − 2, i.e. C7–C5 and C18–C16, which disappear as the system evolves. Figure 8 shows the α + γ jump of 100° as the e-motif is formed in DC-1 (negative jump), and as the initial e-motif disappears in DC-1-MUT and DC-2emotif (positive jump).
Figure 10.
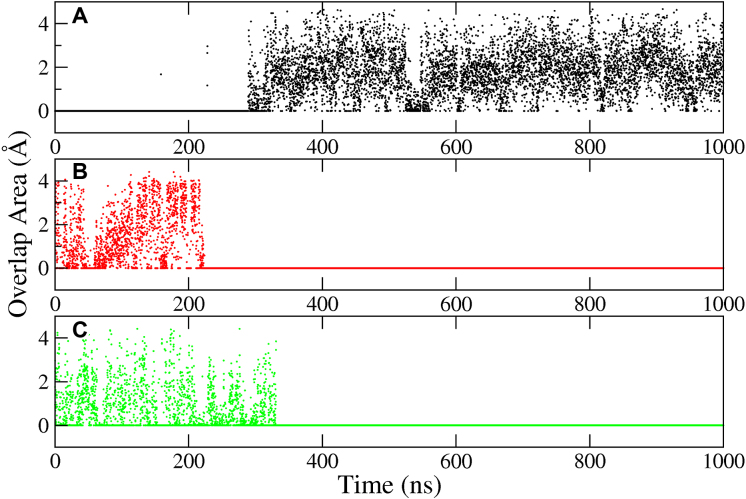
Overlap areas of the basepair ring atoms of pseudo steps in hexanucleotides. Specifically, bases 6 and 8; and 17 and 19 in Figure 1G, J, K are considered. Here, we show results for (A) pseudo GpC step LLC in DC-1; (B) pseudo GpC step LLC in DC-1-MUT; (C) pseudo CpG step MMC in DC-2emotif.
Creation of the e-motif is favored by the formation of pseudo GpC steps when the bases in the C·C mismatches are extruded
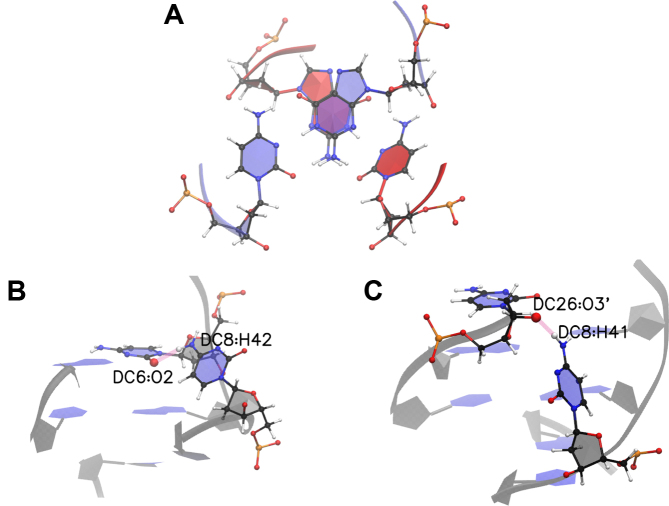
Figure 9 shows the G–G stacking that occurs in a pseudo GpC step after the C mismatches have been extruded (LL in our notation) in a GCC sequence, whose consequence is a better overall stacking of the helix. This fact explains why in homoduplexes with paired ends, the e-motif occurs in GCC sequences (formation of LL steps after extrusion) but not in CCG sequences (formation of MM steps after extrusion). Supplementary Figure S7 shows the overlap areas of the basepair ring atoms of the pseudo GpC step for for GCC5emotif; the distribution functions have a peak at around 2.6 Å2. For the hexanucleotide repeats, the step nature becomes slightly more complicated. In DC-1, the extrusion of the bases in an e-motif leads to a pseudo GpC (LLC) step, such that the new step pattern around the intra-helical mismatch (the one that was not extruded) is N-LC–LLC-N. By contrast, flipping of the bases of the C7–C18 mismatch in DC-2 results in a pseudo CpG (MMC) step, such that the new step pattern around the intra-helical mismatch is N-MC–MMC-N, and therefore the e-motif is not favored. Supplementary Figure S8 shows the overlapping for steps LLC and MMC for DC-1 and DC-2 respectively, for an almost perfect e-motif in C7–C18. While there is good overlap in LLC in DC-1, there is almost no overlap for the MMC step in DC-2. This trend is reinforced by the previous steps (not shown): LC in DC-1 has good overlap, but MC in DC-2 does not. Finally, in the mutated case DC-1-MUT, flipping of the C7–C18 bases leads to a step pattern L-MC–LLC-M, which cannot completely stabilize the e-motif. Figure 10 shows the overlap areas of the basepair ring atoms of the pseudo GpC steps (LLC) of DC-1 and DC-1-MUT, as well as the overlap areas of the pseudo CpG steps (MMC) of DC-2emotif as a function of time for the 1 μs run.
Figure 9.
Pseudo GpC stacking LL in GCC trinucleotide repeats. (A) G-G stacking of the hexagon part on the base for the pseudo GpC step LL; (B) most populated hydrogen bond O2–N4 for the BSC0 and OL15 force fields; (C) most populated hydrogen bond O3′–N4 for BSC1 results.
The extended e-motif is stabilized by highly cooperative interactions
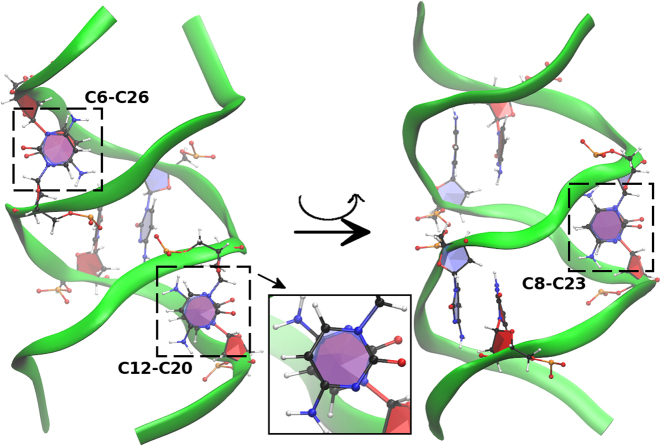
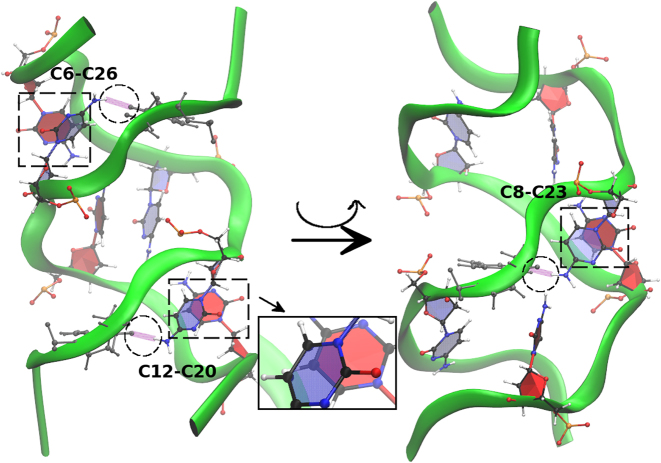
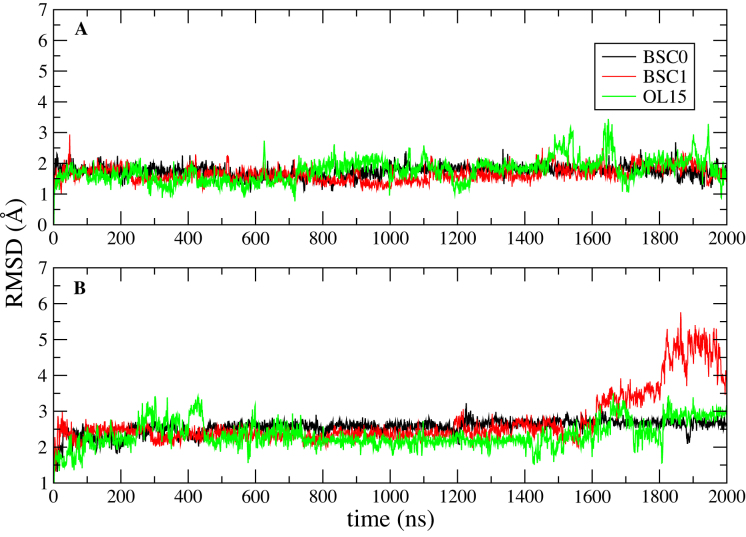
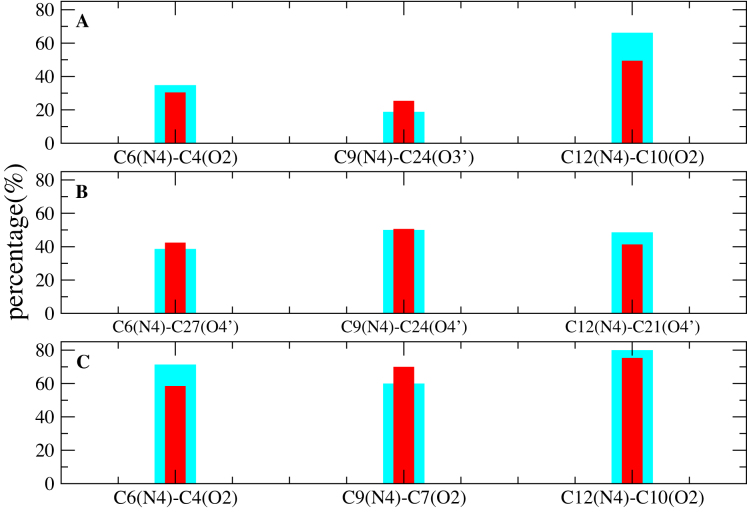
Finally, we have considered the stability and structural characteristics of the extended e-motif, when all the C·C mismatches are extruded in e-motifs. In order to characterize this motif, we have considered the duplexes GCC4extended and CCG4extended shown in Figure 1E and F, with four consecutive e-motifs. In addition to the favorable stacking afforded by pseudo GpC steps, the extended e-motif is further stabilized by the stacking of the extruded C bases themselves (see Figures 13 and 14). Figure 11 shows the RMSD of the central section (residues 4–12,18–26) of the duplexes GCC4extended and CCG4extended with respect to the initial frame in a 2 μs MD simulation for the three force fields. These figures suggest that GCC4extended is stable in the 2 μs time scale, while CCG4extended start to deviate from the initial structure at late times: the duplex in BSC1 shows a considerable increase of RMSD at approximately 1.6 μs, the OL15 RMSD shows a smaller jump at approximately the same time, while the average RMSDs for the BSC0 duplexes increases slowly and monotonically from an ‘early’ value of 1.4 Å at 10 ns to a value of 2.7 Å at 2 μs. Supplementary Figure S9 shows the time behavior of the first principal component of internal nucleotides (nucleotides 4-12, 18-26) as obtained from a principal component analysis (PCA). GCC4extended is characterized by regular fluctuations in the three force fields, while CCG4extended displays a breaking of symmetry around the zero eigenvalue in both BSC1 and OL15, signaling a conformational transition. Figure 12 shows the hydrogen bonds with highest percentage in GCC4extended associated with the extruded C6, C9, C12 bases and the symmetric ones on the other strand. Notice that while OL15 displays consistently intra-strand Ci(N4)–C(i − 2)(O2) bonding, BSC0 shows two of these (for C6 and C12) and one inter-strand bonding [C9(N4)–C24(O3′)], and BSC1 shows three inter-strand bondings Ci(N4)–C(33 − i)(O4′). Finally, Figures 13 and 14 show the stacking of the extruded C bases themselves for the BSC1 and OL15 force fields, respectively. The inter-strand hydrogen bonding in BSC1 leads to better C-C stacking than the inter-strand bonding in OL15.
Figure 13.
CC stacking pattern for the GCC4extended duplex for the BSC1 results. Left figure shows the stacking of C6–C26 and C12–C20, right figure shows the stacking of C8–C23 after a rotation around the central axis. The inset in the middle shows the close view of C12–C20 stacking.
Figure 14.
CC stacking pattern for the GCC4extended duplex for the OL15 results. Left figure shows the stacking of C6–C26 and C12–C20, right figure shows the stacking of C8–C23 after a rotation around the central axis. The stacking is not as strong as in BSC1 because the extruded C bases have hydrogen bonds with bases along the same strand. Hydrogen bonds are shown in purple inside the circles. The inset in the middle shows the close view of C12–C20 stacking.
Figure 11.
RMSD of the extended e-motif in trinucleotide repeats. RMSD of the central section of the extended e-motif (residues 4–12, 18–26) with respect to the initial frame in a 2 μs MD simulation. Different colors are used to represent different force field results. Results are shown for: (A) GCC4extended; (B) CGG4extended.
Figure 12.
Hydrogen bonds in extended e-motif GCC duplexes. Hydrogen bonds with highest percentage in GCC4extended associated with the extruded C6, C9, C12 bases and the symmetric ones on the other strand. Cyan color shows the percentage of the labeled hydrogen bonds and red color shows the symmetric ones on the other strand. Results are given for the different force fields: (A) BSC0; (B) BSC1; (C) OL15.
DISCUSSION
In this work, we have presented results from MD simulations that provide a detailed structural and dynamical characterization of the e-motif, along with the factors that stabilize it. The initial duplex with an e-motif as revealed by an NMR study by Gao et al. in 1995 (38) supplied the first evidence that the C·C mismatch pairs were flexible enough to produce a significant conformational change within a DNA double helix. After that, two important studies (40,41) provided indirect evidence of the presence of e-motifs. These studies employed chemical modification of the bases followed by subsequent cleavage. The modifications involved guanine and cytosine chemical modifications in DNA hairpins with DMS and hydroxylamine respectively (40), and by mechlorethamine crosslinking reaction in DNA homoduplexes of the form d(GCC)n ·d(GCC)n (41). Both studies found that the helical part (standard duplex or hairpin stem) contains CpG steps between the Watson-Crick pairs and that the C·C mismatches are extrahelical. It is important to note that although the mechanisms of chemical modification probably occurred after the extrusion of the mismatched C bases, one cannot ultimately exclude the possibility that the chemical process itself could induce the extrahelical cytosine conformations. Given that the C·C mismatch is the least stable mismatch pair, these can easily become unstacked from the core helix, flipping outside the helix depending on their local environment. These studies also provided indirect evidence to the proposition that d(GCC)n homoduplexes or hairpin stems exhibit an extended e-motif formed by consecutive extrahelical C·C mismatches, something that could not be achieved in the short sequence employed by the NMR study. Based on their indirect evidence, Yu et al. (40) proposed a schematic of an extended e-motif that is in remarkable agreement with the atomic structures presented in this work.
An important issue when considering possible SSR conformations is the nature of the Watson-Crick pairs that surround the mismatches: sequences of the form 5′-(CCG)n-3′ and 5′-(GCC)n-3′ (without slipping such that strand ends are paired) exhibit Watson-Crick base pairs with GpC and CpG steps, respectively. The slipping of strands with respect to each other in the (CCG) DNA NMR structure 5′-(CCG)2-3′ (PDB ID 1NOQ) (38) results in CpG steps (as opposed to the GpC steps that would result if the DNA strands were paired at the ends). The importance of the steps has been pointed out before. In the scheme introduced by Darlow and Leach (52,53), hairpins were classified according to the alignment of the sides of the hairpins and the presence of an odd or even number of unpaired bases in the loop: ‘frame 1′ corresponds to GpC steps between the Watson–Crick basepairs in the hairpin stem, while ‘frame 2′ corresponds to CpG steps between the Watson-Crick basepairs in the stem (a ‘frame 3’ corresponds to alignment CGC that lacks Watson-Crick basepairs, and therefore corresponds to a considerably less stable structure). For the hexanucleotides, there are three possible alignments for the C-rich sequences: DC-1 and DC-2 combine neighboring Double C·C mismatches separated by four Watson–Crick basepairs; DC-1 combines CC/GG and CpG steps; DC-2 combines GG/CC and GpC steps. The third alignment is SC-3, that combines Single C·C mismatches separated by two Watson-Crick basepairs. This duplex only contains CC/GG steps. In order to facilitate the discussion, we introduced a notation for pseudo steps in Tables 2 and 3. In the following we discuss our main results.
The e-motif is stable under the three force fields
In a related context, we have calculated the various free energy maps for the mismatch conformations in CCG, GCC, GGC and CGG trinucleotide repeats, and show that the force fields BSC0, BSC1 and OL15 all share the same minima for the mismatch conformations. The main difference is that barriers between these minima are lowest for BSC0 and largest for BSC1, with OL15 providing for intermediate barriers. Thus, transitions between mismatch conformations corresponding to different global and relative minima statistically will happen faster in BSC0 than in BSC1. Indeed, we see spontaneous formation of e-motifs during regular MD in a few hundreds of nanoseconds both in trinucleotide repeats (GCC4) and hexanucleotide repeats (DC-1) under the BSC0 force field. The slower transitions in BSC1 could easily put the e-motif formation completely out of range for the current computer capabilities available. Instead, we built a (GCC)5 duplex with an internal e-motif Figure 1C and checked its stability. Up to 1 μs, the e-motif is stable in the three force fields. This is of course no proof that the e-motif is a minimum in the free energy map, but strongly supports this when considered with the rest of the results and the experimental data. Incidentally, our study for the single e-motif also seems to indicate that OL15 is perhaps most suited for the description of mismatches. Both BSC1 and OL15 were created as an attempt to correct deficiencies in BSC0. The e-motif is formed readily under the BSC0 force field. BSC1 has relatively high free energy barriers between relative minima that correspond to labile mismatch conformations observed experimentally (i.e. BSC1 seems to be too rigid for mismatches) and it does not reproduce the hydrogen bond pattern of the NMR structure 1NOQ. OL15, on the other hand, behaves properly as far as formation of the e-motif and hydrogen bond patterns (compared to the only experimental structure that provides atomic detail). However, for the extended e-motif, for which there is no experimental structural data, the stacking of the extruded C bases is optimized for BSC1 (across strands).
Description and characterization of the e-motif
In the e-motif, the C bases (i residue) in a mismatch symmetrically flip out in the minor groove, pointing their base moieties in the direction of the i − 2 residue (i.e. toward the 5′ direction in each strand). This is seen in Figure 2 for GCC4 and DC-1. The transition from an intra-helical C·C mismatch to an e-motif can be described quite distinctly by several quantities that involve some intermediate transition states between well defined initial and final average values that are very different, as described in the Results section. These quantities (shown for trinucleotides in Figures 3, 5 and 8) include (i) partial handedness of the e-motif; (ii) pseudodihedral angles describing the mismatched base unstacking with respect to the helical axis; (iii) the center-of-mass distance (ep-distance) between the basepairs surrounding the mismatch; (iv) the ‘e-motif distance’ (ec-distance), defined as the distance between the N4 atom of a mismatched C base at position i and the O2 atom of the C base at position i − 2 in GCC4 or the N3 atom of G base at position i − 2 in CCG4 and (v) the sum of backbone torsion angles α + γ that decreases approximately by 100° when the mismatched base flips into the minor groove.
Creation of the e-motif is favored by the formation of pseudo GpC steps when the bases in the C·C mismatches are extruded. Consequently, the e-motif is stable in paired-end homoduplexes of (GCC) and (CCCGGC) SSRs, but not in the other reading frames
In trinucleotide repeats, the extrusion of the C mismatches results in a pseudo GpC step LL in a pair-ended GCC sequence, which leads to G-G stacking in the adjacent basepairs (Figure 9) and a better overall stacking of the helix. This fact explains why in homoduplexes with paired ends, the e-motif is favored in GCC sequences (formation of LL pseudo steps after extrusion) but not in CCG sequences (formation of MM pseudo steps after extrusion, see Table 3). Indeed, the simulations presented here show spontaneous formation of e-motif in GCC4 but not in CCG4. They also show stability in the three force fields of the initial e-motif in GCC5emotif (Figure 4, and Supplementary Figures S3 and S4 in the SI), but not for CCG5emotif (Figure 5, and Supplementary Figures S5 and S6 in the SI). In the latter case, the e-motif quickly unravels and the mismatched C bases become intrahelical for both BSC1 and OL15. For BSC0 the mismatched bases continue being extrahelical in the 1 μs of the simulation, but their characteristic hydrogen bond pattern decays with time as shown in Figure 6.
For the hexanucleotide repeats, this argument still holds, even though the presence of two mismatches makes the helix less stable and introduces some additional nuances. First, we notice that due to the symmetry of the DC-1 and DC-2 sequences, the bases of either of the two mismatches, C7–C18 or C6–C19, can be extruded to form equivalent e-motifs. In DC-1, the extrusion of the bases in an e-motif leads to a pseudo GpC (LLC) step, such that the new step pattern around the intra-helical mismatch (the one that was not extruded) is N-LC–LLC-N. By contrast, flipping of the bases of the C7–C18 mismatch in DC-2 results in a pseudo CpG (MMC) step, such that the new step pattern around the intra-helical mismatch is N-MC–MMC-N, and therefore the e-motif is not favored. Finally, in the mutated case DC-1-MUT, flipping of the C7–C18 bases leads to a step pattern L-MC–LLC-M, which cannot completely stabilize the e-motif. The overlap areas of the pseudo steps (Supplementary Figure S8 and Figure 10) reflect the stability of the helical stacking as DC-1 forms an e-motif and DC-1-MUT and DC-2emotif lose their initial e-motif. Notice that the extruded bases in DC-1 at position i form hydrogen bonds C(N4)-G(N3) with the G bases at position i − 2. Instead, both DC-1-MUT and DC-2 form C(N4)–C(O2) hydrogen bonds with C bases at position i − 2. Given that the O2–H–N4 hydrogen bonds are in principle stronger than the N3–H–N4 hydrogen bonds, but that C(N4)–C(O2) cannot stabilize either DC-1-MUT or DC-2emotif, it is clear that the favorable stacking of the overall helix afforded by the GpC pseudo steps is the predominant factor for the formation of e-motifs.
The single e-motif is partially stabilized by the formation of hydrogen bonds between the C bases (i residue) in a mismatch and the i − 2 bases: these are C bases in the case of (GCC), and G bases in the case of (CCCGGC) in DC-1
The most important hydrogen bonds stabilizing the extruded bases in GCC sequences are Ci, mismatch(N4)–C(i − 2), Watson–Crick(O2) for both BSC0 and OL15, as well as for the experimental NMR duplex in 1NOQ (Figure 4). On the other hand, BSC1 finds an inter-strand hydrogen bond between the N4 atom of the mismatched C base in one strand, and the O3′ atom of the next mismatched C in the opposite strand. For the (CCCGGC) hexanucleotide the most important hydrogen bond is Ci(N4)–G(i − 2)(N3) (Figure 7).
The mismatched C bases in an e-motif are always in the minor groove
This property is directly linked to point (C) above: from Figure 1 it is clear that a GpC pseudo step LL in a GCC trinucleotide repeat means that the extruded C basis is preceded (in the 5′ direction) by a G basis, while in a CpG pseudo step MM in a CGG trinucleotide repeat it is followed (in the 3′ direction) by a G basis. The step arrangements have immediate consequences on the rotation paths followed by the extruded bases. A mismatched C preceded by a G in the 5′ direction favors a rotation path towards the minor groove such that the sum of backbone torsion angles α + γ decreases approximately by 100° when the base flips into the minor groove. On the other hand, a mismatched C followed by a G in the 3′ direction favors a rotation path towards the major groove such that the difference of backbone torsion angles ϵ − ζ increases approximately by 290° when the basis flips into the major groove, as we have shown in our previous work (42). Once the base has flipped into the minor groove, it finds it easier to form hydrogen bonds with bases in the 5′ direction due to the narrower space. Instead bases extruded into the major groove find themselves in a wider space and flip back and forth, unable to stably anchor themselves to another base. The same argument applies to the hexanucleotides, except that in this case it is the double mismatches that must be preceded by a G in the 5′ direction in order for one of them to flip into the minor groove (as stated before, both mismatches are completely equivalent). Thus DC-1 favors e-motifs but DC-2 does not. SC-3 is a special case as it is less stable than the other two. Topologically, it is also more different as single mismatches are intercalated every two Watson–Crick basepairs. In our previous work, we found that in 1μs run, the duplex unraveled and in another 1μs run, one strand slipped and the duplex adopted a DC-1 conformation. However longer repeats might be more stable, in which case mismatches like C7–C18 would favor e-motif which may help to stabilize the helix (but not C4–C22 or C10–C16).
The extended e-motif is stabilized by highly cooperative interactions
In addition to the favorable stacking afforded by pseudo GpC steps, either LL in trinucleotides or LC–LLC in hexanucleotides, and the hydrogen bonds between the mismatched bases and other nucleotides, the extended e-motif is further stabilized by the stacking of the extruded C bases themselves (Figures 13 and 14). The net result is a very stable anomalous secondary structure. Our simulations suggest that GCC4extended is stable in the 2 μs time scale, while CCG4extended start to deviate from the initial structure at late times. The pattern of stabilizing hydrogen bonds for GCC4extended depend on the force field: OL15 displays consistently intra-strand Ci(N4)–C(i − 2)(O2) bonding, BSC0 shows two of these (for C6 and C12) and one inter-strand bonding [C9(N4)–C24(O3′)], and BSC1 shows three inter-strand bondings between the N4 atom of the Ci mismatched base in one strand and the O4′ atom of the next Watson-Crick paired C in the opposite strand. It is clear that the additional cooperativity provided by the C-stacking enormously extends the time scale to probe the stability of the extended e-motif. The results presented here are only indicative that the e-motifs in GCC4extended are stable and that those in CCG4extended may eventually unravel and become intra-helical mismatches. Finally, there is the question of whether cytosines may be protonated and how that might affect our results. Experimentally, C protonation seems to depend (not surprisingly) on the environment. Of the two studies that proposed an extended e-motif, one (40) reported that some C mismatches are protonated, but the other (41) did not, mainly the N3 are used for crosslinking with mechlorethamine (see Figure 2B in (41)). Moreover, the NMR structure by Gao et al. does not contain protonated cytosines (but the sequence is very short with only one e-motif). Our simulations were carried out with unprotonated Cs, but we make the following observations. If the Cs were initially protonated (before they form e-motif) they would tend to stabilize intrahelical mismatches by an additional hydrogen bond, as has been reported, for instance, in parallel DNA helices, and they would not favor the formation of the e-motif. Once the C bases are extruded, they can probably protonate. However, that would not make an important difference in the results presented here: the main driving force behind the formation of the e-motif is the stacking provided by the pseudo GpC steps of various forms, because it stabilizes the helical duplex, both for single an extended e-motif. In addition, observation of the extended e-motif indicates that due to spatial constraints, the stacking of extruded C bases can only take two forms: either intra-strand as obtained with OL15, or inter-strand as obtained with BSC1 (of course, along the duplex there could be an assortment of these, as shown by BSC0). Thus protonated Cs will not find a ‘third’ form of extruded-cytosine stacking, although they might favor one form versus the other.
Biological implications
As discussed in the introduction, the first step in the expansion of SSR is the formation of atypical secondary structures in single-stranded DNA. To date, there is no complete understanding of how exactly this happens or why there is a critical threshold length that makes the repeating tract unstable and triggers the onset of pathology. The initial intuitive explanation (3,14,54–58) was that it is the minimal length at which the DNA atypical secondary structure becomes stable. However, as discussed by Lee and McMurray (59), small-sized loops can be stable. Instead, in single strand breaks or on Okazaki fragments during replication, there is a competition between duplex reconstitution (no mutation) and secondary structure formation in the single strand (leading to a premutation). If the gap filling synthesis cannot prevent or runs past a relatively stable self-pairing in the strand, then the excess bases initiate folding into secondary structure in the SSR strand. The details of this atypical DNA secondary structure are important for a complete understanding of sequence expansion; gene hypermethylation; interactions with proteins involved in transcription coupled repair (TCR) nucleotide excision repair (NER), flap endonuclease 1 (FEN1), DNA mismatch repair (MMR, especially MutSβ, whose abnormal binding to SSR hairpins has been linked to SSR expansion), and others.
Supplementary Material
SUPPLEMENTARY DATA
Supplementary Data are available at NAR online.
FUNDING
National Institute of Health (NIH) [NIH-R01GM118508]; National Science Foundation (NSF) [SI2-SEE-1534941]; Extreme Science and Engineering Discovery Environment (XSEDE) [TG-MCB160064]. Funding for open access charge: NIH.
Conflict of interest statement. None declared.
REFERENCES
- 1. McMurray C. DNA secondary structure: A common and causative factor for expansion in human disease. Proc. Natl. Acad. Sci. U.S.A. 1999; 96:1823–1825. [DOI] [PMC free article] [PubMed] [Google Scholar]
- 2. Pearson C., Edamura K., Cleary J.. Repeat instability: Mechanisms of dynamic mutations. Nat. Rev. Genet. 2005; 6:729–742. [DOI] [PubMed] [Google Scholar]
- 3. Mirkin S. Expandable DNA repeats and human disease. Nature. 2007; 447:932. [DOI] [PubMed] [Google Scholar]
- 4. Oberle I., Rouseau F., Heitz D., Devys D., Zengerling S., Mandel J.. Molecular-basis of the fragile-X syndrome and diagnostic applications. Am. J. Hum. Genet. 1991; 49:76.1829582 [Google Scholar]
- 5. Giunti P., Sweeney M., Spadaro M., Jodice C., Novelletto A., Malaspina P., Frontali M., AE H.. The trinucleotide repeat expansion on chromosome 6p (SCA1) in autosomal dominant cerebellar ataxias. Brain. 1994; 117:645–649. [DOI] [PubMed] [Google Scholar]
- 6. Campuzano V., Montermini L., Molto M., Pianese L., Cossee M., Cavalcanti F., Monros E., Rodius F., Duclos F., Monticelli A. et al. Friedreich’s ataxia: autosomal recessive disease caused by an intronic GAA triplet repeat expansion. Science. 1996; 271:1423–1427. [DOI] [PubMed] [Google Scholar]
- 7. Wells R.D., Warren S.. Genetic Instabilities and Neurological Diseases. 1998; San Diego: Academic Press/Elsevier. [Google Scholar]
- 8. Pearson C., Sinden R.. Sarma RH, Sarma MH. Slipped strand DNA (S-DNA and SI-DNA), trinucleotide repeat instability and mismatch repair: A short review. Structure, Motion, Interaction and Expression of Biological Macromolecules, Vol 2. 1998; 191–207.US NIH 10th Conversation in Biomolecular Stereodynamics Conference, SUNY Albany, JUN 17-21, 1997. [Google Scholar]
- 9. Mirkin S.M. DNA structures, repeat expansions and human hereditary disorders. Curr. Opin. Struct. Biol. 2006; 16:351–358. [DOI] [PubMed] [Google Scholar]
- 10. Orr H., Zoghbi H.. Trinucleotide repeat disorders. Annu. Rev. Neurosci. 2007; 30:575. [DOI] [PubMed] [Google Scholar]
- 11. Moore H., Greenwell P.W., Liu C.-P., Arnheim N., Petes T.D.. Triplet repeats form secondary structures that escape DNA repair in yeast. Proc. Natl. Acad. Sci. U.S.A. 1999; 96:1504–1509. [DOI] [PMC free article] [PubMed] [Google Scholar]
- 12. Wells R., Dere R., Hebert M., Napierala M., Son L.. Advances in mechanisms of genetic instability related to hereditary neurological diseases. Nucleic Acids Res. 2005; 33:3785–3798. [DOI] [PMC free article] [PubMed] [Google Scholar]
- 13. Kim J.C., Mirkin S.M.. The balancing act of DNA repeat expansions. Curr. Opin. Genet. Dev. 2013; 23:280–288. [DOI] [PMC free article] [PubMed] [Google Scholar]
- 14. Dion V., Wilson J.H.. Instability and chromatin structure of expanded trinucleotide repeats. Trends Genet. 2009; 25:288–297. [DOI] [PMC free article] [PubMed] [Google Scholar]
- 15. McMurray C.T. Hijacking of the mismatch repair system to cause CAG expansion and cell death in neurodegenerative disease. DNA Repair. 2008; 7:1121–1134. [DOI] [PMC free article] [PubMed] [Google Scholar]
- 16. Lin Y., Wilson J.H.. Transcription-induced DNA toxicity at trinucleotide repeats: double bubble is trouble. Cell Cycle. 2011; 10:611–618. [DOI] [PMC free article] [PubMed] [Google Scholar]
- 17. Ranum L. P.W., Cooper T.A.. RNA-mediated neuromuscular disorders. Ann. Rev. Neurosci. 2006; 6:259–277. [DOI] [PubMed] [Google Scholar]
- 18. Li L.-B., Bonini N.M.. Roles of trinucleotide-repeat RNA in neurological disease and degeneration. Trends Neurosci. 2010; 33:292–298. [DOI] [PMC free article] [PubMed] [Google Scholar]
- 19. Jin P., Zarnescu D., Zhang F., Pearson C., Lucchesi J., Moses K., Warren S.. RNA-mediated neurodegeneration caused by the fragile X premutation rCGG repeats in Drosophila. Neuron. 2003; 39:739–747. [DOI] [PubMed] [Google Scholar]
- 20. Jiang H., Mankodi A., Swanson M., Moxley R., Thornton C.. Myotonic dystrophy type 1 is associated with nuclear foci of mutant RNA, sequestration of muscleblind proteins and deregulated alternative splicing in neurons. Hum. Mol. Genet. 2004; 13:3079–3088. [DOI] [PubMed] [Google Scholar]
- 21. Daughters R., Tuttle D., Gao W., Ikeda Y., Moseley M., Ebner T., Swanson M., Ranum L.. RNA gain-of-function in spinocerebellar ataxia type 8. PLoS Genet. 2009; 5:e1000600. [DOI] [PMC free article] [PubMed] [Google Scholar]
- 22. Krzyzosiak W., Sobczak K., Wojciechowska M., Fiszer A., Mykowska A., Kozlowski P.. Triplet repeat RNA structure and its role as pathogenic agent and therapeutic target. Nucleic Acids Res. 2012; 40:11–26. [DOI] [PMC free article] [PubMed] [Google Scholar]
- 23. Campuzano V., Montermini L., Lutz Y., Cova L., Hindelang C., Jiralerspong S., Trottier Y., Kish S., Faucheux B., Trouillas P. et al. Frataxin is reduced in Friedreich ataxia patients and is associated with mitochondrial membranes. Hum. Mol. Genet. 1997; 6:1771–1780. [DOI] [PubMed] [Google Scholar]
- 24. Kim E., Napierala M., Dent S.. Hyperexpansion of GAA repeats affects post-initiation steps of FXN transcription in Friedreich’s ataxia. Nucleic Acids Res. 2011; 39:8366–8377. [DOI] [PMC free article] [PubMed] [Google Scholar]
- 25. Kumari D., Biacsi R., Usdin K.. Repeat expansion in intron 1 of the Frataxin gene reduces transcription initiation in Friedreich ataxia. FASEB J. 2011; 25:895. [Google Scholar]
- 26. Punga T., Buehler M.. Long intronic GAA repeats causing Friedreich ataxia impede transcription elongation. Embo Mol. Med. 2010; 2:120–129. [DOI] [PMC free article] [PubMed] [Google Scholar]
- 27. Fu Y.-H., Kuhl D.P., Pizzuti A., Pieretti M., Sutcliffe J.S., Richards S., Verkert A.J., Holden J.J., Fenwick R.G. Jr, Warren S.T. et al. Variation of the CGG repeat at the fragile X site results in genetic instability: Resolution of the Sherman paradox. Cell. 1991; 67:1047–1058. [DOI] [PubMed] [Google Scholar]
- 28. Zhong N., Ju W., Pietrofesa J., Wang D., Dobkin C., Brown W.T.. Fragile X “gray zone” alleles: AGG patterns, expansion risks, and associated haplotypes. Am. J. Med. Genet. 1996; 64:261–265. [DOI] [PubMed] [Google Scholar]
- 29. Dombrowski C., Lévesque S., Morel M.L., Rouillard P., Morgan K., Rousseau F.. Premutation and intermediate-size FMR1 alleles in 10 572 males from the general population: loss of an AGG interruption is a late event in the generation of fragile X syndrome alleles. Hum. Mol. Genet. 2002; 11:371–378. [DOI] [PubMed] [Google Scholar]
- 30. Hagerman R., Leehey M., Heinrichs W., Tassone F., Wilson R., Hills J., Grigsby J., Gage B., Hagerman P.. Intention tremor, parkinsonism, and generalized brain atrophy in male carriers of fragile X. Neurology. 2001; 57:127–130. [DOI] [PubMed] [Google Scholar]
- 31. Sherman S.L. Premature ovarian failure among fragile X premutation carriers: parent-of-origin effect. Am. J. Hum. Genet. 2000; 67:11–13. [DOI] [PMC free article] [PubMed] [Google Scholar]
- 32. Glass I. X linked mental retardation. J. Med. Genet. 1991; 28:361–371. [DOI] [PMC free article] [PubMed] [Google Scholar]
- 33. Gu Y., Shen Y., Gibbs R.A., Nelson D.L.. Identification of FMR2, a novel gene associated with the FRAXE CCG repeat and CpG island. Nat. Genet. 1996; 13:109–113. [DOI] [PubMed] [Google Scholar]
- 34. Zhang B., Tian J., Yan Y., Yin X., Zhao G., Wu Z., Gu W., Xia K., Tang B.. CCG polymorphisms in the huntingtin gene have no effect on the pathogenesis of patients with Huntington’s disease in mainland Chinese families. J. Neurol. Sci. 2012; 312:92–96. [DOI] [PubMed] [Google Scholar]
- 35. Braida C., Stefanatos R.K., Adam B., Mahajan N., Smeets H.J., Niel F., Goizet C., Arveiler B., Koenig M., Lagier-Tourenne C. et al. Variant CCG and GGC repeats within the CTG expansion dramatically modify mutational dynamics and likely contribute toward unusual symptoms in some myotonic dystrophy type 1 patients. Hum. Mol. Genet. 2010; 19:1399–1412. [DOI] [PubMed] [Google Scholar]
- 36. DeJesus-Hernandez M., Machkenzie I.R., Boeve B.F., Boxer A.L., Baker M., Rutherford N.J., Nicholson A.M., Finch N.A., Flynn H., Adamson J. et al. Expanded GGGGCC hexanucleotide repeat in noncoding region of C9ORF72 causes chromosome 9p-Linked FTD and ALS. Neuron. 2011; 72:245–256. [DOI] [PMC free article] [PubMed] [Google Scholar]
- 37. Renton A.E., Majounie E., Waite A., Simon-Sanchez J., Rollinson S., Gibbs J.R., Schymick J.C., Laaksovirta H., van Swieten J.C., Myllykangas L. et al. A hexanucleotide repeat expansion in C9ORF72 is the cause of chromosome 9p21-linked ALS-FTD. Neuron. 2011; 72:257–268. [DOI] [PMC free article] [PubMed] [Google Scholar]
- 38. Gao X., Huang X., Smith G., Zheng M., Liu H.. New antiparallel duplex motif of DNA CCG repeats that is stabilized by extrahelical basis symmetrically located in the minor-groove. J. Am. Chem. Soc. 1995; 117:8883–8884. [Google Scholar]
- 39. Zheng M., Huang X., Smith G., Yang X., Gao X.. Genetically unstable CXG repeats are structurally dynamic and have a high propensity for folding. An NMR and UV spectroscopic study. J. Mol. Biol. 1996; 264:323–336. [DOI] [PubMed] [Google Scholar]
- 40. Yu A., Barren M., Romero R., Christy M., Gold B., Dai J., Gray D., Haworth I., Mitas M.. At physiological pH, d(CCG)(15) forms a hairpin containing protonated cytosines and a distorted helix. Biochem. 1997; 36:3687–3699. [DOI] [PubMed] [Google Scholar]
- 41. Rojsitthisak P., Romero R.M., Haworth I.S.. Extrahelical cytosine bases in DNA duplexes containing d[GCC]n ·d[GCC]n repeats: detection by a mechlorethamine crosslinking reaction. Nucleic Acids Res. 2001; 29:4716–4723. [DOI] [PMC free article] [PubMed] [Google Scholar]
- 42. Zhang Y., Roland C., Sagui C.. Structure and dynamics of DNA and RNA double helices obtained from the GGGGCC and CCCCGG hexanucleotide repeats that are the hallmark of C9FTD/ALS diseases. ACS Chem. Neurosci. 2016; 8:578–591. [DOI] [PMC free article] [PubMed] [Google Scholar]
- 43. Case D.A., Betz R., Cerutti D., Cheatham T. III, Darden T., Duke R., Giese T., Gohlke H., Goetz A., Homeyer N. et al. AMBER 16. 2016; San Francisco: University of California. [Google Scholar]
- 44. Ivani I., Dans P., Noy A., Pérez A., Faustino I., Hopsital A., Walther J., Andrio P., Goni R., Balaceanu A. et al. Parmbsc1: a refined force field for DNA simulations. Nature Meth. 2016; 13:55–58. [DOI] [PMC free article] [PubMed] [Google Scholar]
- 45. Perez A., Marchan I., Svozil D., Sponer J., Cheatham T.E., Laughton C.A., Orozco M.. Refinement of the AMBER force field for nucleic acids: improving the description of α/γ conformers. Biophys. J. 2007; 92:3817–3829. [DOI] [PMC free article] [PubMed] [Google Scholar]
- 46. Zgarbová M., Šponer J., Otyepka M., Cheatham T.E. III, Galindo-Murillo R., Jurečka P.. Refinement of the sugar-phosphate backbone torsion beta for AMBER force fields improves the description of Z- and B-DNA. J. Chem. Theory Comput. 2015; 11:5723–5736. [DOI] [PubMed] [Google Scholar]
- 47. Jorgensen W.L., Chandrasekhar J., Madura J., Klein M.L.. Comparison of simple potential functions for simulating liquid water. J. Chem. Phys. 1983; 79:926–935. [Google Scholar]
- 48. Joung I.S., Cheatham T.E.. Determination of alkali and halide monovalent ion parameters for use in explicitly solvated biomolecular simulations. J. Phys. Chem. B. 2008; 112:9020–9041. [DOI] [PMC free article] [PubMed] [Google Scholar]
- 49. Essmann U., Perera L., Berkowitz M.L., Darden T., Lee H., Pedersen L.G.. A smooth particle mesh Ewald method. J. Chem. Phys. 1995; 103:8577–8593. [Google Scholar]
- 50. Moradi M., Babin V., Roland C., Sagui C.. Reaction path ensemble of the B-Z-DNA transition: a comprehensive atomistic study. Nucleic Acids Res. 2013; 41:33–43. [DOI] [PMC free article] [PubMed] [Google Scholar]
- 51. Pan F., Man V., Roland C., Sagui C.. Structure and dynamics of DNA and RNA double helices of CAG and GAC trinucleotide repeats. Biophys. J. 2017; 113:19–36. [DOI] [PMC free article] [PubMed] [Google Scholar]
- 52. Darlow J., Leach D.. Secondary structures in d(CGG) and d(CCG) repeat tracts. J. Mol. Biol. 1998; 275:3–16. [DOI] [PubMed] [Google Scholar]
- 53. Darlow J., Leach D.. Evidence for two preferred hairpin folding patterns in d(CGG).d(CCG) repeat tracts in vivo. J. Mol. Biol. 1998; 275:17–23. [DOI] [PubMed] [Google Scholar]
- 54. Nelson D.L., Orr H.T., Warren S.T.. The unstable repeats—three evolving faces of neurological disease. Neuron. 2013; 77:825–843. [DOI] [PMC free article] [PubMed] [Google Scholar]
- 55. McMurray C.T. Mechanisms of trinucleotide repeat instability during human development. Nat. Rev. Genet. 2010; 11:786–799. [DOI] [PMC free article] [PubMed] [Google Scholar]
- 56. La Spada A.R., Taylor J.P.. Repeat expansion disease: progress and puzzles in disease pathogenesis. Nat. Rev. Genet. 2010; 11:247–258. [DOI] [PMC free article] [PubMed] [Google Scholar]
- 57. McMurray C.T. Mechanisms of DNA expansion. Chromosoma. 1995; 104:2–13. [DOI] [PubMed] [Google Scholar]
- 58. McMurray C.T. Influence of hairpins on template reannealing at trinucleotide repeat duplexes: a model for slipped DNA. Biochemistry. 1998; 37:9426–9434. [DOI] [PubMed] [Google Scholar]
- 59. Lee D.-Y., McMurray C.T.. Trinucleotide expansion in disease: why is there a length threshold. Curr. Opin. Genet. Dev. 2014; 26:131–140. [DOI] [PMC free article] [PubMed] [Google Scholar]
Associated Data
This section collects any data citations, data availability statements, or supplementary materials included in this article.


