Abstract
Purpose:
To study the retinal nerve fiber layer (RNFL) and ganglion cell layer (GCL) changes on optical coherence tomography in early multiple sclerosis (MS) patients.
Methods:
A prospective cohort study was conducted at a tertiary care center. Patients of early MS (expanded disability status scale <3) with or without optic neuritis (ON) and idiopathic ON were included. Twenty age-matched individuals were taken as controls. Changes in RNFL and GCL thickness were evaluated along with the correlation with visual function parameters such as visual acuity, contrast sensitivity, and visual evoked response at first visit and again at six months.
Results:
Forty-four patients of MS with or without ON (24 and 20 patients respectively), 29 patients with idiopathic ON, and 20 healthy controls constituted the cohorts. Mean LogMAR best-corrected visual acuity was found to be significantly reduced in all groups except fellow eyes (FE) of ON group. Mean values of average RNFL thickness and values in superior, temporal, and inferior quadrant were significantly reduced. Similarly, overall mean values of average GCL-inner plexiform layer (IPL) thickness and values in superior, superonasal, superotemporal, inferonasal, and inferotemporal quadrant were significantly reduced in all groups except FE of ON group (P < 0.05). All the visual parameters significantly correlated with GCL + IPL thickness.
Conclusion:
GCL + IPL thickness is a more sensitive clinical structural marker than RNFL in early MS with/without ON and ON patients and correlates with all the visual parameters better than RNFL thickness.
Keywords: Ganglion cell layer, multiple sclerosis, optic neuritis, retinal nerve fiber
Optic neuritis (ON) develops in 40% of multiple sclerosis (MS) cases and around one-third of these patients present with symptoms related to ON.[1,2] This neurodegenerative process leads to axonal loss in the optic nerve and nerve fiber loss in the retina.[3,4,5,6,7,8,9] Quantification of neuronal loss in MS patient's eyes by time-domain optical coherence tomography (OCT) is well established.[10,11,12,13,14,15] While most studies have evaluated moderate to advanced MS, no study has been directed at early MS cases.[16,17,18,19,20]
In the present study, ganglion cell layer (GCL) and retinal nerve fiber layer (RNFL) changes were evaluated in early MS (with and without ON) and cases of idiopathic ON and correlated with visual function changes.
Methods
A prospective cohort study was conducted at a tertiary care center in India, after obtaining prior approval from the Institutional Ethics Committee. An informed consent was taken from all participants in compliance with the tenets of the Declaration of Helsinki.
The cohorts constituted 80 consecutive cases of multiple sclerosis (with or without ON) and idiopathic ON which presented to the neuro-ophthalmic clinic and qualified based on the inclusion and exclusion criteria. The sample size was calculated by taking mean GCL + inner plexiform layer (IPL) thickness of 88.9 and 79 μm for controls and ON patients,[20] respectively; keeping an alpha error (type 1) – 5% to ensure the power of study – 95%.
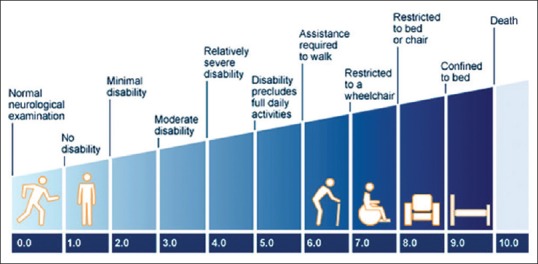
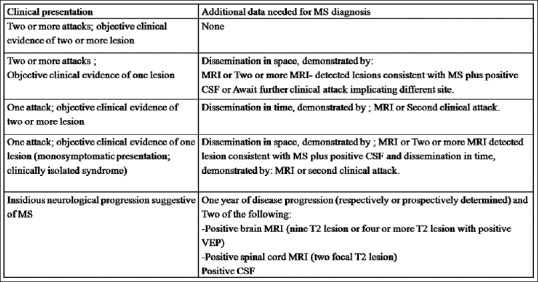
The inclusion criteria were: (1) early multiple sclerosis (expanded disability status scale (EDSS) < 3) as depicted in Fig. 1, with or without ON, diagnosed as per McDonald's diagnostic criteria, as depicted in Fig. 2.[21] (2) history of ON, idiopathic (if not associated in any other systemic manifestation or disease like MS), or having last acute attack >6 months prior, and (3) age >18 years. All the included MS patients were in remission stage and were on disease-modifying agent (Interferon beta-1a).
Figure 1.

Expanded disability status scale scoring
Figure 2.

McDonald's diagnostic criteria
Exclusion criteria were: (1) presence of any ocular pathology likely to affect visual functions such as corneal scar and cataract, (2) presence or suspicion of glaucoma, (3) refractive error spherical > + 5 or –5 Diopter or astigmatism >2D, and (4) inability to undergo OCT testing. Twenty age-matched individuals, without any known ocular pathology likely to affect visual functions or OCT findings, and who were willing to follow-up were included as controls.
All cases underwent a detailed history and examination. History aimed to document time of onset of disease (based on duration of symptoms), course (stationary/improving/worsening), and history of any trauma or previous eye surgery.
Ocular examination focused on evaluation of visual functions including best-corrected visual acuity (BCVA; Snellen chart), contrast sensitivity (Pelli-Robson chart), visual fields (30-2 SITA standard strategy, evaluated by the automated Visual Field Analyzer 750i [Carl Zeiss Meditec Inc, Dublin, CA]), and visual evoked responses (VERs) which were recorded using the Nicolet Ganzfeld 2015 visual stimulator and monitor (Nicolet Biomedical, Madison, WI). Structural changes in the eyes were evaluated using the Cirrus HD-OCT Model 4000 (Carl Zeiss Meditec Inc, Dublin, CA). The RNFL and macular GCL thickness was assessed in the OCT using optic disc cube 200 × 200 scan and macular cube 512 × 128 scan, respectively.
Trained technicians blinded to the diagnosis performed the visual functions and OCT. The latter was performed with undilated pupil (if ≥5 mm). In small pupils, one drop of tropicamide (1%; w/v) was instilled. Scans were considered to be of good quality if centration was good, and signal strength was adequate of at least ≥7. The RNFL thickness values were measured for 2.4 mm diameter circles around the optic disc. Average values of RNFL thickness, along with values in superior, nasal, inferior, and temporal quadrants were recorded. GCL values were derived from a macular scan. As the GCL could not be reliably separated from the IPL, the combined values of GCL + IPL were taken within a 6-mm diameter centered at the foveola for the assessment of GCL thickness. Average thickness values along with values in superior, inferior, superotemporal, inferotemporal, superonasal, and inferonasal quadrant were noted.
The eyes of included patients were divided into six cohorts: eyes of MS patients without ON (MS), affected eyes (AE) of MS patients with ON (MS + ON [AE]), FE of MS patients with ON (MS + ON [FE]), affected eye of patients with idiopathic ON (ON [AE]), FE of patients with idiopathic ON (ON [FE]), and age-matched disease-free controls.
In all the included patients and controls, the visual function parameters (including visual acuity, contrast sensitivity, VER) and OCT assessment for RNFL as well as GCL were noted at first visit and at 6 months. Changes in RNFL and GCL thickness were evaluated along with the evaluation of their correlation with the visual function parameters using appropriate statistical techniques on Stata 11.0 (College status, Texas, USA). P < 0.05 was considered statistically significant. Bonferroni was applied whenever more than two groups compared and P < 0.005 was considered significant in these comparisons.
Results
Of the 80 patients, 73 were finally included in the study while seven dropped out during follow-up. Those who went on included 44 patients of MS with or without ON (24 and 20 patients, respectively) and 29 patients with idiopathic ON. Twenty individuals constituted the control group.
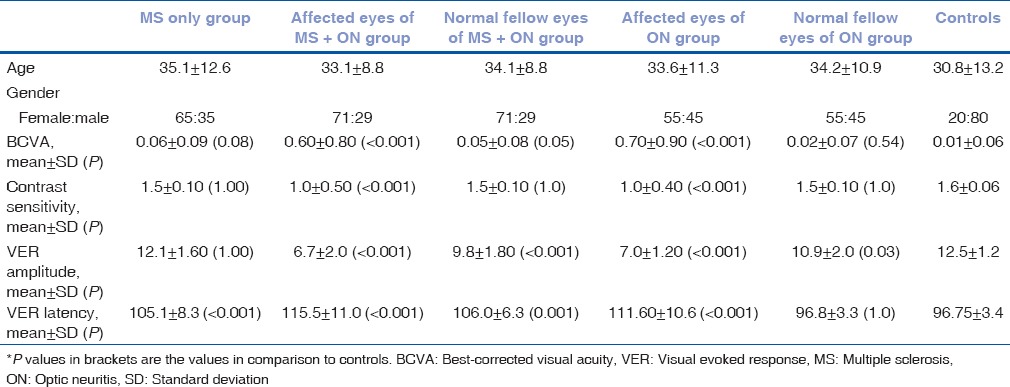
Mean LogMAR BCVA was found to be significantly reduced in all groups (with the exception of MS group and FE of ON (FE) group) as compared to controls. Contrast sensitivity was found to be significantly reduced in affected eyes of MS + ON (AE) and ON (AE) groups (P < 0.001) as compared to controls. In visual VER, mean amplitude was significantly decreased in all groups (with the exception of MS group). Mean values of VER latency were significantly prolonged in all the groups (with the exception of FE of ON (FE) group), as compared to controls. Age, gender, baseline values of BCVA, contrast sensitivity, VER amplitude, and VER latency in different groups are depicted in Table 1.
Table 1.
Demographic details and baseline values of best-corrected visual acuity, contrast sensitivity, visual evoked response amplitude, and visual evoked response latency in different groups

Overall mean values of average RNFL thickness and values in superior, temporal, and inferior quadrant were significantly reduced in affected eyes of MS + ON(AE), FE of MS + ON (FE), and affected eyes of ON (AE) groups as compared to control group [Table 2]. In the nasal quadrant, significant thinning was noted only in affected eyes of ON (AE) group. As compared to the nasal quadrant, temporal quadrant showed larger and more significant change in all groups. Thinning was not statistically significant in patients with MS and FE of ON (FE) groups in any of the quadrants.
Table 2.
Baseline mean values of retinal nerve fiber layer thickness; average, superior, temporal, inferior, and nasal quadrants (values in μm)

Overall mean values of average GCL-IPL thickness and values in superior, superonasal, superotemporal, inferonasal, and inferotemporal quadrant were significantly reduced in all the groups (with the exception of FE of ON (FE) group; P < 0.001), as depicted in Table 3. However, in the inferior and superonasal quadrant, thickness was reduced even in FE of ON (FE) group.
Table 3.
Baseline mean values of ganglion cell layer thickness; average, superior, superonasal, superotemporal, inferior, inferonasal, and inferotemporal sectors (values in μm)

Values of mean GCL-IPL and RNFL thickness, after 6 months of follow-up, are depicted in Tables 4 and 5. No significant change in RNFL (P = 0.99) and GCL (P = 0.192) values were observed over the period of 6 months in any group. However, both values were significantly lower when compared to controls (P < 0.001).
Table 4.
Mean values of retinal nerve fiber layer thickness at 6 months in various quadrants (values in μm)

Table 5.
Mean values of ganglion cell layer thickness at 6 months in various sectors (values in μm)

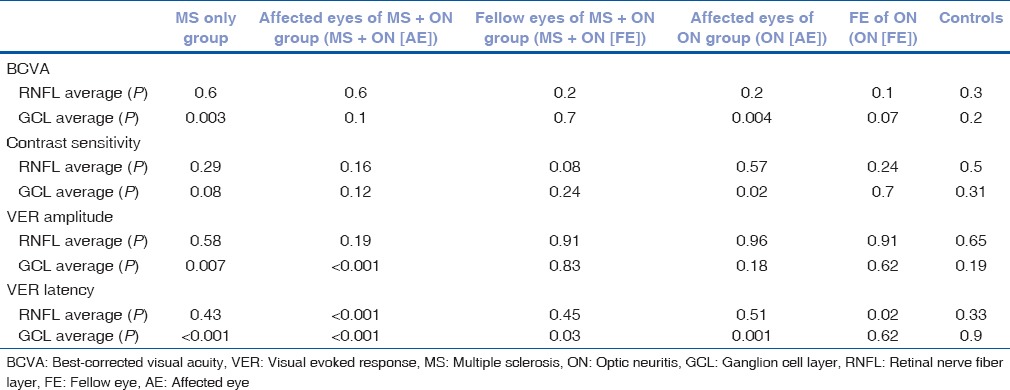
Average GCL + IPL thickness was found to be significantly correlated with BCVA in MS patients and affected eyes of ON (AE) group (P < 0.005 for both); correlated with contrast sensitivity in affected eyes of ON (AE) group (P < 0.05); correlated with VER amplitude in MS and affected eyes of MS + ON (AE) groups (P < 0.05 and < 0.005, respectively); correlated with VER latency in MS, affected eyes of M. S + ON(AE), FE of MS + ON (FE), and FE of ON groups with P < 0.001, < 0.001, < 0.05, and < 0.005, respectively.
Average RNFL thickness values were correlated only with VER latency in affected eyes of MS + ON group (AE), FE of ON (FE) groups (P < 0.001 and < 0.05, respectively [Table 6]).
Table 6.
Significance of correlation of visual function parameters best-corrected visual acuity, contrast sensitivity, visual evoked response amplitude, and visual evoked response latency with retinal nerve fiber layer and ganglion cell layer thickness

Discussion
Patients enrolled in this study were in the age group of 18–70 years with a female preponderance (F: M percentages ratios were 65:35, 71:29, and 55:45 in MS, MS + ON, and idiopathic ON groups, respectively), which is in accordance with previous studies.[9,14,20] Patients with refractive error more than +5 or –5 Diopter sphere were excluded from this study, as the influence of refractive error on RNFL thickness has been reported in literature.[22]
The mean of BCVA noted in MS with ON, ON, and MS groups was 0.6, 0.05, and 0.08 LogMAR units, respectively. Visual acuity in MS patients was found to be comparable with controls. This may be attributed to the absence of any visual problem at the time of enrollment in MS patients. However, in spite of normal vision, subclinical visual function and structural loss was observed in MS patients and similar observations were noted in previous studies.[23,24] Therefore, visual acuity, especially high contrast visual acuity, cannot be considered a sensitive parameter to distinguish multiple sclerosis with or without ON from normal eyes. Balcer et al. documented that low-contrast letter acuity is clinically more meaningful and correlates well with nerve fiber damage.[25]
Literature has documented contrast sensitivity as a sensitive parameter to distinguish MS patients from disease-free controls.[26,27,28] In our study, significantly lower mean contrast sensitivity values were noted in both affected eyes of MS + ON and ON groups as compared to controls. In MS patients without ON, though values were lower as compared to controls, the difference was not statistically significant. The possible explanation for this finding is that recruited MS patients had early disease (within 1 year of diagnosis with median EDSS score of 2). Therefore, contrast sensitivity alone is not a sensitive parameter to evaluate subclinical visual dysfunction in early MS, but it is sensitive for differentiating eyes with previous episode of ON.
VER showed significantly decreased amplitude and increased latency in affected eyes of ON, MS + ON groups, and FE of MS + ON groups. In addition, VER amplitude was reduced in FE of ON (FE) group. In the MS group, VER amplitude was similar to that of controls but latency was significantly prolonged. This indicates that VER latency is likely to be more sensitive parameter than amplitude in early MS cases. Comparable to our findings, Sriram et al. and Alshowaeir et al. documented similar VER latency delay in MS patients without ON.[29,30]
In the present study, overall average mean values of RNFL thickness and values in superior, temporal, and inferior quadrants were found to be significantly reduced in affected eyes of MS + ON (AE), FE of MS + ON (FE), and affected eyes of ON (AE) groups as compared to control groups. RNFL thickness was noted to be preserved in affected and other eyes of MS + ON patients in nasal quadrant. The study indicates that temporal quadrants are more sensitive and show greater change while nasal quadrant is most resistant to RNFL loss. This result concurs with a previous study published at our center.[23] Budenz et al. also documented significant intereye differences in temporal quadrant as the earliest manifestation of visual dysfunction.[31] However, Garcia-Martin et al. reported maximum RNFL damage in superonasal and inferotemporal quadrant.[32]
Studies done by Cennamo et al., Tátrai et al., and Davies et al. are in discordance with the present one and showed significant reduction in RNFL and GCL in MS patients regardless of previous ON episode.[16,33,34] The possible reason for this difference is the inclusion of early MS patients in the present study, which showed a preserved RNFL in MS patients.
Our study found a significant reduction in average GCL thickness values and in values in the superior, superonasal, superotemporal, inferonasal, and inferotemporal quadrants in all studied groups, except ON (FE) group. These findings corroborate with those of Saidha et al.'s study, in which authors documented GCL-IPL thinning in all MS subtypes and concluded that GCL-IPL thickness correlated better with visual dysfunction and disability in MS than RNFL thickness.[19]
Contrary to our finding of reduced GCL + IPL in MS patients without ON, Walter et al. documented normal GCL + IPL layer in the eyes of MS patients without ON.[20] The probable reason of axonal loss in our study may be attributed to subclinical episodes of ON in the past that may have affected the GCL with significant clinical manifestations.
This study did not find RNFL and GCL thickness loss over 6 months to be significantly different between MS with or without ON and ON patients although it was significantly more than that observed in controls. This is due to the fact that all the patients were in remission and that there was no acute episode of ON during the follow-up. Even though only a limited range of EDSS scores were taken, GCL thickness correlated more significantly with EDSS than RNFL thickness, as has been previously documented.[16,19]
GCL-IPL changes correlated significantly with visual function parameters as compared to RNFL changes. This confirms that GCL-IPL is more sensitive and likely to be more affected in early MS as compared to RNFL.
Conclusion
To conclude, GCL + IPL thickness is a more sensitive clinical structural marker than RNFL in early MS with/without ON and ON patients and correlates with all the visual parameters better than RNFL thickness.
Financial support and sponsorship
Nil.
Conflicts of interest
There are no conflicts of interest.
References
- 1.Roodhooft JM. Ocular problems in early stages of multiple sclerosis. Bull Soc Belge Ophtalmol. 2009;313:65–8. [PubMed] [Google Scholar]
- 2.Bhatia M, Behari M, Ahuja GK. Multiple sclerosis in India: AIIMS experience. J Assoc Physicians India. 1996;44:765–7. [PubMed] [Google Scholar]
- 3.Zaveri MS, Conger A, Salter A, Frohman TC, Galetta SL, Markowitz CE, et al. Retinal imaging by laser polarimetry and optical coherence tomography evidence of axonal degeneration in multiple sclerosis. Arch Neurol. 2008;65:924–8. doi: 10.1001/archneur.65.7.924. [DOI] [PubMed] [Google Scholar]
- 4.Syc SB, Warner CV, Hiremath GS, Farrell SK, Ratchford JN, Conger A, et al. Reproducibility of high-resolution optical coherence tomography in multiple sclerosis. Mult Scler. 2010;16:829–39. doi: 10.1177/1352458510371640. [DOI] [PubMed] [Google Scholar]
- 5.Garcia-Martin E, Pinilla I, Idoipe M, Fuertes I, Pueyo V. Intra and interoperator reproducibility of retinal nerve fibre and macular thickness measurements using cirrus fourier-domain OCT. Acta Ophthalmol. 2011;89:e23–9. doi: 10.1111/j.1755-3768.2010.02045.x. [DOI] [PubMed] [Google Scholar]
- 6.Petzold A, de Boer JF, Schippling S, Vermersch P, Kardon R, Green A, et al. Optical coherence tomography in multiple sclerosis: A systematic review and meta-analysis. Lancet Neurol. 2010;9:921–32. doi: 10.1016/S1474-4422(10)70168-X. [DOI] [PubMed] [Google Scholar]
- 7.Frohman EM, Fujimoto JG, Frohman TC, Calabresi PA, Cutter G, Balcer LJ. Optical coherence tomography: A window into the mechanisms of multiple sclerosis. Nat Clin Pract Neurol. 2008;4:664–75. doi: 10.1038/ncpneuro0950. [DOI] [PMC free article] [PubMed] [Google Scholar]
- 8.Lucarelli MJ, Pepose JS, Arnold AC, Foos RY. Immunopathologic features of retinal lesions in multiple sclerosis. Ophthalmology. 1991;98:1652–6. doi: 10.1016/s0161-6420(91)32080-3. [DOI] [PubMed] [Google Scholar]
- 9.Fisher JB, Jacobs DA, Markowitz CE, Galetta SL, Volpe NJ, Nano-Schiavi ML, et al. Relation of visual function to retinal nerve fiber layer thickness in multiple sclerosis. Ophthalmology. 2006;113:324–32. doi: 10.1016/j.ophtha.2005.10.040. [DOI] [PubMed] [Google Scholar]
- 10.Talman LS, Bisker ER, Sackel DJ, Long DA, Jr, Galetta KM, Ratchford JN, et al. Longitudinal study of vision and retinal nerve fiber layer thickness in multiple sclerosis. Ann Neurol. 2010;67:749–60. doi: 10.1002/ana.22005. [DOI] [PMC free article] [PubMed] [Google Scholar]
- 11.Burkholder BM, Osborne B, Loguidice MJ, Bisker E, Frohman TC, Conger A, et al. Macular volume determined by optical coherence tomography as a measure of neuronal loss in multiple sclerosis. Arch Neurol. 2009;66:1366–72. doi: 10.1001/archneurol.2009.230. [DOI] [PubMed] [Google Scholar]
- 12.Henderson AP, Trip SA, Schlottmann PG, Altmann DR, Garway-Heath DF, Plant GT, et al. An investigation of the retinal nerve fibre layers in progressive multiple sclerosis using optical coherence tomography. Brain. 2008;131:277–87. doi: 10.1093/brain/awm285. [DOI] [PubMed] [Google Scholar]
- 13.Merle H, Olindo S, Donnio A, Beral L, Richer R, Smadja D, et al. Retinal nerve fiber layer thickness and spatial and temporal contrast sensitivity in multiple sclerosis. Eur J Ophthalmol. 2010;20:158–66. doi: 10.1177/112067211002000122. [DOI] [PubMed] [Google Scholar]
- 14.Pueyo V, Ara JR, Almarcegui C, Martin J, Güerri N, García E, et al. Sub-clinical atrophy of the retinal nerve fibre layer in multiple sclerosis. Acta Ophthalmol. 2010;88:748–52. doi: 10.1111/j.1755-3768.2009.01527.x. [DOI] [PubMed] [Google Scholar]
- 15.Saidha S, Syc SB, Ibrahim MA, Eckstein C, Warner CV, Farrell SK, et al. Primary retinal pathology in multiple sclerosis as detected by optical coherence tomography. Brain. 2011;134:518–33. doi: 10.1093/brain/awq346. [DOI] [PubMed] [Google Scholar]
- 16.Davies EC, Galetta KM, Sackel DJ, Talman LS, Frohman EM, Calabresi PA, et al. Retinal ganglion cell layer volumetric assessment by spectral-domain optical coherence tomography in multiple sclerosis: Application of a high-precision manual estimation technique. J Neuroophthalmol. 2011;31:260–4. doi: 10.1097/WNO.0b013e318221b434. [DOI] [PMC free article] [PubMed] [Google Scholar]
- 17.Tan O, Chopra V, Lu AT, Schuman JS, Ishikawa H, Wollstein G, et al. Detection of macular ganglion cell loss in glaucoma by fourier-domain optical coherence tomography. Ophthalmology. 2009;116:2305–140. doi: 10.1016/j.ophtha.2009.05.025. [DOI] [PMC free article] [PubMed] [Google Scholar]
- 18.Ishikawa H, Stein DM, Wollstein G, Beaton S, Fujimoto JG, Schuman JS, et al. Macular segmentation with optical coherence tomography. Invest Ophthalmol Vis Sci. 2005;46:2012–7. doi: 10.1167/iovs.04-0335. [DOI] [PMC free article] [PubMed] [Google Scholar]
- 19.Saidha S, Syc SB, Durbin MK, Eckstein C, Oakley JD, Meyer SA, et al. Visual dysfunction in multiple sclerosis correlates better with optical coherence tomography derived estimates of macular ganglion cell layer thickness than peripapillary retinal nerve fiber layer thickness. Mult Scler. 2011;17:1449–63. doi: 10.1177/1352458511418630. [DOI] [PubMed] [Google Scholar]
- 20.Walter SD, Ishikawa H, Galetta KM, Sakai RE, Feller DJ, Henderson SB, et al. Ganglion cell loss in relation to visual disability in multiple sclerosis. Ophthalmology. 2012;119:1250–7. doi: 10.1016/j.ophtha.2011.11.032. [DOI] [PMC free article] [PubMed] [Google Scholar]
- 21.Krutzke JF. Rating neurological impairement in multiple sclerosis: Expanded Disability Status Scale (EDSS) Neurology. 1983;33:1444–52. doi: 10.1212/wnl.33.11.1444. [DOI] [PubMed] [Google Scholar]
- 22.Ozdek SC, Onol M, Gürelik G, Hasanreisoglu B. Scanning laser polarimetry in normal subjects and patients with myopia. Br J Ophthalmol. 2000;84:264–7. doi: 10.1136/bjo.84.3.264. [DOI] [PMC free article] [PubMed] [Google Scholar]
- 23.Saxena R, Bandyopadhyay G, Singh D, Singh S, Sharma P, Menon V. Evaluation of changes in retinal nerve fibre layer thickness and visuall functions in cases of optic neuritis and multiple sclerosis. Indian J Ophthalmol. 2013;61:562–6. doi: 10.4103/0301-4738.121071. [DOI] [PMC free article] [PubMed] [Google Scholar]
- 24.Balk LJ, Coric D, Nij Bijvank JA, Killestein J, Uitdehaag BM, Petzold A. Retinal atrophy in relation to visual functioning and vision-related quality of life in patients with multiple sclerosis. Mult Scler. 2017;1:1352458517708463. doi: 10.1177/1352458517708463. doi: 10.1177/1352458517708463. [Epub ahead of print] [DOI] [PMC free article] [PubMed] [Google Scholar]
- 25.Balcer LJ, Raynowska J, Nolan R, Galetta SL, Kapoor R, Benedict R, et al. Validity of low-contrast letter acuity as a visual performance outcome measure for multiple sclerosis. Mult Scler. 2017;23:734–47. doi: 10.1177/1352458517690822. [DOI] [PMC free article] [PubMed] [Google Scholar]
- 26.Soler García A, González Gómez A, Figueroa-Ortiz LC, García-Ben A, García-Campos J. Relationship between contrast sensitivity test and disease severity in multiple sclerosis patients. Arch Soc Esp Oftalmol. 2014;89:347–51. doi: 10.1016/j.oftal.2014.03.026. [DOI] [PubMed] [Google Scholar]
- 27.Balcer LJ, Frohman EM. Evaluating loss of visual function in multiple sclerosis as measured by low-contrast letter acuity. Neurology. 2010;74(Suppl 3):S16–23. doi: 10.1212/WNL.0b013e3181dbb664. [DOI] [PubMed] [Google Scholar]
- 28.Villoslada P, Cuneo A, Gelfand J, Hauser SL, Green A. Color vision is strongly associated with retinal thinning in multiple sclerosis. Mult Scler. 2012;18:991–9. doi: 10.1177/1352458511431972. [DOI] [PubMed] [Google Scholar]
- 29.Sriram P, Wang C, Yiannikas C, Garrick R, Barnett M, Parratt J, et al. Relationship between optical coherence tomography and electrophysiology of the visual pathway in non-optic neuritis eyes of multiple sclerosis patients. PLoS One. 2014;9:e102546. doi: 10.1371/journal.pone.0102546. [DOI] [PMC free article] [PubMed] [Google Scholar]
- 30.Alshowaeir D, Yiannikas C, Garrick R, Parratt J, Barnett MH, Graham SL, et al. Latency of multifocal visual evoked potentials in nonoptic neuritis eyes of multiple sclerosis patients associated with optic radiation lesions. Invest Ophthalmol Vis Sci. 2014;55:3758–64. doi: 10.1167/iovs.14-14571. [DOI] [PubMed] [Google Scholar]
- 31.Budenz DL, Anderson DR, Varma R, Schuman J, Cantor L, Savell J, et al. Determinants of normal nerve fiber layer thickness measured by Stratus OCT. Ophthalmology. 2007;114:1046–52. doi: 10.1016/j.ophtha.2006.08.046. [DOI] [PMC free article] [PubMed] [Google Scholar]
- 32.Garcia-Martin E, Calvo B, Malvè M, Herrero R, Fuertes I, Ferreras A, et al. Three-dimensional geometries representing the retinal nerve fiber layer in multiple sclerosis, optic neuritis, and healthy eyes. Ophthalmic Res. 2013;50:72–81. doi: 10.1159/000350413. [DOI] [PubMed] [Google Scholar]
- 33.Cennamo G, Romano MR, Vecchio EC, Minervino C, Della Guardia C, Velotti N, et al. Anatomical and functional retinal changes in multiple sclerosis. Eye (Lond) 2016;30:456–62. doi: 10.1038/eye.2015.256. [DOI] [PMC free article] [PubMed] [Google Scholar]
- 34.Tátrai E, Simó M, Iljicsov A, Németh J, Debuc DC, Somfai GM, et al. In vivo evaluation of retinal neurodegeneration in patients with multiple sclerosis. PLoS One. 2012;7:e30922. doi: 10.1371/journal.pone.0030922. [DOI] [PMC free article] [PubMed] [Google Scholar]


