Abstract
Amyloid positron emission tomography (PET) imaging with florbetapir 18F (18F-AV-45) allows in vivo assessment of cerebral amyloid load and can be used in the evaluation of progression of Alzheimer's disease (AD) and other dementias associated with b-amyloid. However, cortical amyloid deposition can occur in healthy cases, as well as in patients with AD and quantification of cortical amyloid burden can improve the 18F-AV-45 PET imaging evaluations. The quantification is mostly performed by cortical-to-cerebellum standardized uptake value ratio (SUVr). The aim of our study was to compare two methods for SUVr calculations in amyloid florbetapir 18F PET brain imaging. In amyloid florbetapir 18F PET brain imaging study, we imaged 42 cases with the mean age of 72.6 ± 9.9 (mean ± standard deviation). They were imaged on different PET/computed tomography systems with 369.0 ± 34.2 kBq of 18F florbetapir. Data were reconstructed using the vendor's reconstruction software. Corresponding magnetic resonance imaging (MRI) data were retrieved, and matched PET and MRI data were transferred to a common platform. Two methods were used for the calculation of the ratio of cortical-to-cerebellar signal (SUVr). One method was based on the MIM Software Inc., Version 6.4 software and only uses PET data. The second approach used the PMOD Neuro tool (version 3.5). This approach utilizes PET and corresponding MRI data (preferably T1-weighted) for better brain segmentation. For all the 42 cases, the average SUVr values for MIM and PMOD applications were 1.24 ± 0.26 and 1.22 ± 0.25, respectively, with a mean difference of 0.02 ± 0.15. The repeatability coefficient was 0.15 (12.3% of the mean). The Spearman's rank correlation coefficient was very high, r = 0.96. For amyloid-negative cases, the average SUVr values were lower than all group SUVr average values, 0.96 ± 0.07 and 1.00 ± 0.09, for MIM and PMOD applications, respectively. A mean difference was 0.04 ± 0.12, the repeatability coefficient was 0.12 (12.9% of the mean) and the Spearman's rank correlation coefficient was modest, r = 0.55. For amyloid-positive patients, the average SUVr values were higher than the same all group values, 1.34 ± 0.16 and 1.35 ± 0.20, respectively, with a mean difference of 0.01 ± 0.16. The repeatability coefficient was 0.16 (11.9% of the mean). The Spearman's rank correlation coefficient was high, r = 0.93. Our results indicated that the SUVr values derived using MIM and PMOD Neuro are effectively interchangeable and well correlated. However, PET template-based quantification (MIM approach) is clinically friendlier and easier to use. MRI template-based quantification (PMOD Neuro) better delineates different regions of the brain, can be used with any tracer, and therefore is more suitable for research.
Keywords: Alzheimer's disease, florbetapir, positron emission tomography amyloid imaging
Introduction
Accurate clinical diagnosis of Alzheimer's disease (AD) can be a challenging task. Therefore, the development and improvement of diagnostic procedures in characterizing cognitive impairment has been a health-care priority. Recently, amyloid positron emission tomography (PET) neuroimaging has received increased attention because it has been shown that it can provide substantial clinical utility by accurately detecting the presence or absence of brain amyloid in individuals at risk for AD. The use of PET imaging with probes that bind specifically to β-amyloid and tau aggregates may provide an earlier diagnosis of AD. The first PET tracer specific for β-amyloid plaques was the Pittsburgh compound B (11C-PiB).[1] However, the major limitation of 11C-PiB is the 20-min half-life of the 11C isotope, which restricts its use to research centers. In contrast, an 18F-based PET tracer, with a 110-min half-life, can be prepared remotely and delivered far more widely. Several such 18F-labeled tracers have been recently developed such as florbetaben (18F), flutemetamol (18F), and florbetapir (18F).[2] In particular, florbetapir 18F (18F-AV-45) is an 18F amyloid PET ligand with rapid brain uptake and rapid washout from gray tissues not containing amyloid, high affinity to aggregated β-amyloid, a short imaging time, good separation between the amyloid retention and background signal, and a long, stable pseudoequilibrium permitting flexibility in image acquisition time.[3] Recently, a large multicenter study[4] compared PET florbetapir imaging with neuropathology at autopsy for the detection of neuritic amyloid-β plaques. The study revealed that the correlation between florbetapir-PET imaging and postmortem amyloid burden supports the conclusion that florbetapir PET might be useful for imaging of amyloid-β neuritic plaques in the brains of patients with cognitive impairment. The analysis of PET images was done visually and using semiautomated quantitative analysis.[4] Semiautomated quantitative analysis was done using the mean activity concentration (kBq/cc) of six predefined anatomically relevant cortical regions of interests (ROIs) (frontal, temporal, parietal, precuneus, anterior cingulate, and posterior cingulate) with the whole cerebellum used as a reference region. Usually, this ratio is called standardized uptake value ratio (SUVr) because it represents a cortical-to-cerebellum SUVr. For florbetapir 18F, studies showed that SUVr threshold for positivity was set greater than 1.10, based on the upper 95% confidence interval (mean ± 1.96 standard deviation [SD]) of SUVr in a control sample of young healthy participants.[4,5]
Materials and Methods
The comparison was performed on 42 cases, 23 males and 19 females, with the mean age of 72.6 ± 9.9 (mean ± SD) years. The imaging protocols were approved by the institutional review board, and written informed consent was obtained for each enrolled case. The average injected dose of florbetapir 18F was 369.0 ± 34.2 (mean ± SD) in a volume of 10 mL or less. Imaging began 50 min after intravenous injection of florbetapir 18F. Data were reconstructed using the vendor's reconstruction software. Standard PET corrections including random, scatter, and attenuation corrections were applied. The magnetic resonance imaging (MRI) data, which were obtained within 3 months of the PET study, were also transferred to the same platform. Various MRI systems were used including Ingenuity (Philips Medical Systems), Signa (GE Medical Systems), Allegra, Avanto and mMR Biograph (Siemens Medical Systems). The majority of the MRI scans were T2 flair scans, but some of them were also T2 star and T1 flair scans. The MRI scans had different resolutions and matrix sizes as coming from different MRI systems. In two cases, the quality of MRI scans was inadequate for PMOD Neuro analysis and was omitted.
Alzheimer's disease neuroimaging initiative
Data used in the preparation of this article were obtained from the Alzheimer's Disease Neuroimaging Initiative (ADNI) database (adni.loni.usc.edu). The ADNI was launched in 2003 as a public-private partnership, led by Principal Investigator Michael W. Weiner, MD. The primary goal of ADNI has been to test whether serial magnetic resonance imaging (MRI), positron emission tomography (PET), other biological markers, and clinical and neuropsychological assessment can be combined to measure the progression of mild cognitive impairment (MCI) and early Alzheimer's disease (AD).
Image analysis
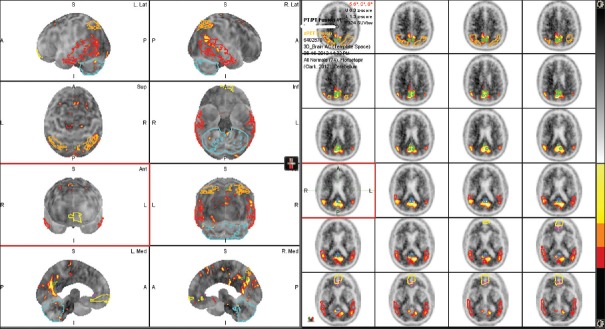
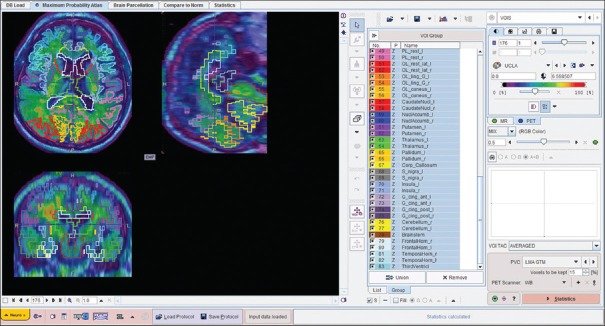
Images were downloaded from LONI (http://www.loni.usc.edu/) system and transferred to two common computer systems. First was a workstation with an MIM Neuro application (MIM Software Inc., Cleveland, OH, USA, Version 6.4). MIM Neuro application has a semiautomatic program for florbetapir 18F SUVr calculation using three standard PET templates such as normal, MCI, and AD template. The program uses data from Clark et al.[6] and is using PET data only [Figure 1]. In addition, the PET scans from each study were visually evaluated and scored as amyloid-positive or amyloid-negative study. The second system has a PMOD Neuro application (PMOD Technologies Ltd., Version 3.5). In addition to PET data, the PMOD Neuro application [Figure 2] uses MRI data to better delineate six targets cortical ROIs (frontal, temporal, parietal, anterior cingulate, posterior cingulate, and precuneus), as well as the cerebellum, to calculate cortical-to-cerebellum SUVr. The PMOD Neuro application reads both PET and MRI studies usually as DICOM studies but can also read other formats. After reading the PET and MRI data, PMOD Neuro application performs segmentation of MRI image into gray matter, white matter and CSF area, matches PET and MRI images, and performs normalization using the tissue probability maps from SPM8 (Wellcome Trust Centre for Neuroimaging, London, UK). It then provides delineation of the brain areas and performs regional analysis for different ROIs. Here, gray matter-weighted volumes of interest (VOI) were based on the anatomical automatic labeling (AAL) atlas[7] to measure tracer uptake in major brain regions. PMOD Neuro also includes the N30R83 Maximum Probability atlas and allows the creation of user-defined atlases.[8] PMOD Neuro prefers high-resolution T1-weighted MRI images for more accurate brain segmentation, but according to our experience, it works with MRI T2 and T1 medium resolution images as well. The final step in PMOD Neuro analysis was saving VOIs statistics and normalizing six targets cortical VOIs SUVs with the whole cerebellar mean uptake.
Figure 1.
Positron emission tomography - template, i.e., MIM approach. Image shows the regions of interests used in standardized uptake value ratio and z-score calculations. If provided, magnetic resonance imaging data were not used for any calculations but just used for surface rendering and better showing the brain regions of interest's
Figure 2.
Fused positron emission tomography and magnetic resonance imaging images of the same case used in magnetic resonance imaging - template (PMOD Neuro) approach with final regions of interests obtained from magnetic resonance imaging image brain parcellation. The regions of interests were applied to the positron emission tomography images
Statistical analyses
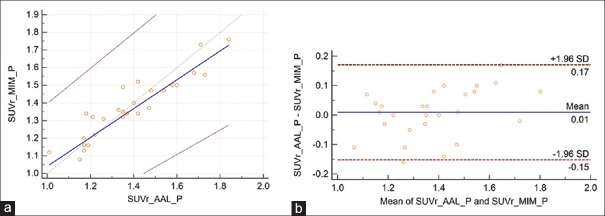
The Passing–Bablok regression scatter diagram with the regression line (solid line), the confidence intervals for the regression line (dashed lines), and identity line (x = y, dotted line) were used to compare SUVr values obtained by both the methods.[9] A Spearman's rank correlation coefficient (ρ) was also reported. The Bland and Altman method[10] was used to analyze the difference between SUVr values obtained with these two approaches and to test the repeatability of these results. The repeatability coefficient was calculated as 1.96 times the SD of the differences.[11] The SUVr data are reported as mean ± SD. For comparison, the repeatability coefficient was also given as a percentage of the average values of the SUVr obtained by these two approaches. To compare cortical regional SUVr values between the two approaches and to compare regional uptake differences for both quantification methods, we used the Mann–Whitney statistical tests. The threshold for significance was set at P < 0.05.
Results
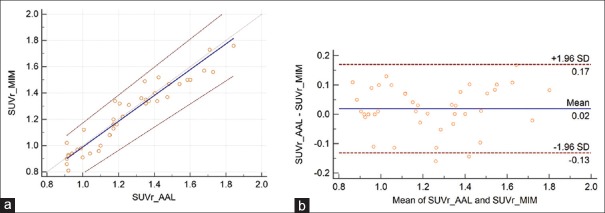
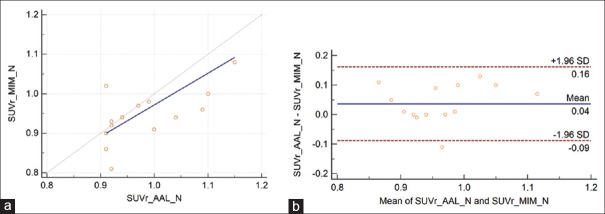
For all 42 cases, the average SUVr values for MIM and PMOD applications were 1.24 ± 0.26 and 1.22 ± 0.25, respectively, with a mean difference of 0.02 ± 0.15. The repeatability coefficient was 0.15 (12.3% of the mean). The Spearman's rank correlation coefficient was very high, ρ = 0.96 [Figure 3]. For amyloid-negative cases, average SUVr values were lower than all group SUVr average values, 0.96 ± 0.07 and 1.00 ± 0.09, for MIM and PMOD applications, respectively. The mean difference was 0.04 ± 0.12, the repeatability coefficient was 0.12 (12.9% of the mean), and the Spearman's rank correlation coefficient was modest, ρ = 0.55 [Figure 4]. For amyloid-positive patients, the average SUVr values were higher than the same all group values, 1.34 ± 0.16 and 1.35 ± 0.20, respectively, with a mean difference of 0.01 ± 0.16. The repeatability coefficient was 0.16 (11.9% of the mean). The Spearman's rank correlation coefficient was high ρ = 0.93 [Figure 5].
Figure 3.
(a) The Passing–Bablok regression scatter diagram with the regression line (solid line), the confidence interval for regression line (dashed lines), and identity line (x = y, dotted line) for standardized uptake value ratio values was obtained from both methods and from all the 42 cases. Standardized uptake value ratio AAL denotes the values obtained using PMOD Neuro approach and anatomical automatic labeling atlas and standardized uptake value ratio MIM values obtained using MIM approach (n = 42, ρ = 0.96). (b) Bland–Altman plot for all 42 cases, with a mean difference of 0.02 ± 0.15. The repeatability coefficient was 0.15 (12.3% of the mean)
Figure 4.
(a) The Passing–Bablok regression scatter diagram with the regression line (solid line), the confidence interval for regression line (dashed lines), and identity line (x = y, dotted line) for standardized uptake value ratio values was obtained from both methods and 15 amyloid-negative cases. Standardized uptake value ratio AAL denotes values obtained using PMOD Neuro approach and anatomical automatic labeling atlas and standardized uptake value ratio MIM values obtained using MIM approach (n = 15, ρ = 0.55). (b) Bland–Altman plot for amyloid-negative cases, with a mean difference of 0.04 ± 0.12. The repeatability coefficient was 0.12 (12.9% of the mean)
Figure 5.
(a) The Passing–Bablok regression scatter diagram with the regression line (solid line), the confidence interval for regression line (dashed lines), and identity line (x = y, dotted line) for standardized uptake value ratio values obtained from both methods and 27 amyloid-positive cases. Standardized uptake value ratio AAL denotes values obtained using PMOD Neuro approach and anatomical automatic labeling atlas and standardized uptake value ratio MIM values obtained using MIM approach (n = 27, ρ = 0.93). (b) Bland–Altman plot for 27 amyloid-positive cases, with a mean difference of 0.01 ± 0.16. The repeatability coefficient was 0.16 (11.9% of the mean)
For regional cortical SUVr values, there were no significant differences for amyloid-negative cases (frontal P = 0.15, temporal P = 0.21, parietal P = 0.42, precuneus P = 0.19, anterior cingulate P = 0.09, posterior cingulated P = 0.09, and total SUVr P = 0.21). For amyloid-positive cases, there were also no significant differences for the regional cortical SUVr values (frontal P = 0.18, temporal P = 0.33, parietal P = 0.12, precuneus P = 0.17, anterior cingulate P = 0.22, posterior cingulated P = 0.19, and total SUVr P = 0.19). The largest differences for amyloid-negative cases were for posterior and anterior cingulate ROIs. For amyloid-positive cases, the largest differences were for temporal and posterior cingulate ROIs. Frontal and especially parietal values were close for both amyloid-negative and amyloid-positive cases [Figures 6 and 7]. Temporal values were very close for amyloid-negative cases.
Figure 6.
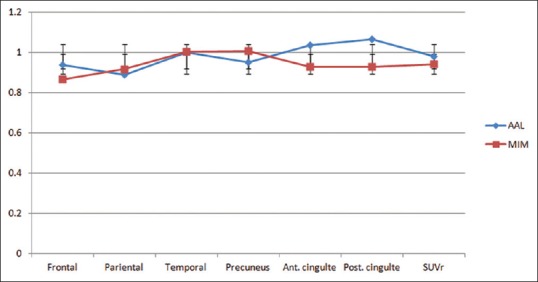
Regional standardized uptake value ratio values for six cortical areas were used to calculate total standardized uptake value ratio values for amyloid-negative cases. There were no statistically significant differences between regional standardized uptake value ratio values (frontal P = 0.15, temporal P = 0.21, parietal P = 0.42, precuneus P = 0.19, anterior cingulate P = 0.09, posterior cingulated P = 0.09, and total standardized uptake value ratio P = 0.21)
Figure 7.
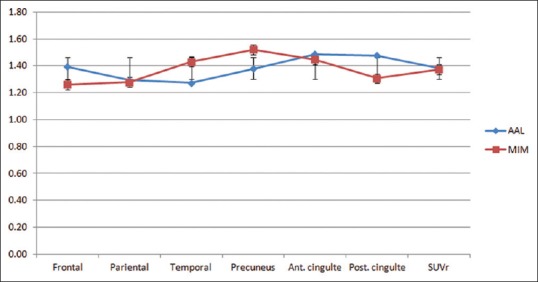
Regional standardized uptake value ratio values for 6 cortical areas were used to calculate total standardized uptake value ratio values for amyloid-positive cases. There were no statistically significant differences between regional standardized uptake value ratio values (frontal P = 0.18, temporal P = 0.33, parietal P = 0.12, precuneus P = 0.17, anterior cingulate P = 0.22, posterior cingulated P = 0.19, and total standardized uptake value ratio P = 0.19)
Discussion
The results for all 42 cases [Figure 3] show excellent correlation between SUVr values and the Bland–Altman plot indicates very good repeatability between these two approaches. Similar results are also derived for amyloid-positive cases [Figure 4]. However, for amyloid-negative patients, the modest Spearman's rank correlation coefficient, ρ = 0.55, resulted from the limited number of cases (n = 15) and three outliners. For these three cases, PMOD SUVr values were 0.909, 0.910, and 0.915 and corresponding MIM SUVr values were 1.01, 0.86, and 0.81. These differences in SUVr values are clinically irrelevant and far below the 1.10 threshold for florbetapir 18F amyloid-positive scans.
A previous study[12] reported that all cortical ROIs SUVr values were slightly higher for the PET template-based approach than the MRI template-based approach. However, the approaches were not the same as ours, i.e., the authors did not use MIM or PMOD Neuro but rather developed their own similar approaches. Our comparison between MIM and PMOD Neuro regional SUVr values did not show a tendency for these values to be statistically different (the probabilities were P > 0.05). The variability between different area SUVr values was close, and there were no significant differences in variability between these two approaches [Figures 6 and 7]. However, the aim of the paper is to compare total SUVr values rather than regional cortical SUVr values, which are strongly affected by the small size of some cortical ROIs and by the limited number of cases for amyloid-positive and amyloid-negative cases. These differences may explain the difference between our study and the previously reported study.[12]
In clinical application, MIM approach seems to be easier and faster. In addition, MIM is PET template based and does not require MRI images. The PMOD Neuro approach is more time consuming because it reads both PET and MRI images, segments MRI images, matches PET and MRI images, and normalizes and creates brain VOIs using MRI images. The PMOD Neuro approach allows summations of VOIs in AAL atlas, which can significantly speed up the procedure. For research purposes, it seems that this approach creates more accurate VOIs, is flexible, and allows interaction and corrections. In addition, the PMOD Neuro approach is tracer independent, while the MIM approach is specifically designed for florbetapir 18F only and uses florbetapir 18F PET templates. However, both approaches accurately assess the cortical distribution of florbetapir 18F and can be used for SUVr calculations.
Conclusion
Our results demonstrate that the SUVr values were derived using MIM and PMOD Neuro applications are effectively interchangeable and well correlated. The PET template-based quantification (MIM approach) is more clinically friendly and easier to use, but exclusively applies for 18F florbetapir. The MRI-based quantification (PMOD Neuro approach) better delineates individual regions of the brain, can be used with any tracer, and therefore is more suitable for research.
Disclaimer*
Data used in the preparation of this article were obtained from the Alzheimer's Disease Neuroimaging Initiative (ADNI) database (http://adni.loni.usc.edu/). As such, the ADNI investigators contributed to the design and implementation of ADNI and/or provided data, but did not participate in the analysis or writing of this report. A complete listing of ADNI investigators can be found at: http://adni.loni.usc.edu/wp-content/uploads/how_to_apply/ADNI_Acknowledgement_List.pdf .
Financial support and sponsorship
Nil.
Conflicts of interest
There are no conflicts of interest.
Acknowledgments
Data collection and sharing for this project was funded by the Alzheimer's Disease Neuroimaging Initiative (ADNI) (National Institutes of Health Grant U01 AG024904) and DOD ADNI (Department of Defense award number W81XWH-12-2-0012). ADNI is funded by the National Institute on Aging, the National Institute of Biomedical Imaging and Bioengineering, and through generous contributions from the following: AbbVie, Alzheimer's Association; Alzheimer's Drug Discovery Foundation; Araclon Biotech; BioClinica, Inc.; Biogen; Bristol-Myers Squibb Company; CereSpir, Inc.; Cogstate; Eisai Inc.; Elan Pharmaceuticals, Inc.; Eli Lilly and Company; EuroImmun; F. Hoffmann-La Roche Ltd and its affiliated company Genentech, Inc.; Fujirebio; GE Healthcare; IXICO Ltd.; Janssen Alzheimer Immunotherapy Research & Development, LLC.; Johnson & Johnson Pharmaceutical Research & Development LLC.; Lumosity; Lundbeck; Merck & Co., Inc.; Meso Scale Diagnostics, LLC.; NeuroRx Research; Neurotrack Technologies; Novartis Pharmaceuticals Corporation; Pfizer Inc.; Piramal Imaging; Servier; Takeda Pharmaceutical Company; and Transition Therapeutics. The Canadian Institutes of Health Research is providing funds to support ADNI clinical sites in Canada. Private sector contributions are facilitated by the Foundation for the National Institutes of Health (www.fnih.org). The grantee organization is the Northern California Institute for Research and Education, and the study is coordinated by the Alzheimer's Therapeutic Research Institute at the University of Southern California. ADNI data are disseminated by the Laboratory for Neuro Imaging at the University of Southern California.
References
- 1.Klunk WE, Engler H, Nordberg A, Wang Y, Blomqvist G, Holt DP, et al. Imaging brain amyloid in Alzheimer's disease with Pittsburgh compound-B. Ann Neurol. 2004;55:306–19. doi: 10.1002/ana.20009. [DOI] [PubMed] [Google Scholar]
- 2.Rowe CC, Villemagne VL. Brain amyloid imaging. J Nucl Med. 2011;52:1733–40. doi: 10.2967/jnumed.110.076315. [DOI] [PubMed] [Google Scholar]
- 3.Wong DF, Rosenberg PB, Zhou Y, Kumar A, Raymont V, Ravert HT, et al. In vivo imaging of amyloid deposition in Alzheimer disease using the radioligand 18F-AV-45 (florbetapir [corrected] F 18) J Nucl Med. 2010;51:913–20. doi: 10.2967/jnumed.109.069088. [DOI] [PMC free article] [PubMed] [Google Scholar]
- 4.Clark CM, Pontecorvo MJ, Beach TG, Bedell BJ, Coleman RE, Doraiswamy PM, et al. Cerebral PET with florbetapir compared with neuropathology at autopsy for detection of neuritic amyloid-ß plaques: A prospective cohort study. Lancet Neurol. 2012;11:669–78. doi: 10.1016/S1474-4422(12)70142-4. [DOI] [PubMed] [Google Scholar]
- 5.Joshi AD, Pontecorvo MJ, Clark CM, Carpenter AP, Jennings DL, Sadowsky CH, et al. Performance characteristics of amyloid PET with florbetapir F 18 in patients with Alzheimer's disease and cognitively normal subjects. J Nucl Med. 2012;53:378–84. doi: 10.2967/jnumed.111.090340. [DOI] [PubMed] [Google Scholar]
- 6.Clark CM, Schneider JA, Bedell BJ, Beach TG, Bilker WB, Mintun MA, et al. Use of florbetapir-PET for imaging beta-amyloid pathology. JAMA. 2011;305:275–83. doi: 10.1001/jama.2010.2008. [DOI] [PMC free article] [PubMed] [Google Scholar]
- 7.Tzourio-Mazoyer N, Landeau B, Papathanassiou D, Crivello F, Etard O, Delcroix N, et al. Automated anatomical labeling of activations in SPM using a macroscopic anatomical parcellation of the MNI MRI single-subject brain. Neuroimage. 2002;15:273–89. doi: 10.1006/nimg.2001.0978. [DOI] [PubMed] [Google Scholar]
- 8.User's Guide PMOD Neuro Tool. [Last accessed on Jan 27]. Available from: http://www.pmod.com/files/download/v35/doc/PDF/PNEURO.pdf .
- 9.Passing H, Bablok W. A new biometrical procedure for testing the equality of measurements from two different analytical methods. Application of linear regression procedures for method comparison studies in clinical chemistry, Part I. J Clin Chem Clin Biochem. 1983;21:709–20. doi: 10.1515/cclm.1983.21.11.709. [DOI] [PubMed] [Google Scholar]
- 10.Bland JM, Altman DG. Statistical methods for assessing agreement between two methods of clinical measurement. Lancet. 1986;1:307–10. [PubMed] [Google Scholar]
- 11.I: Guide for the Determination and Reproducibility for a Standard Test Method. London, U.K: British Standards Institution; 1976. Precision of Test Methods; pp. 54–97. [Google Scholar]
- 12.Saint-Aubert L, Nemmi F, Péran P, Barbeau EJ, Payoux P, Chollet F, et al. Comparison between PET template-based method and MRI-based method for cortical quantification of florbetapir (AV-45) uptake in vivo. Eur J Nucl Med Mol Imaging. 2014;41:836–43. doi: 10.1007/s00259-013-2656-8. [DOI] [PMC free article] [PubMed] [Google Scholar]


