

Abstract
Objectives
To investigate variation in caregiver preferences for their child’s attention-deficit/hyperactivity disorder (ADHD) care and to determine if their stated preferences align with current care management.
Methods
Caregivers of a child aged four to 14 years-old and in care for ADHD were recruited from pediatric outpatient clinics and advocacy groups across the state of Maryland. Participants completed a survey collecting demographics, the child’s treatment, and caregiver preferences – elicited using a best-worst scaling experiment (case 2). Latent class analysis was used to identify distinct preference segments and bivariate analyses were used to compare the association between segment membership with what the child is currently receiving for their ADHD.
Results
Participants (N=184) were predominately white (68%) and the child’s mother (84%). Most children had ADHD for two or more years (79%). Caregiver preferences were distinguished by two segments: Continuous Medication (36%) and Minimal Medication (64%). The two groups had very different preferences for when a medication treatment was administered (p<0.001), but they had similar preferences for provider-oriented and non-medication interventions (p>0.05 for the caregiver behavior training, provider communication, provider specialty and out-of-pocket costs). One-third of the sample did not receive the preferred individual education program and 42% of the minimal medication group reported using medication 7 days a week all year round.
Conclusions
Although behavior management training and school accommodations aspects of an ADHD care plan are more important to caregivers that evidence-based medication treatment, fewer families had access to educational accommodations. Further research is needed to clarify how stated preferences for care align with treatments used in actual practice settings.
1. INTRODUCTION
Attention-deficit/hyperactivity disorder (ADHD), estimated to be prevalent in as many as 11% of US school-aged children [1], is a pediatric neurodevelopmental disorder with a care management plan that is supported by an extensive evidence-base from randomized clinical trials [2, 3]. A comprehensive care management plan involves stimulant medication, child behavior management, and parent behavior training [4]. Treatment may be provided by a primary care versus mental health specialist, different parent-provider communication strategies may be considered to support behavior management, and treatment may occur in multiple settings (e.g. in-home, school, clinic). Further, effective ADHD management requires a strong therapeutic alliance between the families and providers [5], and ongoing coordination between the school and home [6]. Unfortunately, the treatment effects from clinical trials often are not observed in clinical practice [7] and treatment non-adherence is common [8].
Parental and caregiver treatment preference is an important factor influencing decisions to initiate and continue with an evidence-based treatment [9–15]. Families approach care from varied perspectives, ranging from those that desire solely pharmacologic treatment to those who are ambivalent towards any treatment [14], and these views can influence treatment adherence. A better understanding of caregivers’ priorities for multimodal ADHD management strategies would help providers in negotiating family-centered care approaches for optimal medical management.[16] Prior studies have been instrumental in identifying the context under which families are hesitant to engage in treatment for their child’s ADHD, but few have explored how families’ perspectives may be incorporated into treatment planning. The American Academy of Pediatrics recent policy statement emphasizes the need to incorporate family preferences in treatment planning [5] and pediatric ADHD is a clinical condition where it is especially important to assess patient preferences given the range of care management options available. However, few studies have investigated preferences for different modes of delivering ADHD treatment interventions such that a family would be comfortable with the treatment and, hopefully, stay engaged in care. In one such study, families were asked about preferences for a low, moderate, high dose of medication and behavior management [17]. This provides greater depth of the intensity of care that a family would be comfortable with, but more detailed information is needed on preferences for different modalities of care delivery that providers could use to better negotiate treatment plans with families.
Choice-based methods, such as discrete choice experiments (DCE), have advanced current understanding of parents’ and/or caregivers’ preferences for management approach of their child’s ADHD, which mainly focused on medication or behavioral interventions [17–23]. However, parents and caregivers value a broad-based approach to ADHD care management [12, 22, 24–27], which often involves school accommodations, parent training, and a pediatric or child psychiatry specialty provider. Yet far less is known about preferences for these attributes. Moreover, preference studies generally viewed caregivers as a homogenous group, but given the literature on health disparities[14, 10], it is quite plausible that this is not the case. Finally, most research has assessed preferences for or against medication or behavior therapy as a whole, without considering whether variation in mode of delivery would be more or less acceptable. Given these gaps in research on preferences for ADHD care management, the present study aimed to investigate variation in preferences for specific modes of care delivery within an ADHD care management plan that included school accommodations, medication administration, caregiver-provider communication, and cost of care.
2. METHODS
2.1) Study Design and Sample Recruitment
A cross-sectional survey was conducted face-to-face with the primary caregiver of a child aged four to 14 years with ADHD and whose child was currently in care i.e. managed by a health care professional for his/her ADHD at the time of the study. The sample was recruited from primary care and specialty mental health clinics, caregiver support groups, and parent support teams within the public school system throughout the state of Maryland. Caregivers who were unable to speak English or could not provide written consent due to a cognitive impairment were excluded. Written informed consent was obtained from all caregivers prior to enrollment and each enrolled caregiver received a $25 gift card as compensation for their time. Flyers describing the study and providing the research team’s contact information were distributed to participating recruitment sites. An in-person meeting with those who contacted the research team was scheduled to obtain informed consent and to administer the survey instrument. The University of Maryland Institutional Review Board approved the study protocol.
2.2) Survey Instrument
Demographic Characteristics
The survey collected information on caregivers’ self-reported information included age, gender, race, educational attainment, occupation, marital status, insurance type, and annual household income. Caregivers also provided information on their child’s age, gender, duration of ADHD diagnosis, medications that their child is currently using, and whether their child was receiving therapy for ADHD.
Assessment of Stated Preferences: Best-Worst Scaling (BWS)
A Best-Worst Scaling (BWS) case 2 experiment was designed to assess caregivers’ preferences in accordance with good research practices guidelines for discrete choice experiments [28]. BWS techniques are increasingly used in health services research to understand treatment preferences [29, 30]. Compared to standard Likert-type items, BWS techniques improve discriminatory power while compared to other choice-based approaches such as discrete choice experiments (DCE), BWS techniques reduce cognitive demand [30–32]. Further, the BWS technique places greater emphasis on the relative importance of individual items while DCEs emphasizes trade-offs among different items [31]. Since the purpose of this study is to examine how caregivers value the different components of their child’s ADHD treatment (as opposed to looking at the tradeoffs between medication side effects and treatment efficacy), we felt that BWS was the most appropriate method. We assessed seven attributes: medication administration, location where behavior therapy was received, specialty of the provider who was managing the ADHD, accommodations at school, method of communication with provider, method of caregiver behavior training received, and monthly out-of-pocket costs. Each attribute was varied across three levels that reflected possible care delivery options. Of note, school accommodations can range from caregivers receiving a progress note sent by the teacher, the child getting a tutor at school, or the child receiving a 504/Individual Educational Program (IEP) plan. In the United States, children with a qualified disability, such as ADHD, are eligible by law, for an IEP or 504 plans in his/her elementary or secondary school. These specialized accommodations were intended to ensure that each child has equal learning opportunities in a regular classroom.
This 3^7 BWS experiment was constructed based on a main effects, orthogonal array from the SAS database[33]. This design is balanced i.e. all attribute levels appear the same number of times, and orthogonal i.e. all pairs of attribute levels appear the same number of times, and thus, have optimal efficiency. The BWS experiment comprised 18 profiles and each profile can be thought of as a hypothetical ADHD care management profile resembling a comprehensive multi-modal care plan that caregivers might encounter in a real world setting (Figure 1). Within each profile, participants selected the one ‘best’ and the one ‘worst’ attribute based on his/her preference. This instrument was developed using extensive input from caregivers and specific details about development process and pilot results have been published elsewhere [27]. Following feedback from the 37 individuals who participated in the BWS instrument pilot test, the attribute levels of the monthly out-of-pocket costs were revised from $150, $300, and $450 to $50, $150, and $450, respectively. Several participants noted that the lowest level of $150 per month was not realistic, and we needed to provide a greater spread in the range of costs. The upper limit of $450 was retained since some individuals incur high expenses for their child’s care.
Figure 1.
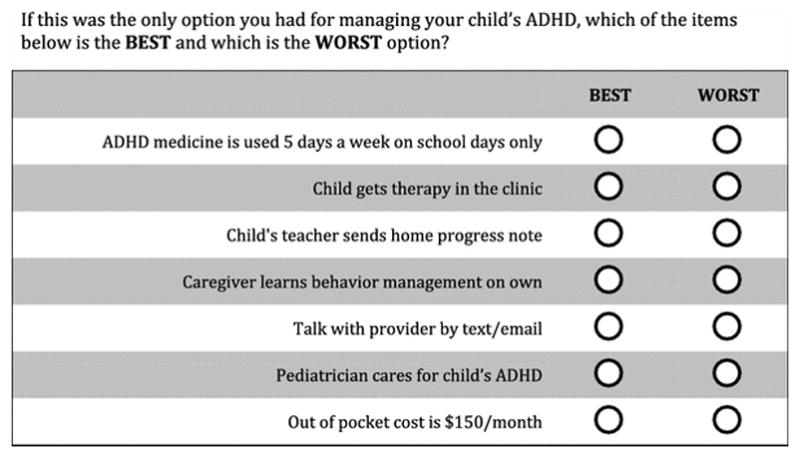
Example of one of the 18 choice profiles shown in the BWS
Current ADHD Care Management
Seven multiple-choice questions collected information about the current ADHD care management plan for his/her child. To permit comparison of preferences for care with current care management, the questions reflected the seven attributes and levels assessed in the BWS instrument. Each question had four response options, with the first three options corresponding to each of the three attribute levels in the BWS instrument, and the last option allowed for an ‘other’ selection to specify any other variant in care delivery.
Caregiver Strain Questionnaire Short Form (CGSQ-SF)
The CGSQ-SF is a 10-item scale used to assess the burden experienced by caregivers in the past month while caring for their child [34]. Items are assessed on a five-point scale and summarized into a single score, where a higher score indicates more strain. Psychometric properties of the scale have been previously assessed [34] and the Cronbach’s alpha, evaluating internal consistency, in our sample was 0.89.
Therapeutic Alliance Quality Scale (TAQS)
The TAQS (caregiver version) assessed caregivers’ bond, agreement with, and perceived helpfulness of their child’s provider [35]. The TAQS has 10 items, rated using a 5-point scale, are summed into a global score where a higher score represents a greater alliance.[35] Psychometric properties of the TAQS is well-supported and the Cronbach’s alpha in our sample was 0.93.
2.3) Data Analysis
Descriptive statistics characterized the sample. To examine preference heterogeneity, a latent class analysis was performed to identify distinct preference segments using LatentGold Choice ® 5.0. The LatentGold Choice® 5.0 software uses a combination of Expectancy Maximization and Newton-Raphson algorithms [36] to compute segment-specific estimates and posterior probabilities of segment membership. A scale factor, which is derived from the individual’s variance, was incorporated in the latent class analysis to adjust for individual variability in the consistency of responses [37].
Initially, one-, two-, three-, four-, and five-segment models were examined to determine which best fit the data. To avoid arriving at an unrepresentative local solution, we replicated the models 10 times with different start seeds. Bayesian Information Criterion (BIC), Akaike Information Criterion (AIC), and the Consistent AIC (CAIC) were used to compare relative fit of the models, where a lower value implies a better fit [38]. We also considered theoretical interpretability, meaning the latent subgroups displayed logical and clinically relevant differences [38]. Part-worth utility coefficients estimated with effects-coding for each attribute level permit comparisons of preference across levels within an attribute. A higher coefficient implies a stronger preference. Wald statistics were used to test if the differences in the coefficients of individual attributes were statistically significant across segments. Bivariate statistics were used to test for differences in the caregiver’s and the child’s characteristics across segments.
To compare the relative influence of each attribute on stated preferences, conditional attribute importance scores were calculated by rescaling the range of utilities across the three levels within an attribute to a percentage of the sum of utilities ranges across all attributes [17]. In other words, the difference between the highest and the lowest utility coefficients (i.e., range) within each attribute is divided by the sum of the ranges between highest and lowest utility coefficient across all attributes, and multiplied by 100. The higher the percent contribution to the total variability, the more sensitive choices were to variation in the levels of each attribute.
3. RESULTS
3.1) Sample Characteristics
Between January 2013 and March 2015, a total of 302 caregivers expressed interest for the study and ultimately 184 were enrolled, for a 61% response rate. Reasons for lack of response were that some had changed their minds and did not want to participate, others were too busy at the time, or they were unable to be reached to schedule a time to complete the study assessments.
Characteristics of the caregivers in our study sample are presented in Table 1. The study sample is predominantly white (68%), married (65%), the mother of the child (84%), college-educated (76%) and currently working (70%). Most caregivers reported on children who were male (72%), less than 10 years old (51%), and had ADHD for at least 2 years (79%).
Table 1.
Characteristics of the 184 Caregivers in Study Sample
| Caregiver Characteristics | Overall N (%) |
|---|---|
| Race | |
| White | 125 (68) |
| African-American/Black | 46 (25) |
| Other | 13 (7) |
| Age | |
| 27–40 years | 88 (48) |
| 41–50 years | 73 (40) |
| 51–70 years | 23 (12) |
| Relation to the Child | |
| Mother | 155 (84) |
| Other | 29 (16) |
| Marital Status | |
| Married | 119 (65) |
| Never Married/Divorced/Widowed | 65 (35) |
| Education | |
| High school or less | 44 (24) |
| College and above | 140 (76) |
| Annual Household Income | |
| ≤$50k | 68(37) |
| >$50k | 116 (63) |
| Occupation | |
| working | 129 (70) |
| not working | 55 (30) |
| Insurance Type | |
| Private | 101 (55) |
| Public | 83 (45) |
| Child Characteristics | |
| Age | |
| <10 years | 91(51) |
| 10 years or older | 93 (49) |
| Gender* | |
| Male | 130 (73) |
| Female | 48 (27) |
| Duration of ADHD | |
| ≤ 1 year | 38 (21) |
| 2 – 3 years | 66 (36) |
| > 4 years | 80 (43) |
Data on gender of 6 children are missing;
3.2) Latent Class Analysis and Model Selection
Although fit indices improved with increased number of latent classes, a two-segment solution was selected based on the theoretical interpretability. For example, in the three-segment solution, two of the segments did not demonstrate meaningfully distinguishable preferences and the relative attribute importance was also similar. Fit indices for the one to five class model solutions are presented in Appendix Table 1. A detailed discussion of the results from the scale-adjusted latent class analyses is provided in the Appendix.
3.3) Care Management Preference Segments and Relative Attribute Importance
Scale-adjusted the utility coefficients are presented in Table 2. Considering the coefficients, one segment was labeled continuous medication (N=67) and the other segment was labeled minimal medication (N=117). Effects-coded utility coefficients (U) and Z-scores (Z) for each segment are presented in Table 2. The Wald tests indicated that differences in the attribute levels’ coefficients across segments were statistically significant for: days of medication administration (p<0.001), location of therapy (p=0.012), and school accommodation (p=0.014). Among the continuous medication caregivers, medication use seven days a week all year round was the most preferred (U=1.39, Z=5.43, SE=0.06) while among the minimal medication caregivers, medication use five days a week on school days only (U=0.60, Z=7.42, SE=0.08), was preferred over the other levels of medication administration. Both segments prefer receiving therapy for his/her child in a clinic setting, obtaining an individualized education program (IEP) in school, learning behavior management techniques one-on-one with a therapist, talking face-to-face with the provider, having both a pediatrician and psychiatrist care for his/her child’s ADHD, and having lower out of pocket costs ($50/month). Of note, the utility coefficients for the 3 levels of the cost attributes were evenly spaced, implying that respondents may not have been sensitive to the absolute cost levels. It is possible that respondents viewed the levels as “low”, “medium” and “high” OOP costs.
Table 2.
Effects-coded Utility Coefficients and Z Values for the Two Identified Latent Segments
| Latent Class Segment | |||||||
|---|---|---|---|---|---|---|---|
|
|
|||||||
| Overall (N=184) | Continuous Medication (N=67) | Minimal Medication (N= 117) | |||||
| Attributes and Attribute Levels | U (SE) | Z-score | U | Z-score (SE) | U | Z-score (SE) | P value |
| Medication Administration | <0.001 | ||||||
| ADHD medicine is used 5 days a week on school days only | 0.01 (0.05) | 0.17 | −0.73 (0.09) | −7.99 | 0.60 (0.08) | 7.42 | |
| ADHD medicine is used 7 days a week except in summer | −0.31 (0.05) | −6.67 | −0.66 (0.09) | −7.57 | −0.16 (0.06) | −2.82 | |
| ADHD medicine is used 7 days a week all year round | 0.30 (0.06) | 5.43 | 1.39 (0.14) | 9.70 | −0.44 (0.08) | −5.83 | |
| Behavior Therapy Location | 0.012 | ||||||
| Child gets therapy in the clinic | 0.15 (0.05) | 3.43 | 0.15 (0.08) | 1.89 | 0.16 (0.06) | 2.48 | |
| Child gets therapy in school | −0.11 (0.05) | −2.51 | 0.06 (0.08) | 0.79 | −0.23 (0.07) | −3.41 | |
| Child gets therapy at home | −0.04 (0.05) | −0.91 | −0.22 (0.08) | −2.71 | 0.07 (0.07) | 1.03 | |
| School Accommodation | 0.014 | ||||||
| Child’s teacher sends home progress note | −0.36 (0.05) | −7.46 | −0.32 (0.08) | −3.98 | −0.41 (0.07) | −5.86 | |
| Child gets a tutor at school | −0.10 (0.04) | −2.22 | −0.28 (0.08) | −3.63 | 0.02 (0.06) | 0.36 | |
| Child has an IEP | 0.45 (0.05) | 8.72 | 0.60 (0.10) | 6.06 | 0.38 (0.08) | 5.13 | |
| Caregiver Behavior Training | |||||||
| Caregiver learns behavior management on own | −0.78 (0.06) | −14.04 | −0.68 (0.09) | −7.38 | −0.89 (0.08) | −11.11 | 0.280 |
| Caregiver learns behavior management by talking one-on-one to therapist | 0.73 (0.06) | 13.22 | 0.69 (0.09) | 7.53 | 0.84 (0.08) | 10.73 | |
| Caregiver learns behavior management by going to a class | 0.05 (0.04) | 1.19 | −0.01 (0.07) | −0.12 | 0.05 (0.06) | 0.84 | |
| Provider Communication | 0.094 | ||||||
| Talk with provider by text/email | −0.31 (0.04) | −6.98 | −0.20 (0.08) | −2.51 | −0.39 (0.06) | −6.28 | |
| Talk with provider by phone | −0.10 (0.04) | −2.49 | −0.07 (0.07) | −0.96 | −0.12 (0.06) | −2.04 | |
| Talk with provider face-to-face | 0.41 (0.05) | 8.87 | 0.27 (0.08) | 3.23 | 0.51 (0.07) | 7.68 | |
| Provider Specialty | 0.079 | ||||||
| Pediatrician cares for child’s ADHD | −0.49 (0.05) | −9.78 | −0.28 (0.10) | −2.79 | −0.58 (0.07) | −7.80 | |
| Psychiatrist cares for child’s ADHD | 0.12 (0.04) | 2.63 | 0.05 (0.09) | 0.54 | 0.15 (0.07) | 2.28 | |
| Pediatrician and psychiatrist care for child’s ADHD | 0.37 (0.05) | 7.91 | 0.23 (0.08) | 2.84 | 0.43 (0.06) | 6.66 | |
| Monthly Out-of-Pocket Costs | 0.200 | ||||||
| $50/month | 0.78 (0.06) | 13.62 | 0.73 (0.10) | 7.47 | 0.88 (0.08) | 10.37 | |
| $150/month | 0.03 (0.04) | 0.75 | −0.04 (0.07) | −0.56 | 0.04 (0.05) | 0.80 | |
| $450/month | −0.81 (0.06) | −14.18 | −0.69 (0.09) | −7.46 | −0.92 (0.09) | −10.81 | |
U= Utility coefficients; Z= Z scores, SR= standard error. Effects-coded utility coefficients allow for comparisons of preference for different attribute levels within the same attribute, where a higher coefficient implies a stronger preference. Bolded values indicated the most preferred attribute level within an attribute.
Relative attribute importance scores, stratified by segments, are illustrated in Figure 2. For the continuous medication segment, medication administration had the highest importance score (29.6%), implying that variations in medication use had the largest influence on caregivers’ preferences. Mode of caregiver’s training (22.6%) and monthly out-of-pocket costs (23.5%) were more important than days of medication administration (13.6%) for the minimal medication segment. In addition, type of school accommodation for the child’s ADHD was relatively more important among the caregivers in the continuous medication segment than among caregivers in the minimal medication segment. Overall, considering the utility coefficients and relative importance, the caregivers in the continuous medication segment appeared to be more medication focused, while those in the minimal medication segment appeared to prefer less use of medication and were more focused on parent-provider attributes.
Figure 2. Conditional Attribute Importance Scores of ADHD Care Management Modalities.
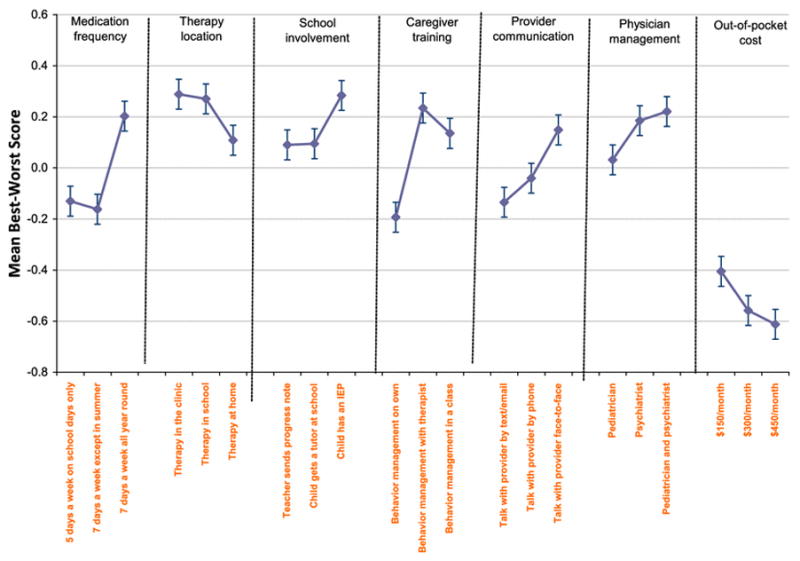
Red: Minimal Medication, Blue: Continuous Medication
Importance scores were calculated by rescaling the range of utilities across the three levels within an attribute to a percentage of the sum of utilities ranges across all attributes. The higher the percent contribution to the total variability, the more sensitive choices were to variation in the levels of each attribute.
3.4) Characteristics of Preference Segments
The demographic characteristics of the caregiver and child as well as the child’s clinical profile for each segment are presented in Table 3. Compared to the continuous medication segment, a significantly larger proportion of the minimal medication segment is White, privately-insured, and reported higher levels of strain according to the mean CGSQ scores (p<0.05). TAQS scores did not differ significantly across segments, indicating that caregivers’ perceptions of agreement with and helpfulness of their child’s provider are similar. Significantly more of the continuous medication segment’s children were using medication at the time of the survey compared to the minimal medication segment (96% versus 81%; p=0.007). About one-third of the children in both segments did not receive an individualized education plan (IEP) at school. Additional details about the current treatment characteristics of both segments are in Appendix Table 4.
Table 3.
Caregiver and Child Characteristics Stratified by Latent Class Segments
| Caregiver Characteristics | Continuous Medication (N=67) | Minimal Medication (N=117) | |
|---|---|---|---|
| N (%) | N (%) | P value | |
| Race | 0.040 | ||
| White | 42 (62.7) | 83 (70.9) | |
| African-American/Black | 23 (34.3) | 23 (19.7) | |
| Other | 2 (3.0) | 11 (9.4) | |
| Age | 0.100 | ||
| 27–40 years | 30 (44.8) | 58 (49.6) | |
| 41–50 years | 24 (35.8) | 49 (41.9) | |
| 51–70 years | 13 (19.4) | 10 (8.6) | |
| Relation to the Child | 0.148 | ||
| Mother | 53 (79.1) | 102 (87.2) | |
| Other | 14 (20.9) | 15 (12.8) | |
| Marital Status | 0.670 | ||
| Married | 42 (62.7) | 77 (65.8) | |
| Never Married/Divorced/Widowed | 25 (37.3) | 40 (34.2) | |
| Education | 0.477 | ||
| High school or less | 18 (26.9) | 26 (22.2) | |
| College and above | 49 (73.1) | 91 (77.8) | |
| Annual Household Income | 0.179 | ||
| ≤$50k | 29 (43.3) | 39 (33.3) | |
| >$50k | 38 (56.7) | 78 (66.7) | |
| Occupation | 0.096 | ||
| working | 42 (62.7) | 87 (74.4) | |
| not working | 25 (37.3) | 30 (25.6) | |
| Insurance Type | 0.003 | ||
| Private | 27 (40.3) | 74 (63.3) | |
| Public | 40 (59.7) | 43 (36.7) | |
| Child Characteristics | |||
| Age | 0.136 | ||
| <10 years | 29 (43.3) | 64 (54.7) | |
| 10 years or older | 38 (56.7) | 53 (45.3) | |
| Gender* | 0.648 | ||
| Male | 45 (67.1) | 85 (72.7) | |
| Female | 19 (28.4) | 29 (24.8) | |
| Duration of ADHD | 0.475 | ||
| ≤ 1 year | 13 (19.4) | 25 (21.4) | |
| 2 – 3 years | 21 (31.3) | 45 (38.4) | |
| > 4 years | 33 (49.3) | 47 (40.2) | |
| Current ADHD Management | |||
| Medication | 64 (95.5) | 95 (81.2) | 0.007 |
| Therapy | 51 (76.1) | 86 (73.5) | 0.696 |
| IEP* | 43 (64.2) | 73 (62.4) | 0.809 |
| Therapeutic alliance score (TAQS) | 3.86 (0.97) | 3.90 (0.75) | 0.721 |
| Caregiver strain score (CGSQ-SF) | 2.63 (0.9) | 2.93 (0.8) | 0.027 |
Data on gender of 6 children are missing; IEP=individualized education program
4. DISCUSSION
This study provided an opportunity to examine not only the preferred alternative approaches but also the preferred modality of delivery among a community-based sample of caregivers who had a child currently receiving care for ADHD. Although several prior studies have noted a general negative public perception of ADHD medication [9, 13, 15, 14], a key finding of this study was that caregivers were not completely opposed to using medications as part of their child’s ADHD care management, but rather, their preferences for medication use were influenced by the extent of their child’s exposure to medications, as defined by the number of days per week a child took ADHD medicine. We identified two segments of caregivers who differed primarily on their preferences for frequency of medication use. The continuous medication segment preferred medicine 7 days a week, whereas the minimal medication segment, which accounted for 64% of the study sample, preferred medicine use on school days only. Despite studies reporting increased stimulant use among children [39, 40], perceptions and acceptability of ADHD medication remain inconsistent [25, 41–44]. Other investigators have similarly noted that the majority of the caregivers tend to avoid medication while a smaller group focuses on treatment outcomes [17]. Moreover, approximately 42% of the caregivers in the minimal medication segment were using ADHD medication for their child 7 days a week all year round. There are 2 potential explanations for this. For one, caregivers who have concerns about degree of medication exposure may not necessarily be completely opposed to medication, but they may feel more comfortable initiating medication in a more step-wise fashion (e.g. initiate on school days only first) and/or may benefit from more frequent feedback (e.g. teacher rating scales) to inform their ongoing decision making process about medication treatment. In other cases, caregivers sometimes view medication as a way of stabilizing their child’s behavior, obtaining relief from chaos at home, or because of external pressures from the school, as shown from previous qualitative work[12, 45]. Therefore, although caregivers in the minimal medication segment would prefer not to use medication continuously for their child, it is possible that they may have been using medication reluctantly on a continual basis because all other options failed or lack of access to alternative approaches.
Preferences for provider specialty and non-pharmacologic interventions did not differ by segment. Behavioral integration in primary care would facilitate access to mental health professionals who can provide one-on-one caregiver behavior training, which was prioritized by caregivers in this sample. Prior studies have also demonstrated that a considerable portion of caregivers prefer training that is delivered individually [46, 47]. These results have important implications given that inconvenient timing and busy work schedules are the primary reasons for low utilization of group class-based parent training sessions [48]. Stronger preferences for co-management of their child’s ADHD by a psychiatrist and a pediatrician compared to management by either a psychiatrist or pediatrician alone were noted in this study. Few studies have addressed caregiver preferences for collaboration among pediatricians and psychiatrists in managing a child’s ADHD, despite the importance of understanding preferences for specific health care providers for patient-centered service delivery [49]. Further, pediatricians also have expressed interest in colocation with mental health providers to better manage behavioral health problems [50].
This study also examined the extent to which current receipt of ADHD care management is consistent with stated preferences. Caregivers in this sample had strong preferences for an IEP for their child compared to other school accommodations, which implies preference for a structured learning environment. However, about one-third of the caregivers in our study sample did not have an IEP in place for their child. This may be an area of unmet need in their child’s ADHD management as prior research noted the difficulty caregivers have dealing with schools and even when a child has an IEP, schools may not follow the plan [51]. Other studies also have found that families desire school-based interventions as an adjunct to medications but often there is insufficient access to school accommodations [52]. School-based accommodations and interventions are important but often understudied in youth ADHD management [53, 54]. Children with ADHD often exhibit difficulties with school behaviors and performance, and the effectiveness of school interventions on school behavior has long been demonstrated [53, 55]. Given the integral role of school accommodations for children with ADHD, more attention should be paid towards improving access to and implementation of school accommodations.
A major strength of this study was the ability to capitalize on a well-established evidence base for managing pediatric ADHD by including a comprehensive range of attributes in pediatric ADHD management. While previous studies have examined preferences for ADHD treatment, most of them tend to focus only on pharmacological treatment and behavioral therapy [18–20, 56]. This study also examined preferences for school accommodation, provider specialty and caregiver behavioral management training, all of which are important in care coordination in pediatric ADHD. The wide range of attributes permitted a comprehensive evaluation of caregivers’ preferences for a multimodal ADHD management approach. Attributes and attribute levels were derived from caregivers’ input in order to ensure these were salient and relevant care management considerations [27]. By investigating preferences for specific modes of service delivery beyond global acceptability of an intervention, this study offers a nuanced perspective of care delivery options that are most favorable to families.
Clinical Implications
These findings have implications for caregiver decision-making in pediatric ADHD treatment. Caregivers differed in their preference for the intensity of medication exposure that their child receives; i.e. over a third of caregivers surveyed preferred that their child receiving medication daily whereas the remaining majority of caregivers preferred that their child receive “minimal” medication treatment. This suggests that treatment options relevant to degree of medication exposure (e.g. drug holidays, dosing only on school days, use of short versus long-acting stimulant) should be included in the informed consent discussion and may be a critical factor to engaging parents in the treatment decision-making process. In the case of ADHD, it is safe to administer the medication in a discontinuous fashion. Abrupt discontinuation does not tend to cause physical withdrawal symptoms and re-starting medication is usually well tolerated and does not reduce medication efficacy. However, there is no carry over effect from the medication when it is stopped so caregivers are faced with the nuanced decision of how much medication to give to their unique child, taking into account risks and benefits of treatment (e.g. medication side effects) and non-treatment (e.g. increased risk of accidents). Time spent on a more in-depth discussion about risks and benefits about different degrees of medication exposure may be beneficial for family engagement and treatment decision-making as well as to foster a working relationship more likely to elicit accurate reporting of medication adherence.
The findings from this research also identifies non-pharmacological alternative treatment approaches that are especially important for families who prefer less frequent medication use for the management of their child’s ADHD. Caregivers displayed strong preferences for caregiver behavior training and special education school services. However, a substantial proportion of caregivers did not report having these in place. There are health-system barriers to effective communication across providers [57]. Further, these interventions are not universally available in different treatment settings (e.g. primary care versus child mental health specialty care), and providers may not have adequate knowledge or support to facilitate referrals for these services in rural or underserved communities. Therefore, our results demonstrate the need to ensure that providers take time to understand caregiver preferences in this domain and then have the knowledge, skills, and time to either provide, or coordinate with clinicians who can provide, these other interventions.
Study Limitations
Our study findings should be interpreted in light of several limitations. First, the study was based on a single state, convenience sample of caregivers with a child in care for ADHD. Thus, results may not necessarily generalize to all youth with ADHD in the United States. Compared to studies using national surveys, our sample is similar in terms of the children’s age and gender composition and insurance coverage, but may slightly over-represent male children[1, 58]. However, published studies report on the characteristics of children with ADHD and to our knowledge, there are limited population-based studies that document the characteristics of caregivers of children diagnosed with ADHD. Thus, we are unable to draw comparisons between our study participants and caregivers of children with ADHD in the US. Nevertheless, in an attempt to obtain a diverse group of caregivers, participants were recruited from a range of site, including primary care and specialty mental health clinics, caregiver support groups, and parent support teams within the public school system. Additionally, information on severity of ADHD was not available, and so it is not possible to know if the findings generalize to families of children across the spectrum of ADHD severity or if severity of ADHD influences caregivers’ treatment preferences. Our study’s finding of two latent segments with different preferences for their child’s ADHD care was based on a modest sample of 184 caregivers. We cannot exclude the possibility that more or different segments may have been identified with a larger sample size. Preferences were examined at a single time point and it is reasonable to expect preferences will change over the course of illness, particularly since acceptability of medication has been shown empirically to change over time [44]. Nonetheless, our two-segment solution is similar to that reported by Waschbusch et al., who studied newly-diagnosed children with ADHD and observed a medication-avoidant segment and behavior-improvement segment [17]. Measuring caregivers’ preferences is complex as different caregivers may have different preferences based on the roles that they play in the child’s life. The large majority of our sample comprised of mothers of a child with ADHD and it is known that known that a mother-father dyad can share different views on their child’s ADHD[59]. However, the intent of the study was not to assume that the preferences of the caregiver who participated in the study reflected the preferences of all other caregivers in the child’s life. Only adult caregiver preferences were assessed, which might not necessarily reflect adolescents’ preferences [60], and oftentimes adolescents may be involved in decision-making for their own care.
CONCLUSION
Preferences for use of medications remain varied among caregivers managing their child’s ADHD. Other care modality alternatives such as behavior management training and school accommodations are important in ADHD care coordination and as supplements to pharmacotherapy. Of note, preferences for specific treatment attributes differ based on the mode of care delivery. This detailed information may be helpful to providers to better understand alternative non-pharmacological treatment approaches that are preferred by caregivers.
Key Points.
Latent class analysis demonstrated clinically relevant differences in preferences for the way in which a treatment is delivered in actual practice.
Caregivers of a child with ADHD have different preferences for the intensity of medication use
This study found that non-pharmacological aspects of care delivery, such as behavior management training and school accommodations, were preferred to evidence-based medications by caregivers, yet a large proportion of families were not receiving these interventions in community practice settings.
Acknowledgments
Ms. Xinyi Ng coordinated the study, collected, analyzed and interpreted the data and wrote this manuscript. Dr. Susan dosReis conceptualized the study, collected research data, interpreted the research results and edited the manuscript. Dr. John Bridges assisted with the conceptualization of the study, the development of the attributes, created the best-worst scaling instrument design, interpreted the research results, and edited the manuscript. Ms. Melissa Ross assisted with data collection, interpreted the research results and reviewed the manuscript. Dr. Charles Cunningham assisted with the identification of the attributes, conceptualized the study design, and reviewed the manuscript. Both Drs. Gloria Reeves and Emily Frosch contributed to the conceptualization of the study, provided clinical implications to the study findings, and edited the manuscript.
APPENDIX
Appendix Table 1.
Fit Indices for 1- to 5-segment scale-adjusted models
| Number of parameters | Degrees of Freedom | Log- Likelihood (LL) | BIC (based on LL) | AIC (based on LL) | CAIC (based on LL) | |
|---|---|---|---|---|---|---|
| 1-segment | 15 | 169 | −11736.57 | 23551.36 | 23503.13 | 23566.36 |
| 2-segment | 30 | 154 | −11555.24 | 23266.92 | 23170.47 | 23296.92 |
| 3-segment | 45 | 139 | −11482.83 | 23200.34 | 23055.66 | 23245.34 |
| 4-segment | 60 | 124 | −11420.34 | 23153.57 | 22960.68 | 23213.57 |
| 5-segment | 75 | 109 | −11362.76 | 23116.64 | 22875.52 | 23191.64 |
LL=Log-likelihood; BIC=Bayesian Information Criterion; AIC=Akaike Information Criterion; CAIC=Consistent Akaike Information Criterion
Scale-adjustment to Latent Class Analysis
In latent class analysis of choice models, the estimated utility coefficients are generally confounded with a scale parameter, which measures the amount of uncertainty by different respondents[37]. This confounding arises when respondents display different response error variances, and affects the magnitude of the estimated utilities coefficients[37]. Specifically, a smaller variance in response error will result in larger estimated utilities coefficients and vice versa[61]. Therefore, if this variance in response error is not accounted for, we may identify different segments which have essentially the same preferences, but appear to be different due to the stretching or shrinking of the estimated utilities coefficients [61]. In our study, we conducted scale-adjusted latent class analyses using the LatentGold Choice 5.1 software, wherein we incorporated a continuous scale factor i.e. each respondent is assumed to have a unique error variance.
As mentioned in the main manuscript, we estimated one-, two-, three-, four-, and five-segment models (with and without scale adjustment) to determine which best fit the data. The fit indices of all scale-adjusted and unadjusted models are models are shown in Appendix Tables 1 and 2, respectively.
Appendix Table 2.
Fit Indices for 1- to 5-segment models (without scale adjustment)
| Number of parameters | Degrees of Freedom | Log- Likelihood (LL) | BIC (based on LL) | AIC (based on LL) | CAIC (based on LL) | |
|---|---|---|---|---|---|---|
| 1-segment | 14 | 170 | −11803.61 | 23680.22 | 23635.22 | 23694.22 |
| 2-segment | 29 | 155 | −11644.16 | 23439.54 | 23346.31 | 23468.54 |
| 3-segment | 44 | 140 | −11537.44 | 23304.35 | 23162.89 | 23348.35 |
| 4-segment | 59 | 125 | −11463.93 | 23235.55 | 23045.87 | 23294.55 |
| 5-segment | 74 | 110 | −11405.95 | 23197.80 | 22959.89 | 23271.80 |
LL=Log-likelihood; BIC=Bayesian Information Criterion; AIC=Akaike Information Criterion; CAIC=Consistent Akaike Information Criterion
The fit indices improved with scale-adjustment across all latent classes compared to the models without scale adjustment. However, we eventually decided on 2-segment solution after considering theoretical interpretability of the segments. The parameter on the scale factor was statistically significant (0.52, p<0.001), indicating that our scale-adjusted two-segment model was significantly different from the two-segment model without scale adjustment. Parameters estimates for the two-segment without scale adjustment are presented in Appendix table 3.
Appendix Table 3.
Utility coefficients for two-segment model without scale adjustment
| Class1 (24%) | Class2 (76%) | P value | |
|---|---|---|---|
| Medication Administration | <0.001 | ||
| ADHD medicine is used 5 days a week on school days only | −1.21 (0.12) | 0.47 (0.07) | |
| ADHD medicine is used 7 days a week except in summer | −1.05 (0.12) | −0.18 (0.06) | |
| ADHD medicine is used 7 days a week all year round | 2.26 (0.15) | −0.29 (0.07) | |
| Behavior Therapy Location | 0.073 | ||
| Child gets therapy in the clinic | 0.31 (0.13) | 0.15 (0.06) | |
| Child gets therapy in school | 0.03 (0.12) | −0.13 (0.06) | |
| Child gets therapy at home | −0.34 (0.12) | −0.02 (0.06) | |
| School Accommodation | 0.029 | ||
| Child’s teacher sends home progress note | −0.46 (0.12) | −0.43 (0.06) | |
| Child gets a tutor at school | −0.36 (0.12) | −0.05 (0.06) | |
| Child has an IEP | 0.82 (0.13) | 0.48 (0.06) | |
| Caregiver Behavior Training | 0.55 | ||
| Caregiver learns behavior management on own | −0.95 (0.12) | −0.84 (0.06) | |
| Caregiver learns behavior management by talking one-on-one to therapist | 0.96 (0.13) | 0.81 (0.06) | |
| Caregiver learns behavior management by going to a class | −0.01 (0.12) | 0.03 (0.06) | |
| Provider Communication | 0.47 | ||
| Talk with provider by text/email | −0.30 (0.12) | −0.42 (0.06) | |
| Talk with provider by phone | −0.05 (0.12) | −0.11 (0.06) | |
| Talk with provider face-to-face | 0.35 (0.13) | 0.52 (0.06) | |
| Provider Specialty | 0.37 | ||
| Pediatrician cares for child’s ADHD | −0.32 (0.14) | −0.54 (0.06) | |
| Psychiatrist cares for child’s ADHD | 0.04 (0.13) | 0.10 (0.06) | |
| Pediatrician and psychiatrist care for child’s ADHD | 0.28 (0.13) | 0.44 (0.06) | |
| Monthly Out-of-Pocket Costs | 0.41 | ||
| $50/month | 1.03 (0.13) | 0.88 (0.06) | |
| $150/month | −0.11 (0.11) | 0.04 (0.06) | |
| $450/month | −0.92 (0.13) | −0.92 (0.06) |
A higher coefficient implies a stronger preference. Bolded values indicated the most preferred attribute level within an attribute.
Comparing the parameters estimates in Appendix Table 3 to those from the scale-adjusted model, we can draw the similar conclusions regarding the specific modalities of care delivery that caregivers preferred the most within a given attribute. However, we noted that based on the model with scale adjustment, 143 (78%) of the caregivers would be classified under the minimal medication group, while 41 (22%) would be classified under the continuous medication group. Therefore, when we compared the class membership between the scale-adjusted model to the model without scale adjustment, we noted that 26 caregivers from the minimal medication group could be potentially misclassified to the continuous medication group. Nevertheless, assignment of respondents to specific classes is based on probabilistic estimates and we cannot eliminate the possibility of misclassification even with scale adjustment. However, since our scale-adjusted model displayed better fit statistics (Appendix Table 1), we presented the scale-adjusted estimates in our main results.
Appendix Table 4.
Current Treatment Characteristics of Children Stratified by Latent Segments
| Continuous Medication (N=67) N (%) | Minimal Medication (N=117) N (%) | |
|---|---|---|
| Medication frequency | ||
| N/A | 3 (4.5) | 22 (18.8) |
| Using medication 5 days a week on school days only | 0 (0) | 40 (34.2) |
| Using medication 7 days a week except in summer | 5 (7.5) | 6 (5.1) |
| Using medication 7 days a week all year round | 59 (88.0) | 49 (41.9) |
| Location of behavior therapy** | ||
| N/A | 16 (23.9) | 31 (26.5) |
| Getting therapy in clinic | 24 (35.8) | 35 (30.0) |
| Getting therapy in school | 6 (9.0) | 14 (12.0) |
| Getting therapy at home | 3 (4.5) | 9 (7.7) |
| School accommodations** | ||
| N/A | 11 (16.4) | 12 (10.3) |
| Teacher sends home progress note | 41 (61.2) | 62 (53.0) |
| Tutor at school | 8 (11.9) | 15 (12.8) |
| Individualized Education Plan (IEP) | 43 (64.2) | 73(62.4) |
| Caregiver behavior training** | ||
| N/A | 5 (7.5) | 5 (4.3) |
| Learning on own | 39 (58.2) | 67 (57.3) |
| Learning one-on-one with therapist | 38 (56.7) | 74 (63.2) |
| Learning by going to class | 19 (28.3) | 37 (31.6) |
| Communication with provider** | ||
| N/A | 3 (4.5) | 1 (0.8) |
| Text/email | 19 (28.4) | 20 (17.1) |
| Phone | 17 (25.4) | 33 (28.2) |
| Face-to-face | 53 (79.1) | 103 (88.0) |
| Provider specialty | ||
| Other/NA | 3 (4.5) | 15 (12.8) |
| Pediatrician | 24 (35.8) | 36 (30.8) |
| Psychiatrist | 32 (47.8) | 48 (41.0) |
| Both pediatrician and psychiatrist | 8 (11.9) | 18 (15.4) |
| Monthly out-of-pocket (OOP) costs | ||
| $0/unknown | 31 (46.3) | 39 (33.3) |
| $1 – 50 | 16 (23.9) | 27 (23.1) |
| $51 – $150 | 10 (14.9) | 30 (25.6) |
| > $150 | 10 (14.9) | 21 (18.0) |
N/A = Not applicable
Categories are not mutually exclusive, where respondents can select more than 1
Footnotes
5. COMPLIANCE WITH ETHICAL STANDARDS
This study was funded by a grant from the National Institute of Mental Health (R34-MH093502; PI: dosReis) Charles Cunningham’s participation was supported by the Jack Laidlaw Chair in Patient-Centered Health Care. Charles Cunningham receives royalties from workshops and materials for COPE, a large group parenting program. He is a shareholder and receives salary support from BCFPI inc. which provides screening and outcome measures for children and youth. Susan dosReis, Xinyi Ng, John Bridges, Melissa Ross, Gloria Reeves and Emily Frosch have no other conflicts of interests to declare.
References
- 1.Visser SN, Danielson ML, Bitsko RH, Holbrook JR, Kogan MD, Ghandour RM, et al. Trends in the parent-report of health care provider-diagnosed and medicated attention-deficit/hyperactivity disorder: United States, 2003–2011. J Am Acad Child Adolesc Psychiatry. 2014;53(1):34–46. e2. doi: 10.1016/j.jaac.2013.09.001. [DOI] [PMC free article] [PubMed] [Google Scholar]
- 2.National Institute of Mental Health Multimodal Treatment Study of ADHD follow-up: 24-month outcomes of treatment strategies for attention-deficit/hyperactivity disorder. Pediatrics. 2004;113(4):754–61. doi: 10.1542/peds.113.4.754. [DOI] [PubMed] [Google Scholar]
- 3.Wolraich ML, Greenhill LL, Pelham W, Swanson J, Wilens T, Palumbo D, et al. Randomized, controlled trial of oros methylphenidate once a day in children with attention-deficit/hyperactivity disorder. Pediatrics. 2001;108(4):883–92. doi: 10.1542/peds.108.4.883. [DOI] [PubMed] [Google Scholar]
- 4.A 14-month randomized clinical trial of treatment strategies for attention-deficit/hyperactivity disorder. The MTA Cooperative Group. Multimodal Treatment Study of Children with ADHD. Arch Gen Psychiatry. 1999;56(12):1073–86. doi: 10.1001/archpsyc.56.12.1073. [DOI] [PubMed] [Google Scholar]
- 5.American Academy of Pediatrics Committee on Hospital Care and Institute for Patient- and Family-centered Care. Patient- and family-centered care and the pediatrician’s role. Pediatrics. 2012;129(2):394–404. doi: 10.1542/peds.2011-3084. [DOI] [PubMed] [Google Scholar]
- 6.Wolraich M, Brown L, Brown RT, DuPaul G, Earls M, Feldman HM, et al. ADHD: clinical practice guideline for the diagnosis, evaluation, and treatment of attention-deficit/hyperactivity disorder in children and adolescents. Pediatrics. 2011;128(5):1007–22. doi: 10.1542/peds.2011-2654. [DOI] [PMC free article] [PubMed] [Google Scholar]
- 7.Jensen PS, Arnold LE, Swanson JM, Vitiello B, Abikoff HB, Greenhill LL, et al. 3-year follow-up of the NIMH MTA study. J Am Acad Child Adolesc Psychiatry. 2007;46(8):989–1002. doi: 10.1097/CHI.0b013e3180686d48. [DOI] [PubMed] [Google Scholar]
- 8.Adler LD, Nierenberg AA. Review of medication adherence in children and adults with ADHD. Postgrad Med. 2010;122(1):184–91. doi: 10.3810/pgm.2010.01.2112. [DOI] [PubMed] [Google Scholar]
- 9.Bussing R, Koro-Ljungberg M, Noguchi K, Mason D, Mayerson G, Garvan CW. Willingness to use ADHD treatments: a mixed methods study of perceptions by adolescents, parents, health professionals and teachers. Soc Sci Med. 2012;74(1):92–100. doi: 10.1016/j.socscimed.2011.10.009. [DOI] [PMC free article] [PubMed] [Google Scholar]
- 10.Bussing R, Schoenberg NE, Perwien AR. Knowledge and information about ADHD: evidence of cultural differences among African-American and white parents. Soc Sci Med. 1998;46(7):919–28. doi: 10.1016/s0277-9536(97)00219-0. [DOI] [PubMed] [Google Scholar]
- 11.Bussing R, Zima BT, Mason D, Hou W, Garvan CW, Forness S. Use and persistence of pharmacotherapy for elementary school students with attention-deficit/hyperactivity disorder. J Child Adolesc Psychopharmacol. 2005;15(1):78–87. doi: 10.1089/cap.2005.15.78. [DOI] [PubMed] [Google Scholar]
- 12.dosReis S, Mychailyszyn MP, Evans-Lacko SE, Beltran A, Riley AW, Myers MA. The meaning of attention-deficit/hyperactivity disorder medication and parents’ initiation and continuity of treatment for their child. J Child Adolesc Psychopharmacol. 2009;19(4):377–83. doi: 10.1089/cap.2008.0118. [DOI] [PMC free article] [PubMed] [Google Scholar]
- 13.dosReis S, Barksdale CL, Sherman A, Maloney K, Charach A. Stigmatizing experiences of parents of children with a new diagnosis of ADHD. Psychiatr Serv. 2010;61(8):811–6. doi: 10.1176/appi.ps.61.8.811. [DOI] [PubMed] [Google Scholar]
- 14.dosReis S, Mychailyszyn MP, Myers M, Riley AW. Coming to terms with ADHD: how urban African-American families come to seek care for their children. Psychiatr Serv. 2007;58(5):636–41. doi: 10.1176/appi.ps.58.5.636. [DOI] [PubMed] [Google Scholar]
- 15.Leslie LK, Plemmons D, Monn AR, Palinkas LA. Investigating ADHD treatment trajectories: listening to families’ stories about medication use. J Dev Behav Pediatr. 2007;28(3):179–88. doi: 10.1097/DBP.0b013e3180324d9a. [DOI] [PubMed] [Google Scholar]
- 16.Sikirica V, Flood E, Dietrich CN, Quintero J, Harpin V, Hodgkins P, et al. Unmet Needs Associated with Attention-Deficit/Hyperactivity Disorder in Eight European Countries as Reported by Caregivers and Adolescents: Results from Qualitative Research. The Patient - Patient-Centered Outcomes Research. 2015;8(3):269–81. doi: 10.1007/s40271-014-0083-y. [DOI] [PMC free article] [PubMed] [Google Scholar]
- 17.Waschbusch DA, Cunningham CE, Pelham WE, Rimas HL, Greiner AR, Gnagy EM, et al. A discrete choice conjoint experiment to evaluate parent preferences for treatment of young, medication naive children with ADHD. J Clin Child Adolesc Psychol. 2011;40(4):546–61. doi: 10.1080/15374416.2011.581617. [DOI] [PMC free article] [PubMed] [Google Scholar]
- 18.Nafees B, Setyawan J, Lloyd A, Ali S, Hearn S, Sasane R, et al. Parent preferences regarding stimulant therapies for ADHD: a comparison across six European countries. Eur Child Adolesc Psychiatry. 2014;23(12):1189–200. doi: 10.1007/s00787-013-0515-6. [DOI] [PMC free article] [PubMed] [Google Scholar]
- 19.Muhlbacher AC, Rudolph I, Lincke HJ, Nubling M. Preferences for treatment of Attention-Deficit/Hyperactivity Disorder (ADHD): a discrete choice experiment. BMC Health Serv Res. 2009;9:149. doi: 10.1186/1472-6963-9-149. [DOI] [PMC free article] [PubMed] [Google Scholar]
- 20.Fegert JM, Slawik L, Wermelskirchen D, Nubling M, Muhlbacher A. Assessment of parents’ preferences for the treatment of school-age children with ADHD: a discrete choice experiment. Expert Rev Pharmacoecon Outcomes Res. 2011;11(3):245–52. doi: 10.1586/erp.11.22. [DOI] [PubMed] [Google Scholar]
- 21.Lloyd A, Hodgkins P, Dewilde S, Sasane R, Falconer S, Sonuga Barke E. Methylphenidate delivery mechanisms for the treatment of children with attention deficit hyperactivity disorder: heterogeneity in parent preferences. Int J Technol Assess Health Care. 2011;27(3):215–23. doi: 10.1017/s0266462311000249. [DOI] [PubMed] [Google Scholar]
- 22.Glenngard AH, Hjelmgren J, Thomsen PH, Tvedten T. Patient preferences and willingness-to-pay for ADHD treatment with stimulants using discrete choice experiment (DCE) in Sweden, Denmark and Norway. Nord J Psychiatry. 2013;67(5):351–9. doi: 10.3109/08039488.2012.748825. [DOI] [PubMed] [Google Scholar]
- 23.Schatz NK, Fabiano GA, Cunningham CE, dosReis S, Waschbusch DA, Jerome S, et al. Systematic Review of Patients’ and Parents’ Preferences for ADHD Treatment Options and Processes of Care. Patient. 2015 doi: 10.1007/s40271-015-0112-5. [DOI] [PubMed] [Google Scholar]
- 24.Brinkman WB, Epstein JN. Treatment planning for children with attention-deficit/hyperactivity disorder: treatment utilization and family preferences. Patient Prefer Adherence. 2011;5:45–56. doi: 10.2147/ppa.s10647. [DOI] [PMC free article] [PubMed] [Google Scholar]
- 25.dosreis S, Zito JM, Safer DJ, Soeken KL, Mitchell JW, Jr, Ellwood LC. Parental perceptions and satisfaction with stimulant medication for attention-deficit hyperactivity disorder. J Dev Behav Pediatr. 2003;24(3):155–62. doi: 10.1097/00004703-200306000-00004. [DOI] [PubMed] [Google Scholar]
- 26.Bukstein OG. Satisfaction with treatment for attention-deficit/hyperactivity disorder. Am J Manag Care. 2004;10(4 Suppl):S107–16. [PubMed] [Google Scholar]
- 27.dosReis S, Ng X, Frosch E, Reeves G, Cunningham C, Bridges JF. Using Best-Worst Scaling to Measure Caregiver Preferences for Managing their Child’s ADHD: A Pilot Study. Patient. 2014 doi: 10.1007/s40271-014-0098-4. [DOI] [PMC free article] [PubMed] [Google Scholar]
- 28.Johnson FR, Lancsar E, Marshall D, Kilambi V, Muhlbacher A, Regier DA, et al. Constructing experimental designs for discrete-choice experiments: report of the ISPOR Conjoint Analysis Experimental Design Good Research Practices Task Force. Value Health. 2013;16(1):3–13. doi: 10.1016/j.jval.2012.08.2223. [DOI] [PubMed] [Google Scholar]
- 29.Muhlbacher AC, Kaczynski A, Zweifel P, Johnson FR. Experimental measurement of preferences in health and healthcare using best-worst scaling: an overview. Health Econ Rev. 2015;6(1):2. doi: 10.1186/s13561-015-0079-x. [DOI] [PMC free article] [PubMed] [Google Scholar]
- 30.Flynn TN, Louviere JJ, Peters TJ, Coast J. Best--worst scaling: What it can do for health care research and how to do it. J Health Econ. 2007;26(1):171–89. doi: 10.1016/j.jhealeco.2006.04.002. [DOI] [PubMed] [Google Scholar]
- 31.Hollin IL, Peay HL, Bridges JF. Caregiver preferences for emerging duchenne muscular dystrophy treatments: a comparison of best-worst scaling and conjoint analysis. Patient. 2015;8(1):19–27. doi: 10.1007/s40271-014-0104-x. [DOI] [PubMed] [Google Scholar]
- 32.Potoglou D, Burge P, Flynn T, Netten A, Malley J, Forder J, et al. Best–worst scaling vs. discrete choice experiments: An empirical comparison using social care data. Social Science & Medicine. 2011;72(10):1717–27. doi: 10.1016/j.socscimed.2011.03.027. doi: http://dx.doi.org/10.1016/j.socscimed.2011.03.027. [DOI] [PubMed] [Google Scholar]
- 33.Kuhfeld WF. http://support.sas.com/techsup/technote/ts723.html.
- 34.Brannan AM, Heflinger CA, Bickman L. The Caregiver Strain Questionnaire: Measuring the Impact on the Family of Living with a Child with Serious Emotional Disturbance. Journal of Emotional and Behavioral Disorders. 1997;5(4):212–22. doi: 10.1177/106342669700500404. [DOI] [Google Scholar]
- 35.Bickman L, Athay MM, Riemer M, Lambert EW, Kelley SD, Breda C, et al. Manual of the Peabody Treatment Progress Battery. Therapeutic Alliance Quality Scale (TAQS) 2010 [Google Scholar]
- 36.Vermunt JK, Magidson J. Technical guide for Latent GOLD 4.0: Basic and advanced. Belmont (Mass): Statistical Innovations Inc; 2005. [Google Scholar]
- 37.Magidson J, Vermunt JK. [Accessed 10 August 2014];Removing the Scale Factor Confound in Multinomial Logit Choice Models to Obtain Better Estimates of Preference. 2007 http://members.home.nl/jeroenvermunt/sawtooth2007.pdf.
- 38.Lanza ST, Rhoades BL. Latent class analysis: an alternative perspective on subgroup analysis in prevention and treatment. Prev Sci. 2013;14(2):157–68. doi: 10.1007/s11121-011-0201-1. [DOI] [PMC free article] [PubMed] [Google Scholar]
- 39.Zito JM, Safer DJ, DosReis S, Gardner JF, Magder L, Soeken K, et al. Psychotropic practice patterns for youth: a 10-year perspective. Arch Pediatr Adolesc Med. 2003;157(1):17–25. doi: 10.1001/archpedi.157.1.17. [DOI] [PubMed] [Google Scholar]
- 40.Olfson M, Marcus SC, Weissman MM, Jensen PS. National trends in the use of psychotropic medications by children. J Am Acad Child Adolesc Psychiatry. 2002;41(5):514–21. doi: 10.1097/00004583-200205000-00008. [DOI] [PubMed] [Google Scholar]
- 41.Efron D, Jarman FC, Barker MJ. Child and parent perceptions of stimulant medication treatment in attention deficit hyperactivity disorder. J Paediatr Child Health. 1998;34(3):288–92. doi: 10.1046/j.1440-1754.1998.00224.x. [DOI] [PubMed] [Google Scholar]
- 42.dosReis S, Butz A, Lipkin PH, Anixt JS, Weiner CL, Chernoff R. Attitudes about stimulant medication for attention-deficit/hyperactivity disorder among African American families in an inner city community. J Behav Health Serv Res. 2006;33(4):423–30. doi: 10.1007/s11414-006-9038-y. [DOI] [PubMed] [Google Scholar]
- 43.Pescosolido BA, Perry BL, Martin JK, McLeod JD, Jensen PS. Stigmatizing attitudes and beliefs about treatment and psychiatric medications for children with mental illness. Psychiatr Serv. 2007;58(5):613–8. doi: 10.1176/appi.ps.58.5.613. [DOI] [PubMed] [Google Scholar]
- 44.Liu C, Robin AL, Brenner S, Eastman J. Social acceptability of methylphenidate and behavior modification for treating attention deficit hyperactivity disorder. Pediatrics. 1991;88(3):560–5. [PubMed] [Google Scholar]
- 45.Brinkman WB, Sherman SN, Zmitrovich AR, Visscher MO, Crosby LE, Phelan KJ, et al. Parental angst making and revisiting decisions about treatment of attention-deficit/hyperactivity disorder. Pediatrics. 2009;124(2):580–9. doi: 10.1542/peds.2008-2569. [DOI] [PubMed] [Google Scholar]
- 46.Cunningham CE, Deal K, Rimas H, Buchanan DH, Gold M, Sdao-Jarvie K, et al. Modeling the information preferences of parents of children with mental health problems: a discrete choice conjoint experiment. J Abnorm Child Psychol. 2008;36(7):1123–38. doi: 10.1007/s10802-008-9238-4. [DOI] [PubMed] [Google Scholar]
- 47.Wymbs FA, Cunningham CE, Chen Y, Rimas HM, Deal K, Waschbusch DA, et al. Examining Parents’ Preferences for Group and Individual Parent Training for Children with ADHD Symptoms. J Clin Child Adolesc Psychol. 2015:1–18. doi: 10.1080/15374416.2015.1004678. [DOI] [PMC free article] [PubMed] [Google Scholar]
- 48.Cunningham CE, Boyle M, Offord D, Racine Y, Hundert J, Secord M, et al. Tri-ministry study: correlates of school-based parenting course utilization. J Consult Clin Psychol. 2000;68(5):928–33. [PubMed] [Google Scholar]
- 49.Stransky ML. Recentering Patient-centered Care on the Patient: A Research Agenda. Med Care. 2015 doi: 10.1097/mlr.0000000000000459. [DOI] [PubMed] [Google Scholar]
- 50.Williams J, Palmes G, Klinepeter K, Pulley A, Foy JM. Referral by Pediatricians of Children with Behavioral Health Disorders. Clinical Pediatrics. 2005;44(4):343–9. doi: 10.1177/000992280504400410. [DOI] [PubMed] [Google Scholar]
- 51.dosReis S, Camelo Castillo W, Ross M, Fitz-Randolph M, Vaughn-Lee A, Butler B. Attribute Develeopment Using Continuuos Stakeholder Engagement to Prioritize Treatment Decisions: A Framework for Patient-Centered Research. Value Health. 2016 doi: 10.1016/j.jval.2016.02.013. [DOI] [PubMed] [Google Scholar]
- 52.Davis CC, Claudius M, Palinkas LA, Wong JB, Leslie LK. Putting families in the center: family perspectives on decision making and ADHD and implications for ADHD care. J Atten Disord. 2012;16(8):675–84. doi: 10.1177/1087054711413077. [DOI] [PubMed] [Google Scholar]
- 53.Evans SW, Axelrod J, Langberg JM. Efficacy of a school-based treatment program for middle school youth with ADHD: pilot data. Behav Modif. 2004;28(4):528–47. doi: 10.1177/0145445503259504. [DOI] [PubMed] [Google Scholar]
- 54.Leslie LK, Wolraich ML. ADHD service use patterns in youth. J Pediatr Psychol. 2007;32(6):695–710. doi: 10.1093/jpepsy/jsm023. [DOI] [PubMed] [Google Scholar]
- 55.DuPaul GJ, Eckert TL. The effects of school-based interventions for attention deficit hyperactivity disorder. Special Educational Needs and Inclusive Education: Effective practices. 2004;4(1):246. [Google Scholar]
- 56.Van Brunt K, Matza LS, Classi PM, Johnston JA. Preferences related to attention-deficit/hyperactivity disorder and its treatment. Patient Prefer Adherence. 2011;5:33–43. doi: 10.2147/ppa.s6389. [DOI] [PMC free article] [PubMed] [Google Scholar]
- 57.Lynch S. Health system factors affecting communication with pediatricians: gendered work culture in primary care. Soc Work Public Health. 2011;26(7):672–94. doi: 10.1080/19371918.2011.552041. [DOI] [PubMed] [Google Scholar]
- 58.Oehrlein EM, Burcu M, Safer DJ, Zito JM. National Trends in ADHD Diagnosis and Treatment: Comparison of Youth and Adult Office-Based Visits. Psychiatr Serv. 2016;67(9):964–9. doi: 10.1176/appi.ps.201500269. [DOI] [PubMed] [Google Scholar]
- 59.Sollie H, Larsson B, Morch WT. Comparison of mother, father, and teacher reports of ADHD core symptoms in a sample of child psychiatric outpatients. J Atten Disord. 2013;17(8):699–710. doi: 10.1177/1087054711436010. [DOI] [PubMed] [Google Scholar]
- 60.Bussing R, Mason D, Garvan CW, Gurnani T, Koro-Ljungberg M, Noguchi K, et al. Willingness to use ADHD Self-Management: Mixed Methods Study of Perceptions by Adolescents and Parents. J Child Fam Stud. 2016;25(2):562–73. doi: 10.1007/s10826-015-0241-4. [DOI] [PMC free article] [PubMed] [Google Scholar]
- 61. [Accessed 27 November 2014];How to Estimate Scale-Adjusted Latent Class (SALC) Models and Obtain Better Segments with Discrete Choice Data. http://www.statisticalinnovations.com/products/LGChoice_tutorial_10A.pdf.