Abstract
To assess the role of abnormal TGF-β signaling in the pathogenesis of primary myelofibrosis (PMF) the effects of the TGF-β receptor-1 kinase inhibitor SB431542 on ex-vivo expansion of hematopoietic cells in cultures from patients with JAK2V617+-polycythemia vera (PV), PMF (JAK2V617F+, CALRpQ365f+ or unknown) and from normal sources (adult blood, AB, or cord blood, CB) were compared. In cultures of normal sources, SB431542 significantly increased by 2.5-fold the number of progenitor cells generated by Day 1–2 (CD34+) and 6 (colony-forming cells) (CB) and that of precursor cells, mostly immature erythroblasts, by Days 14–17 (AB and CB). In cultures of JAK2V617F+-PV, SB431542 increased by 2-fold the numbers of progenitor cells by Day 10 and had no effect on that of precursors cells by Days 12–17 [fold-increase ~4 fold in all cases]. By contrast, SB431542 had no effect on the number of both progenitor and precursor cells in cultures of JAK2V617F+- and CALR pQ365fs+-PMF. These ontogenetic- and disease-specific effects were associated with variegation in the ability of SB431542 to induce CD34+ cells from AB (increased), CB (decreased) or PV and PMF (unaffected) into cycle and erythroblasts in proliferation (increased for AB and PV and unaffected for CB and PMF). Differences in expansion of erythroblasts from AB, CB and PV were associated with differences in activation of TGF-β signaling (SHCY317, SMAD2S245/250/255 and SMAD1S/S/SMAD5S/S/SMAD8S/S) detectable in these cells by phosphoproteomic profiling. In conclusion, treatment with TGF-β receptor-1 kinase inhibitors may reactivate normal hematopoiesis in PMF patients, providing a proliferative advantage over the unresponsive malignant clone.
Keywords: Primary Myelofibrosis, TGF-β, JAK2V617F, CALRpQ365fs, TGF-β receptor-1 kinase inhibitor
INTRODUCTION
Transforming growth factor-β (TGF-β) has been implicated in the pathogenesis of primary myelofibrosis (PMF) by Schmitt et al. who recognized for the first time the presence of megakaryocytes expressing high levels of this factor in the marrow from both PMF patients and mouse models of the disease [1]. Further studies recognized that megakaryocytes grown in culture from PMF patients release in vitro greater amounts of TGF-β than those from normal sources or other myeloproliferative neoplasms (MPNs) such as polycythemia vera (PV) and essential thrombocythemia [2]. In addition, plasma, bone marrow, and spleen washes from PMF patients, as well as those from murine models of PMF, contain 2 fold-greater levels of total and bioactive TGF-β than those from normal controls [3,4]. The role of TGF-β in the pathogenesis of PMF was further supported by the observation that genetic ablation of the gene [5, 6] or treatment with the TGF-β receptor (R)1 kinase inhibitor SB431542 [4] cure several mouse models of the disease including the Gata1low model.
The Gata1low model, originally described in 2002 [7], recapitulates all the pathobiological features of PMF including hematopoietic failure in the bone marrow, development of extramedullary hematopoiesis, increased megakaryocyte proliferation with impaired maturation [8], and high TGF-β content [9]. The observation that megakaryocytes derived from PMF patients, irrespective of driver mutation status, contain low levels of GATA1 [10] inspired us to use the Gata1low model as a tool to identify a pathologic pathway common to all mutations. These studies identified that in the Gata1low mouse, as is seen in PMF [11], hematopoietic stem cells (HSC) are present primarily in the spleen [12] and that splenectomy restores hematopoiesis in the bone marrow [13], suggesting that the spleen contains myelofibrosis-specific HSC niches. Further studies identified that myelofibrosis-specific HSC niches are represented by activated fibrocytes which are induced by TGF-β in the spleen of Gata1low mice [12, 14] and possibly in PMF which also contain great numbers of activated splenic fibrocytes [12]. These observations led to the hypothesis that treatment with a TGF-β inhibitor may cure PMF by rescuing the normal microenvironment (reducing fibrosis in the marrow and decreasing the myelofibrosis-supporting niche in the spleen) (Fig. 1).
Figure 1. Preclinical rational for TGF-β inhibition as a therapeutic target for the treatment of myelofibrosis.
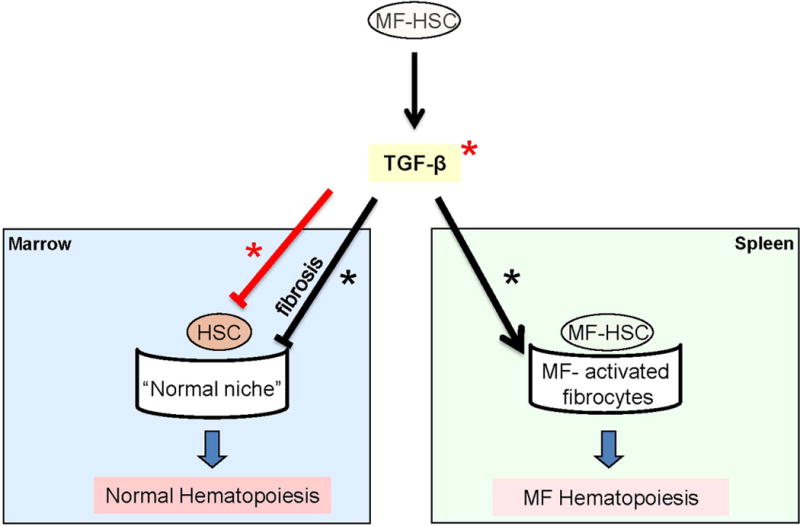
The overarching hypothesis is that increased production of TGF-β by the malignant cells provides a proliferative advantage to PMF HSC by inhibiting proliferation of normal HSC in the bone marrow. This inhibition is exerted both indirectly by inducing fibrosis which compromises the niches supporting normal HSC, and directly inducing normal HSC into quiescence. In addition, TGF-β indirectly supports expansion of the MF-HSC, by supporting the generation of myelofibrosis-specific HSC niches in the spleen. The splenic niches may be represented by the numerous activated fibrocytes observed in this organ from Gata1low mice and PMF patients that are observed, by electron microscopy, establishing physical contacts with hematopoietic cells with the morphology of HSCs (c-Kit+ in mice and CD34+ in human blast-like cells [4, 14]). This hypothesis is consistent with the notion that TGF-β is responsible for inducing the transition of several stromal cells into cancer-supporting activated fibrocytes in numerous experimental models [15–19]. This preclinical rationale will be tested in the multi-center, phase II trial with galunisertib in PMF (MPD-RC 118). Events presumably induced through canonical and non-canonical signaling are indicated by red and black lines and events expected to be directly or indirectly inhibited by TGF-β R1 kinase inhibitors are indicated by * and *, respectively.
TGF-β, however, has many pleiotropic effects [15–20]. One of the best characterized of these effects is its ability to directly inhibit hematopoiesis through the canonical SMAD-dependent signaling by 1) inducing HSC into quiescence [21], 2) eliciting Smad5-dependent inhibition of progenitor cell proliferation [22] increasing the duration of G1 through reduction of G1 cyclin and cyclin-dependent protein kinases [23, 24] and 3) triggering Smad4-signaling thereby accelerating terminal erythroid maturation [25, 26]. In agreement with these data, the expression profiling of murine HSC indicated that these cells express all the elements of canonical TGF-β signaling and that these elements undergo specific changes as the cells divide [27].
By contrast, microarray analyses of bone marrow (and spleen) from PMF patients and Gata1low mice provided clear evidence of activation of non-canonical TGF-β signaling [4, 28]. In fact, PMF patients expressed altered levels of 27 TGF-β related genes in bone marrow, 12 of which were also altered in bone marrow from Gata1low mice, and 32 genes in spleen, 19 of which were also altered in spleens of Gata1low mice. These abnormalities included reduced levels of expression of TGF-β R1 and R2 (a clear indication of receptor activation), reduced expression of SMAD 1, 2 and 4 (a proof that the canonical SMAD-dependent TGF-β signaling is inactive), and increased expression of JUNB3, EVI1 and STAT1, three genes downstream of the non-canonical MAPK signaling [28, 29]. These data, with the caveat that they were obtained from total cell populations, support the hypothesis that TGF-β may promote the development of myelofibrosis by altering the supporting role of the microenvironment, which is sensitive to non-canonical TGF-β signaling [30, 31]. Lack of activation of the canonical signaling also suggests that malignant hematopoietic cells may be insensitive to TGF-β and therefore have a direct proliferative advantage over the normal ones, leading to their progressive exhaustion, in an environment containing high levels of this growth factor (Fig. 1).
The aim of this study was to test the hypothesis that, by contrast to normal hematopoietic cells, malignant PMF cells are insensitive to TGF-β. To address this hypothesis we evaluated the effect of the TGF-β R1 kinase inhibitor SB431542, which was previously used in studies on Gata1low mice [4, 14], on the proliferation and maturation of progenitor and precursor cells in cultures of non-diseased sources (adult blood, AB and cord blood, CB) and four (two JAK2V617F+, one CALRpQ365f+ and one mutation status unknown) PMF patients. Cultures of JAK2V617+-PV were also analyzed as a control for disease-specific effects.
MATERIALS AND METHODS
Human subjects
Cord Blood (CB) was obtained as de-identified samples from the New York Blood Center, New York, NY. Buffy coats from adult blood (AB) donations were provided by the transfusion center of “La Sapienza” University (Rome, Italy). Mononuclear cells (MNC) from seven JAK2pos-PV (allele burden: 67%, 88.2%, 93.9%, 100%, 100% and two unknown) and 5 JAK2pos-PMF (allele burden unknown for all), two CALRpos-PMF (Type 2 CALRpQ365fs mutation) and two JAK2neg-PMF patients with unknown driver mutation status were obtained from the Hematological Malignancies Tissue Bank (HMTB) of the Mount Sinai School of Medicine and from the Myeloproliferative Disease Research Consortium Tissue Bank, New York, NY. All the samples were collected according to the guidelines established by Institutional Review Board committees for human subject studies in accordance with the 1975 Helsinki Declaration revised in 2000.
Liquid culture of human Erythroblasts (Erys)
MNC (106 cells/mL) were cultured under Human Erythroid Massive Amplification (HEMA) conditions stimulated with recombinant human stem cell factor (SCF, 100 ng/mL), interleukin-3 (IL-3, 1 ng/mL) (both from R&D System, Inc., Minneapolis, MN) and erythropoietin (EPO, 5 U/mL, PROCRIT, Janssen products, Titusville, NJ), with or without dexamethasone (Dex, 10–6 M) and β-estradiol (10–6 M) (Sigma-Aldrich, St. Louis, MO) as described previously [32, 33]. After 10–17 Days, cells were collected for further analyses. Increasing concentrations of the TGF-β inhibitor SB431542 (0, 1, 3, 10 and 26 μM; Sigma-Aldrich) were added at Day 0 of culture and whenever the media was replenished to maintain cells density under 106 cells/mL.
Enzyme-Linked Immunosorbent Assay (ELISA) for TGF-β
Analysis of TGF-β was performed by ELISA kit (R&D System). Briefly, supernatants of MNCs from AB, CB, JAK2pos- PV and PMF patients cultured in HEMA for 1, 3, 7 and 10 Days were processed and the levels of total and bioactive TGF-β determined according to the manufacturer’s instructions. The colorimetric reaction was quantitated by using an absorbance multiplate reader (Spectra Max M5, Molecular Device LLC., Sunnyvale, CA).
Colony Forming Cell assay (CFC)
Cells (105 cells/mL) were cultured in semisolid media (MethoCult, STEMCELL Technologies, Inc., Vancouver, Canada) supplemented with 30% (v/v) fetal bovine serum, 10% (w/v) human serum albumin and IL-3 (1 ng/mL), SCF (100 ng/mL), granulocyte-macrophage colony-stimulating factor (GM-CSF, 10 ng/mL) (Leukine, Genzyme,Cambridge, MA), granulocyte colony-stimulating factor (G-CSF, 100 ng/mL) (Neupogen, Amgen, Thousand Oaks, CA), and EPO (5 U/mL). The cultures were incubated at 37°C in a fully humidified 5% pCO2 atmosphere and scored after 14 Days for the growth of hematopoietic colonies, which were recognized according to standard morphological criteria.
Phenotypic analysis
Cytospin preparations were obtained by cytocentrifugation (Shandon, Astmoor, UK) and stained with May-Grünwald-Giemsa stain (Sigma). Slides were observed with a Axioskop 40 microscope (Zeiss, Oberkochen, Germany) and images acquired with a CoolSNAP cf digital CCD digital camera (Photometrics Scientific, Tucson, AZ). For flow cytometry determinations of erythroid cells, samples were labeled with APC-conjugated CD235a and FITC-conjugated CD36 (Becton Dickinson Biosciences, Franklin Lakes, NJ). Dead cells were identified by staining with Sytox blue (1 μM) (Life Technologies, Waltham, MA). Cell fluorescence was analyzed with a FACSAria (Becton Dickinson Biosciences).
Cell Cycle Analyses: MNC (1.0–3.0×10⁶) cultured in HEMA for 24, 48 and 72h with or without SB431542 (26 μM) were labelled with phycoerythrin-cyanin 7 (PE-Cy7)-conjugated CD34 or appropriate isotype controls (Becton Dickinson Biosciences), fixed overnight with paraformaldehyde (8% v/v) and then permeabilized with Triton X-100 (0.25% v/v). Permeabilized cells were labelled with phycoerythrin Ki-67 (Becton Dickinson Biosciences) and DAPI and analysed with the FACS Aria (Becton Dickinson Biosciences). Results were analysed with the Diva software version 6.1.3 (Becton Dickinson Biosciences).
3-(4,5-dimethylthiazolyl-2)-2,5-diphenyltetrazolium bromide (MTT) proliferation assay
Erys (105 cells/100 μL/well) obtained at Day 10 of HEMA with and without SB431542 (26μM) were growth factors deprived (GFD) for 4h and then cultured for additional 24h in HEMA with and without SB431542 (26μM). After 24h, MTT (5 mg/mL, Sigma) was added to each well and colorimetric reactions read as optical density (OD) at 570 nm with the Victor3TM 1420 Multilabel Counter (Perkin Elmer, Waltham, MA).
Phosphoproteomic analysis
Phosphoproteomic analysis of Erys generated at Day 10 of HEMA with and without Dex was performed by Reverse-Phase Protein Array (RPPA). RPPA were constructed and analyzed as previously described [34]. Briefly, all protein lysate samples were printed in triplicate spots on nitrocellulose-coated glass slides (GRACE Bio-Labs, Bend, OR) using an Aushon 2470 equipped with 185-μm pins (Aushon Biosystems, Billerica, MA), according to the manufacturer's instructions. Reference standard lysates, were printed in 14-point or 10-point dilution curves as procedural controls. A selected subset of the printed array slides was stained with Sypro Ruby Protein Blot Stain (Invitrogen, Carlsbad, CA) to estimate sample total protein concentration. Immunostaining was carried out using a signal amplification kit (DAKO, Carpinteria, CA) by an automated stainer, following manufacturer’s instructions. Arrays were probed with 180 selected antibodies against antigens to total, and phosphorylated protein targets. Primary antibody binding was detected using a biotinylated goat anti-rabbit IgG H+L (Vector Laboratories, Burlingame, CA) or rabbit anti-mouse IgG (DAKO) followed by streptavidin-conjugated IRDye680 fluorophore (LI-COR Biosciences, Lincoln, NE) reaction. Negative control slides were incubated with secondary antibody only. All Sypro and immunostained slides were scanned using a Tecan power scanner™ (Tecan Group Ltd, Mannedorf, Switzerland). Acquired images were analyzed with MicroVigene v5.0. (VigeneTech, Carlisle, MA) for spot detection, local background subtraction, negative control subtraction, replicate averaging and total protein normalization.
Statistical methods
A mixed model with fixed effects for group and time and an interaction effect between group and time was used for longitudinal analyses. Post-hoc comparisons used Student’s t-tests for group comparisons and paired t-tests for change within group at each time point. SAS version 9.3 (Cary, NC) was used for analysis. Phosphoproteomic data were analyzed with the software package JMP v6 (SAS Institute, Cary, NC) that carry out internal standardization, two-way hierarchical clustering using Ward's method, and two-groups Wilcoxon rank-sum test (significance cut off p ≤ 0.05).
RESULTS
HEMA cultures of AB, CB, PV and PMF contain similar levels of total and bioactive TGF-β
The levels of total and bioactive TGF-β present in HEMA of AB, CB, PV and PMF with and without Dex are presented in Fig 2. In all the experimental groups, the cultures contained maximal levels of total TGF-β (~ 3000 µg/mL in all the cases), 30% of which was bioactive, already by Day 1. The levels of total and bioactive TGF-β present in the cultures of the different groups and those present in cultures with and without Dex were not statistically different.
Figure 2. Levels of total and bioactive TGF-β over time in media from HEMA cultures of MNC from AB, CB, JAK2+-PV (100% allele burden) and JAK2+-PMF stimulated with (red lines) or without (black lines) Dex.
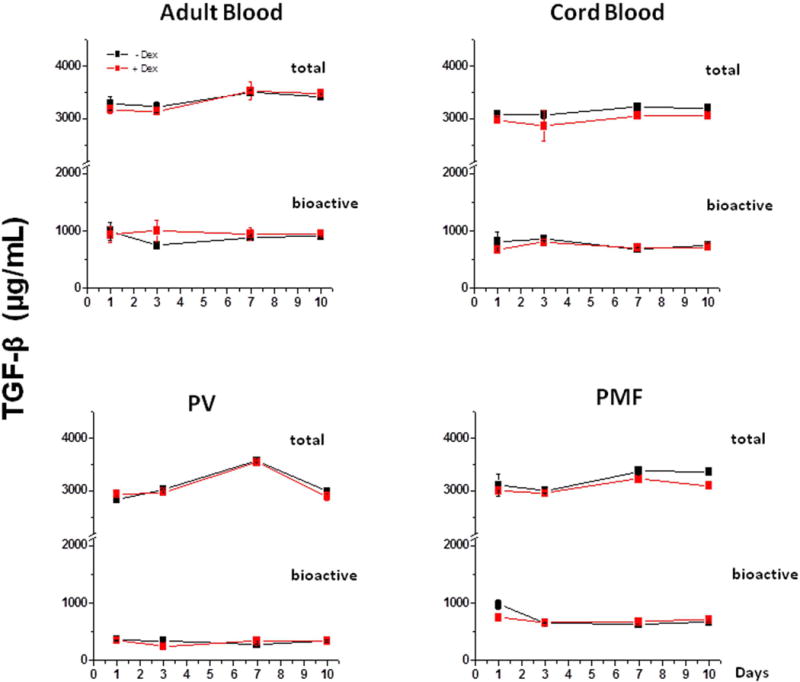
Data are presented as Mean (±SEM) and are representative of one experiment performed in triplicate. The levels of TGF-β observed in the different experimental points are not statistically different (by Student’s t-test). Similar results were obtained in one additional experiment with a different AB, JAK2+-PV (allele burden unknown cultured only with Dex) and JAK2+-PMF donor.
The similar TGF-β content in HEMA culture of AB, PV and PMF is not surprising since PMF produces levels of TGF-β greater than AB and PV only under culture conditions specific for megakaryocytes [1–4] which are not generated under HEMA conditions [32, 33].
Inhibition of TGF-β signaling improves erythroid cell (Ery) expansion in HEMA cultures of MNC from AB with and without Dex
The effects of increasing concentrations (0, 1, 3, 10 and 26 μM) of SB431542 on the growth of hematopoietic progenitor and precursor cells in HEMA culture is presented in Fig. 3. HEMA cultures were performed with Dex, which primes normal progenitor cells to undergo unilineage erythroid maturation, or without Dex, where cells of multiple lineages (primarily granulocytes, monocytes and Erys) are generated [32].
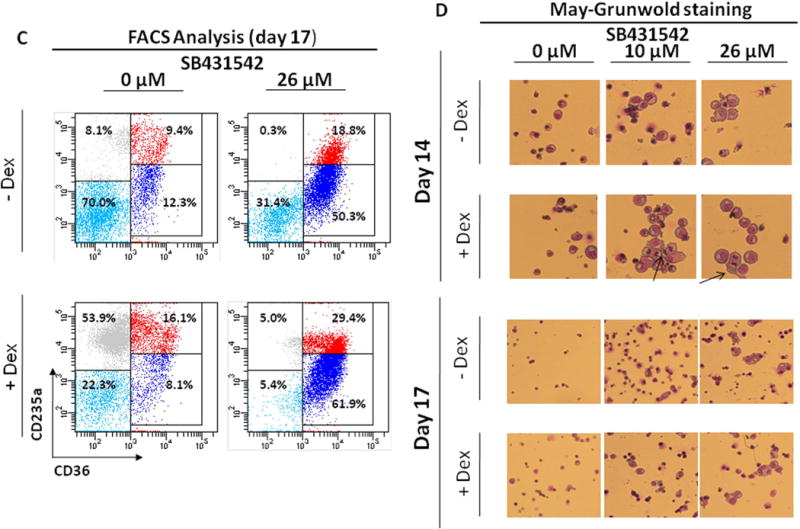
Figure 3. Effect of increasing concentrations of SB431542 on the expansion of progenitor (A) and precursor (B-D) cells in HEMA cultures of MNC from Adult Blood with (bottom panel) or without (top panel) Dex.
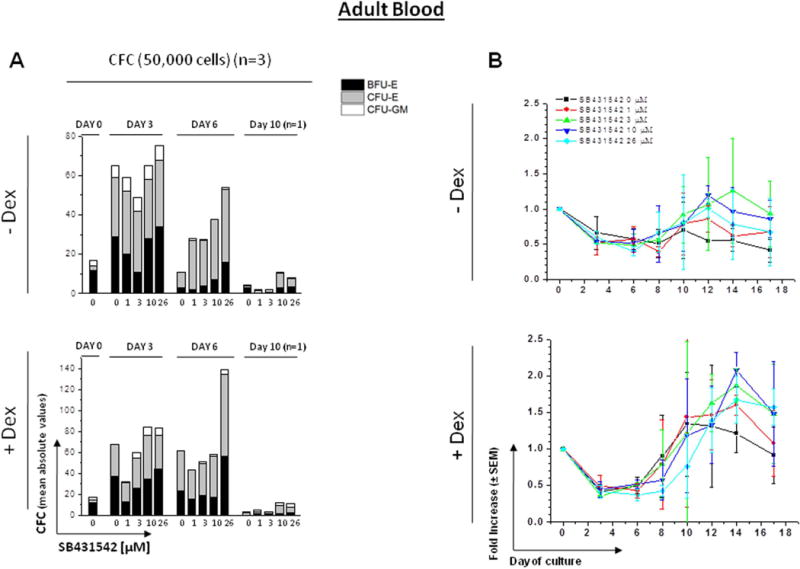
A) Cultured cells were collected at 0, 3, 6 and 10 Days of HEMA cultures of AB containing increasing concentrations of SB431542 (0, 1, 3, 10 and 26 μM) and their progenitor cell content evaluated as colony forming cells (CFC) in semisolid cultures. The columns present the total CFC numbers and the grey area within the columns the numbers of CFU-E-, BFU-E- and CFU-GM-derived colonies. Results are presented as Mean of those obtained in three separate experiments, each one with a different donor, performed in duplicate. SEMs are not indicated for clarity. Statistical analysis was performed by Student’s t-test and the results are summarized in Fig. S1.
B) Cells generated by MNC from AB cultured in HEMA in the presence of increasing concentrations of SB431542 (0, 1, 3, 10 and 26 μM) over time (0, 3, 6, 8, 10, 12, 14 and 17 Days). Results are presented as fold increase with respect to Day 0 and are presented as Mean (± SEM) of three experiments each one with a different donor. Statistical analysis was performed by mixed models and Student’s t-tests and the results are summarized in Fig. S1.
C) Representative flow cytometric analyses for CD36 and CD235a expression of cells from AB cultured for 17 Days in the absence or presence of Dex and treated with or without SB431542 (26 µM), as indicated. Erys were recognized and divided into distinctive maturation stages on the basis of standard criteria based on the levels of CD36pos/CD235aneg expression indicated by rectangles [32, 33]. Events indicated with light blue, blue, red and grey dots represent non-erythroid cells, proErys, basophilic/polychromatic Erys and orthochromatic Erys, respectively. The numbers near each rectangle indicate the frequency of the different populations within the analyzed population.
D) May-Grunwald staining of cytospin preparations of Erys obtained at Day 14 and 17 of HEMA from AB with and without Dex in the presence of SB431542 (0, 10 or 26 μM), as indicated. The arrows in D indicate cells in metaphase. Results are representative of those observed in four experiments, one of which seeded with purified CD34+ cells. Original magnification 200x.
In the absence of Dex, the number of CFC present in culture significantly increased by Day 3 and then returned to input level by Day 6, becoming barely detectable by Day 10. In the presence of Dex, the number of CFC present in culture significantly increased by Day 3, remained constant until Day 6 and then became barely detectable by Day 10. The presence of SB431542 had no statistically significant effect on the number of CFC generated in HEMA culture over time (Fig. 3A).
As expected, MNC from AB generated greater numbers of cells with than without Dex (Fig. 3B) and only those generated with Dex were mostly Erys (Fig. 3C and data not shown). In both cases, the growth reached a plateau by Day 10 and then declined. In cultures without Dex, in all models, fold increases in total number of cells appeared to change over time within each concentration level with the change (i.e., difference from one time point to the next) reaching statistical or near statistical significance (1 µM p=0.036, 3 µM p=0.060, 10 µM p=0.038, 26 µM p=0.072) dependent on the SB431542 concentration present in the culture (Fig. S1). However, the fold increases in cultures plus SB431542 did not appear to differ relative to control for any concentration level across the time points (i.e., between-group comparisons were not statistically significant). In cultures with Dex, in all models, fold increases in total number of cells significantly changed over time within each concentration level (p<0.05 for each concentration level). For 26 µM, the change over time was significantly different from control (interaction p=0.049) with a statistically significant greater fold increase observed between these two groups at Day 8 (p=0.035).
To clarify the mechanism(s) which determines the greater numbers of cells generated in the presence of SB431542 despite the absence of a detectable increase in progenitor cell content, flow cytometric and morphological evaluations of Erys generated by Days 14–17 with and without SB431542 were performed (Fig 3C,D). Results from flow cytometric analysis indicated that by Day 17 cultures with SB431542 (26 µM) still contained a greater proportion (50–60%) of immature Erys (CD36+/CD235a‐) (Fig 3C) and a lesser number of orthochromatic Erys (0.3–5.0% vs 8.1–53.9%). By morphological analyses, at Days 14–17, cultures without SB431542 mainly contained small cells with a mature Ery morphology while those with 10 and 26 µM SB431542 contained large cells with the morphology of proErys and basophilic Erys. In addition, cultures with Dex plus SB431542 still contained greater numbers (1–3/field) of proErys in the mitotic phase of cell division (Fig. 3D), indicating that these cells were still capable of proliferating. ProErys in the mitotic phase of cell divisions were also observed in a separate experiment seeded with purified CD34+ cells (data not shown). In over 20 years of HEMA culture experience, we seldom detect the presence of proErys in mitosis after Day 12 from AB.
Given the lack of effect exerted by SB431542 at the concentration of 1 and 3 µM, these concentrations were no longer investigated.
Inhibition of TGF-β signaling increases the generation of progenitor and precursor cells in HEMA culture of CB only in the absence of Dex
Also in HEMA culture of CB, the number of progenitor cells significantly increased by Days 3–6 to barely detectable levels by Day 10 both with and without Dex (Fig. 4A). In cultures without Dex in the presence of SB431542, mean CFC numbers were statistically greater (2-fold) than control at Day 3 (p=0.009) for 10 µM while were statistically greater than control both at Day 3 (p=0.007) and Day 6 (p=0.039) for 26 µM. In culture with Dex, mean CFC numbers did not significantly differ from control at all the Days tested (Day 3, 6, and 10).
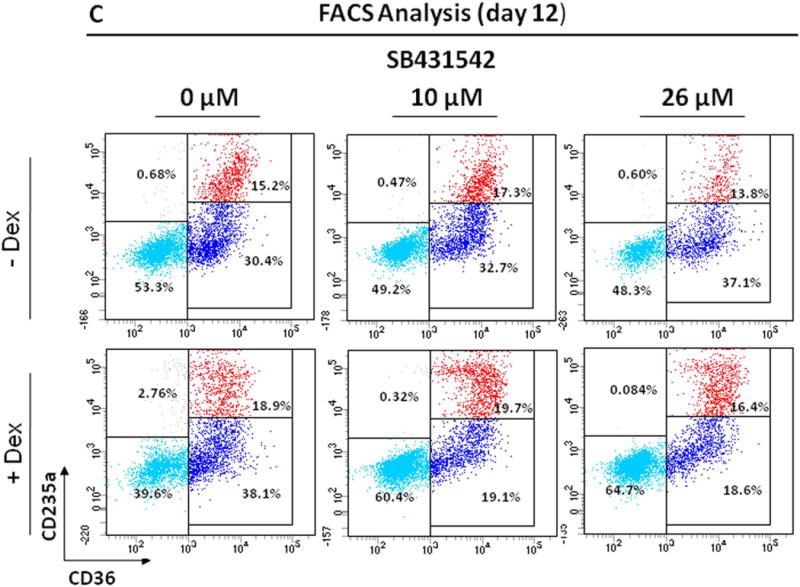
Figure 4. Effect of increasing concentrations of SB431542 on the expansion of progenitor (A) and precursor (B,C) cells in HEMA cultures of MNC from Cord Blood with (bottom panel) or without (top panel) Dex.
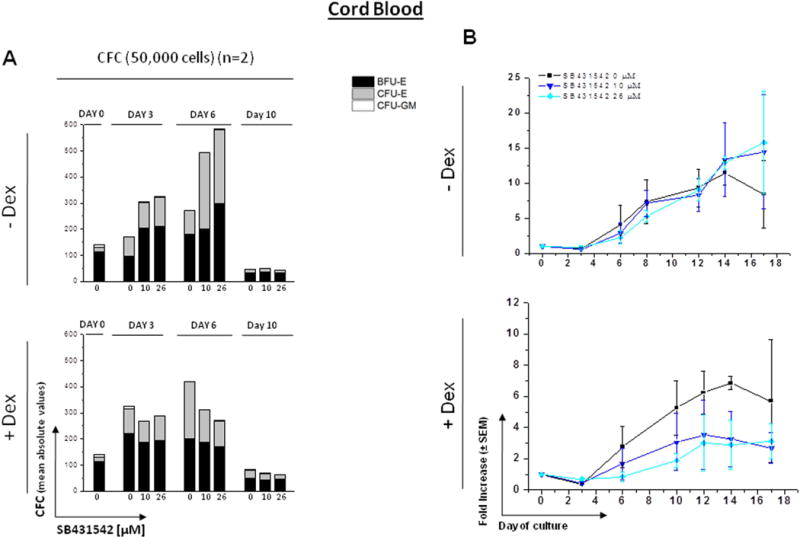
A) Cultured cells were collected at 0, 3, 6 and 10 Days of HEMA cultures of CB containing increasing concentrations of SB431542 (0, 10 and 26 μM) and their progenitor cell content evaluated as colony forming cells (CFC) in semisolid cultures. Results are presented as Mean of those obtained in two separate experiments, each one with a different donor. Statistical analysis was performed by Student’s t-test and the results are summarized in Fig. S2. See legend to Fig. 3 for further details.
B) Cells generated by MNC from CB cultured in HEMA in the presence of indicated concentrations of SB431542 (0, 10 or 26 μM) over time (0, 3, 6, 10, 12, 14 and 17 Days). Results are presented as fold increase with respect to Day 0 and are presented as Mean (± SEM) for two separated experiments each one with a different donor, performed in duplicate. Statistical analysis was performed by mixed models and Student’s t-tests and the results are summarized in Fig. S2.
C) Representative flow cytometric analyses for CD36 and CD235a of cells from CB cultured for 12 Days in the absence or presence of Dex and treated with SB431542 (0, 10 or 26 μM), as indicated. Results are representative of those observed in two experiments.
The effects of SB431542 on the total number of cells generated over time in HEMA are shown in Figs. 4B and S2. In cultures without Dex: in both models, fold increase in total number of cells appeared to change over time within each concentration level with the change (i.e., difference across time points) reaching statistical or near statistical significance (10 µM p=0.060, 26 µM p=0.025). However, fold increase in total number of cells did not appear to differ relative to control at any fixed time point for either concentration level. In cultures with Dex: in both models, fold increase in total number of cells trended towards significant change over time (10 µM p=0.097, 26 µM p=0.091), however, difference between each dose level and control at any fixed time point did not reach statistical significance for either dose level.
Flow cytometric analysis of the cells obtained by Day 12 in HEMA culture of CB with and without SB431542 is presented in Fig. 4C. In contrast to AB, no difference was observed in the number (40–60%) and maturation state (~50% immature) of Erys generated with and without Dex in cultures of CB. These values were not affected by the presence of SB431542 both in culture with and without Dex.
Inhibition of TGF-β signaling increases the numbers of progenitor cells and of Erys generated in cultures of JAK2+-PV
The effects of 10 and 26 µM SB431542 on the number of progenitor cells and Erys generated in HEMA cultures of JAK2+-PV with and without Dex is shown in Fig. 5 and S3. As expected [35] and in contrast to AB and CB, the progenitor cells observed in HEMA cultures of JAK2+-PV were mostly erythroid. The increases (2-fold) in CFC numbers observed by Days 3–6 in HEMA culture of JAK2+-PV with and without Dex were similar. In cultures without Dex, in the presence of 10 µM of SB431542, mean CFC was not statistically different than control (cultures with no SB431542) at Day 3, 6, or 10. For 26 µM, mean CFC trended towards being statistically significantly greater than control at Day 6 (p=0.068) with the difference reaching statistical significance at Day 10 (p=0.007). In cultures with Dex, at Day 3 and 10, dose groups did not significantly differ from control. At Day 6, mean CFC in the 10 µM group was significantly greater than control (p=0.003). Mean CFC in the 26 µM group appeared elevated relative to control also at Day 10, although the difference failed to reach statistical significance (p=0.117).
Figure 5. Effect of SB431542 on the expansion of progenitor (A) and precursor (B,C) cells in HEMA cultures of MNC from JAK2+-PV patients with (bottom panel) or without (top panel) Dex.

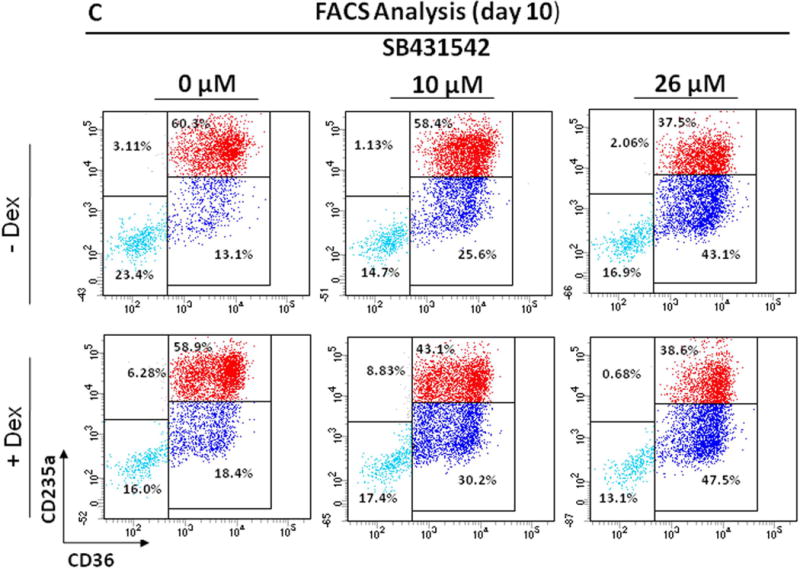
A) Cultured cells were collected at 0, 3, 6 and 10 Days of HEMA cultures of PV containing indicated concentrations of SB431542 (0, 10 and 26 μM) and their progenitor cell content evaluated as colony forming cells (CFC) in semisolid cultures. Results are presented as Mean of those obtained in two separate experiments, each one with a different donor (one with 67% allele burden and the other of allele burden unknown). Statistical analysis was performed by Student’s t-test and the results are summarized in Fig. S3. See legend to Fig. 3 for further details.
B) Cells generated by MNC from PV patients cultured in HEMA in the presence of indicated concentrations of SB431542 (0, 10 or 26 µM) over time (0, 3, 6, 8, 12, 14 and 17 Days). Results are presented as fold increase with respect to Day 0 and are presented as Mean (± SEM) for two separated experiments (the same as in A), performed in duplicate. Statistical analysis was performed by mixed models and Student’s t-tests and the results are summarized in Fig. S3.
C) Representative flow cytometric analyses for CD36 and CD235a of cells from PV patients cultured for 10 Days in the absence or presence of Dex and treated with SB431542 (0, 10 or 26 µM), as indicated. The numbers near each rectangle indicate the frequency of the different populations. Results are representative of those observed in two experiments.
In contrast to AB, HEMA cultures of JAK2+-PV generated similarly greater numbers of cells, mostly represented by Erys, both with and without Dex. This result is consistent from previous observation from our group that had indicated that the glucocorticoid receptor pathway activated by Dex, which bias maturation toward the erythroid lineage, is constitutively active in Erys generated from JAK2+-PV [31]. In cultures without Dex: in both models, fold increase in total number of cells statistically significantly changed over time within concentration groups (10 µM p<0.001, 26 µM p=0.006). In comparing between groups, fold change trended towards differing from cultures without SB431542 for both concentration level (10 µM interaction p=0.089, 26 µM interaction p=0.112). In cultures with Dex, in both models, fold change appeared to statistically significantly change over time within concentration groups (10 µM p=0.003, 26 µM p=0.006). However, differences between each concentration level and the control group did not reach statistical significance. This may be due to the great variability of the magnitude of the fold increases observed in these two experiments (SEM was 85% of the mean).
Flow cytometry analyses of primary PV cultures in the presence of SB431542, indicated Erys retained an immature phenotype both in the absence (CD36+/CD235a− = 43 vs 13%) and presence of Dex (CD36+/CD235a− = 48 vs 18%).
Inhibition of TGF-β signaling has no detectable effects in HEMA culture of JAK2+ and CALR+ PMF
Also in HEMA culture of PMF, similar 2-fold increases in the number of progenitor cells were observed by Day 3 in HEMA cultures with and without Dex. The numbers then progressively decreased and became barely detectable by Day 10 (Figs. 6A and S4). The presence of SB431542 had no effect on the number of CFC generated both in the presence and in the absence of Dex. Donor-related difference was observed in cultures without Dex where Mean CFC numbers did not differ between patient groups at Day 3 or Day 10 but were statistically significant (p=0.010) at Day 6. In cultures with Dex, at Day 3, 6, and 10, the two groups did not significantly differ.
Figure 6. Effect of SB431542 on the expansion of progenitor (A) and precursor (B,C) cells in HEMA cultures of MNC from PMF patients carrying JAK2V617F or CALRpQ365fs mutations with (bottom panel) or without (top panel) Dex.
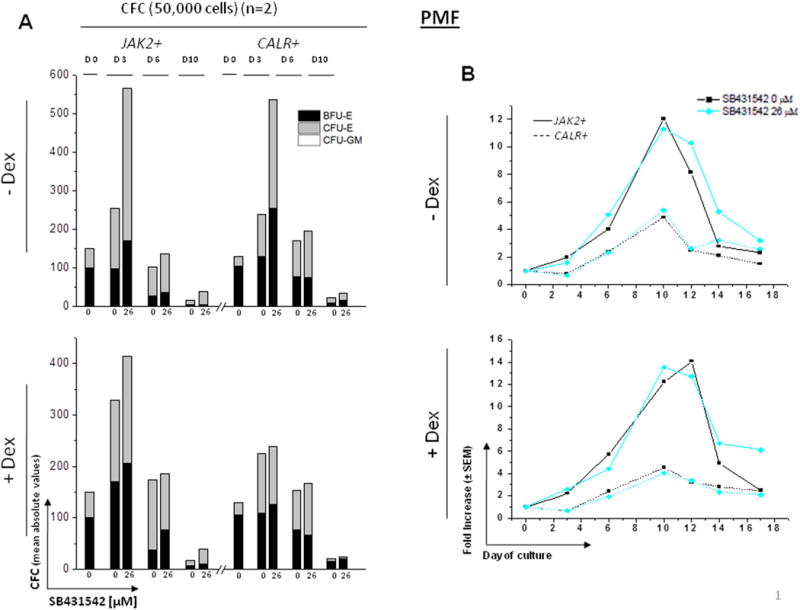
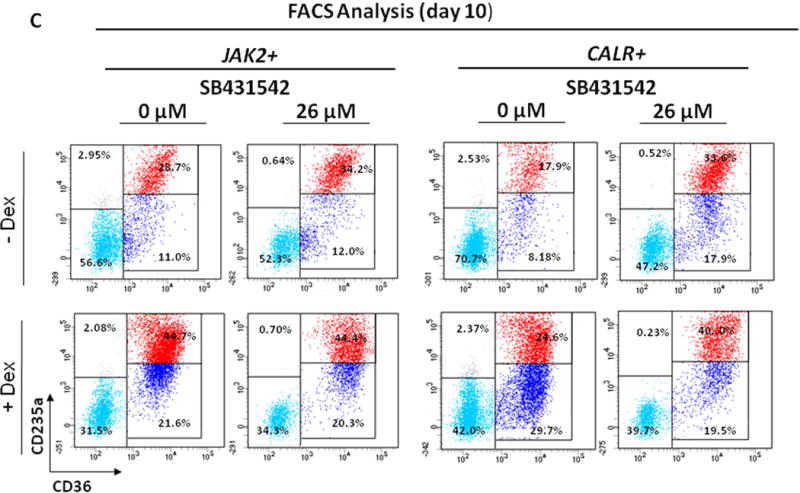
A) Cultured cells were collected at 0, 3, 6 and 10 Days of HEMA cultures of PMF containing indicated concentrations of SB431542 (0 and 26 μM) and their progenitor cell content evaluated as colony forming cells (CFC) in semisolid cultures. Results are presented as Mean of those obtained in two separate experiments, each one with a different donor. Statistical analysis was performed by Student’s t-test and the results are summarized in Fig. S4. See legend to Fig. 3 for further details.
B) Cells generated by MNC from PMF patients carrying JAK2V617F (straight lines) or CALRpQ365fs (dotted lines) mutations cultured in HEMA in the presence of SB431542 (0 or 26 μM) over time (0, 3, 6, 10, 12, 14 and 17 Days). Results are presented as fold increase with respect to Day 0 and are presented as Mean (± SEM) for two separated experiments each one with a different donor. Statistical analysis was performed by mixed models and Student’s t-test and the results are summarized in Fig. S4. Similar results were obtained in two additional experiments with separate JAK2+-PMF.
C) Representative flow cytometric analyses for CD36 and CD235a of cells from PMF patients cultured for 10 Days in the absence or presence of Dex and treated with SB431542 (0 or 26 µM), as indicated. Results are representative of those observed in two experiments.
The number of Erys in cultures without Dex: Fold change statistically significantly varied over time both in HEMA culture of JAK2+- and CALR+-PMF (p<0.001) and that change over time differed in the cultures of the two patients (interaction p=0.001), with a statistically significant difference observed at Day 3 (p=0.037), Day 10 (p=0.005), and Day 12 (p=0.024). In cultures with Dex: Fold change statistically significantly varied over time across groups (p<0.001) and again change over time differed in the cultures of the two patients (interaction p=0.002), with a statistically significant difference observed between groups at Day 10 (p=0.006) and Day 12 (p=0.005). Similar results were obtained in additional experiments with two different PMF patients (one JAK2+ and one JAK2−, data not shown).
The difference in growth observed in cultures of JAK2+- and CALR+-PMF probably reflects a sampling variability rather than alterations induced by the two driver mutations because no difference was observed in the number of Erys generated by a larger cohort of JAK2+- (fold increase = 8.3 vs 7.8 with and without Dex, n=5) and CALR+- (fold change = 7.8 vs 5 with and without Dex, n=3) PMF.
By flow cytometric analysis, HEMA cultures of both JAK2+- and CALR+-PMF contained similar numbers (70–30%) of Erys in cultures with and without Dex and the frequency of these cells, as well as their maturation state, was not affected by the presence of SB431542 (Fig. 6C).
Mechanistic insights on ontogenetic (AB vs CB) and disease (AB vs PV vs PMF)-specific effects of inhibition of TGF-β signaling on Ery expansion in HEMA
Generation of Erys in culture involves different cell compartments over time. During the first three days, CD34+ cells exit from quiescence to generate erythroid progenitor cells [36] that give rise to proerythroblasts by Day six. By Day 10–14, in the absence of Dex, these erythroblasts undergo terminal maturation while in its presence retain proliferative potential generating more Erys [37]. Therefore the total numbers of Erys generated ex-vivo is determined by the speed with which CD34+ cells turn into progenitor cells and by the number of proliferations occurring within the progenitor and proerythroblast compartments [37,38]. TGF-β may inhibit this process by retaining CD34+ cells into quiescence [21] and by reducing the proliferation of both progenitor cells, by increasing the length of their cell cycle [22] and, proerythroblasts, by accelerating their maturation [25,26]. This last effect is antagonistic to that of Dex. In AB cultures, SB431542 induced mostly late erythropoiesis (Fig 3), suggesting that TGF-β affects mostly the late stage of maturation of adult Erys; By contrast, the effects of SB431542 in cultures of CB (Fig. 4) suggest that TGF-β affects mostly proliferation of neonatal progenitor cells but has little effect at the precursor levels while those observed in cultures of PV (Fig. 5) indicate that TGF-β alters both the proliferation of these malignant progenitor cells and the maturations of Erys which they give rise to. SB431542 was ineffective in PMF, suggesting that these malignant cells are insensitive to TGF-β at all stages of maturation (Fig. 6). To gain mechanistic insights in these ontogenetic- and disease-specific observations, the effects of SB431542 on the proliferation of CD34+ cells and of Day 10 Erys from the different sources were compared.
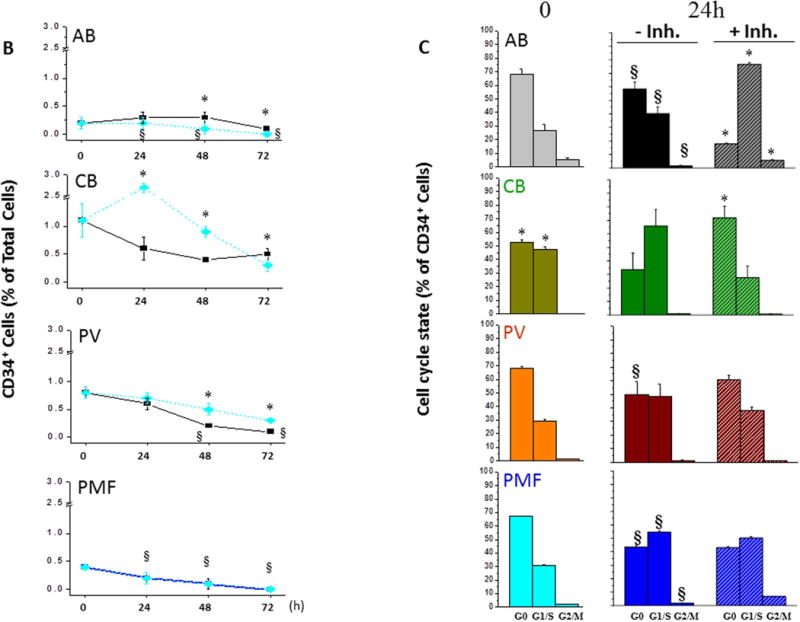
The effects of SB431542 on the proliferation of CD34+ cells are described in Fig. 7. At time 0, the frequency of CD34+ cells in MNC from AB was similar to that of CB, PV and PMF (Fig. 7A,B), consistent with the knowledge that blood donation induces stem/progenitor cell mobilization [39]. In cultures of AB without SB431542, the frequency of CD34+ cells significantly increased by 1.5–2-fold by 24–48h and became barely detectable by 72h. SB431542 accelerated the loss of AB CD34+ cells, the frequency of which was statistically lower from that without SB431542 at all time-points. In culture of CB without SB431542, the frequency of CD34+ cells remained constant up to 72h while in those exposed to SB431542 the frequency of CD34+ cells increased by 2.5-fold by 24h and remained significantly greater than that observed without SB431542 at 24h and 48h. In cultures of PV without SB431542, the frequency of CD34+ cells progressively declined and became barely detectable by 48–72h while this decline was significantly retarded by SB431542. In culture of PMF, the frequency of CD34+ cells decreased by 24h and was barely detectable by 48–72h both with and without SB431542.
Figure 7. Effect of SB431542 on the frequency and cell cycle state of CD34+ cells from AB, CB, PV and PMF cultured for 0, 24, 48 and 72h in HEMA.
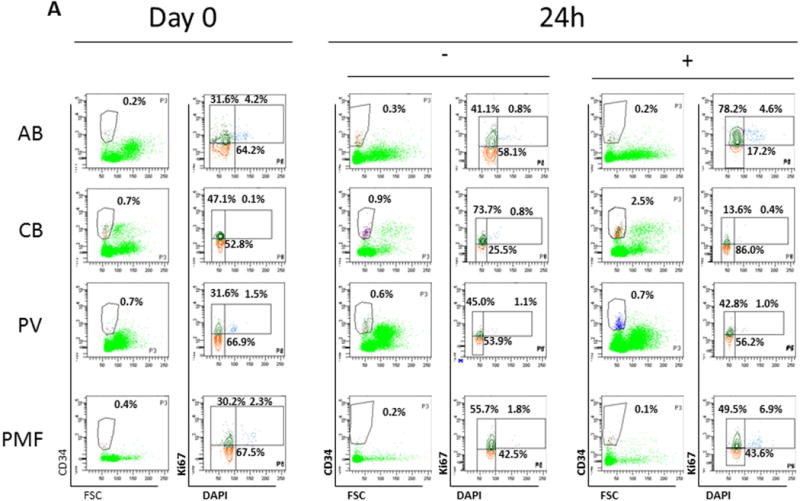
A) Representative scatter plots for forward side scatter (FSC)/CD34 staining and DAPI/Ki67 of MNC from AB, CB, PV and PMF. Cells were analysed at day 0 and after 24h of culture with (+Inh) or without (-Inh) SB431542, as indicated. The contour in the FCS/CD34 plot indicates the gating used for the cell cycle analyses by DAPI/Ki67 staining. The DAPI/Ki67 staining used to identify cells in G0 (low/low, red), G1/S (low/high, green) and G2/M (high/high) is also indicated. The numbers within the quadrant indicate the frequency of the cells in the different gating of these representative experiments. The cell cycle state of CD34+ cells at 48–72h are not presented because the data are not interpretable due to low CD34+ cell frequencies (data not shown). Results are representative of those obtained in 5–6 experiments with AB and three experiments each for CB, JAK2+-PV (allele burden unknown) and PMF (two JAK2+ and one JAK2−).
B) Frequency of CD34+ cells over time (0, 24, 48 and 72h) in culture of MNC from AB, CB, PV and PMF with (black line) or without (blue line) SB431542. Results are presented as Mean (±SD) of 5–6 experiments with AB and three experiments each for CB, PV and PMF. Results obtained without SB431542 are compared with those at 0h (§, p<0.01–0.0001 by paired t-test) while those obtained with SB431542 are compared to the same data-point without SB431542 (*,p<0.01–0.0001 by paired t-test).
C) Frequency of CD34+ cells in G0, G1/S, G2/M at time 0 or after 24h of culture with (+inh) and without (-inh) SB431542, as indicated. Results are presented as Mean (±SD) of 5–6 experiments with AB and three experiments each for CB, PV and PMF. At 0h, * indicated values statistically different (p<0.001 by t-test) from those in AB. At 24h, results obtained without SB431542 are compared with those at 0h (§,p<0.001by paired t-test) while those obtained with SB431542 are compared to the same data-sets without SB431542 (*, p<0.001 by paired t-test).
The cell cycle state of CD34+ cells from AB, CB, PV and PMF at 0h and 24h with and without SB431542 is compared in Fig. 7A,C. As expected [40], significantly less CB CD34+ cells were in G0 than those from AB while a corresponding greater number of CB cells were in G1/S. By contrast, the cell cycle state of CD34+ cells from PV and PMF was similar to that of AB. After 24h without SB431542, significantly less AB CD34+ cells were in G0 and more in G1/S than at 0h (by 1.5-fold). The presence of SB431542 further decreased the frequency of AB CD34+ cells in G0 down to 15% while increasing that of G1/S cells >70%, suggesting that inhibition of TGF-β signaling increases the number of AB CD34+ cells which entered into cell cycle. By contrast, 24h culture did not alter the cell cycle state of CD34+ cells from CB, which were already maximally in cycle, and SB431542 increased the frequency of CB CD34+ cells in G0. This snapshot observation is consistent with the increased CD34+ cell frequency observed after 24h in culture of CB with SB431542 and suggests that inhibition of TGF-β signaling induced CB CD34+ cells that had completed their cell cycle into G0. Similar to AB, 24h without SB431542 significantly reduced the frequency of CD34+ in G0 from PV and PMF and increased that in G1/S from PMF but, in contrast to AB, SB431542 had no effect on the cell cycle state of CD34+ cells from either PV or PMF. These results suggest that inhibition of TGF-β signaling accelerates differentiation of CD34+ cells from AB, retards that of CD34+ cells from CB and PV but has no effect on that of CD34+ cells from PMF.
The effects of SB431542 on the proliferation rates of Days 10 Erys from AB, CB, PV and PMF are presented in Fig. 8. Erys from AB (by 30%) and PV (by 2.5-fold) proliferated significantly more in the presence of SB431542 than in its absence while the proliferation rates of Erys from CB and PMF were the same in the presence and in the absence of SB431542. These results suggest that inhibition of TGF-β signaling promotes proliferation of Erys from AB and PV but has no effect on that of Erys from CB or PMF.
Figure 8. Proliferation of Days 10 Erys from AB, CB, PV and PMF after 24h culture either in absence or in the presence of growth factors (GFs) or in the presence and absence of SB431542 (inh).

Results are expressed in percent of those observed with GFs without inhibitor and are presented as Mean (±SD) of those observed in two experiments performed in triplicate. In the case of AB (p=0.00154) and PV (p=0.00153), results obtained with GFs + SB431542 are statistically different from those observed with GFs alone (by paired t-test), as indicated by *. Proliferation in the presence of GFs alone (100%) was 0.32±0.09 for AB, 0.71±0.16 for CB, 0.30±0.07 for PV and 0.31±0.06 for PMF. The donors are the same as in Fig. 7.
The differential effects exerted by inhibition of TGF-β signaling on the proliferation rates of Erys from AB, CB and PV described above were mirrored by differences in the activation state in these cells of the first elements of the two independent canonical TGF-β signaling (Serine phosphorylation levels of the linker domain of SMAD2 and SMAD1/SMAD5/SMAD8) [41,42] and of the first element (SHC) of the non-canonical signaling leading to ERK activation [43] revealed by phosphoproteomic RPPA profiling of Erys expanded from these three sources with and without Dex (Fig. 9). In agreement with the ELISA data (Fig. 2), no significant differences were observed in the levels of TGF-β, included in the RPPA array as control, expressed by Erys from the three sources in cultures with and without Dex. The only exception was that RPPA detected a modest but (fold change > 0.5) significantly greater level of TGF-β in Erys from PV with Dex than in those without Dex (Fig. 9A) and may reflect inefficient secretion of TGF-β in culture by Erys.
Figure 9. Characterization of TGF-β signaling pathway in Day 10 Erys from AB, CB and JAK2+-PV by Reverse Phase Protein Array.
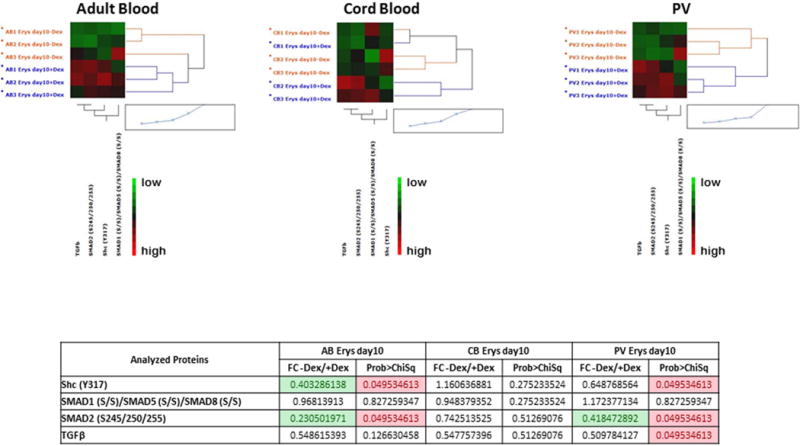
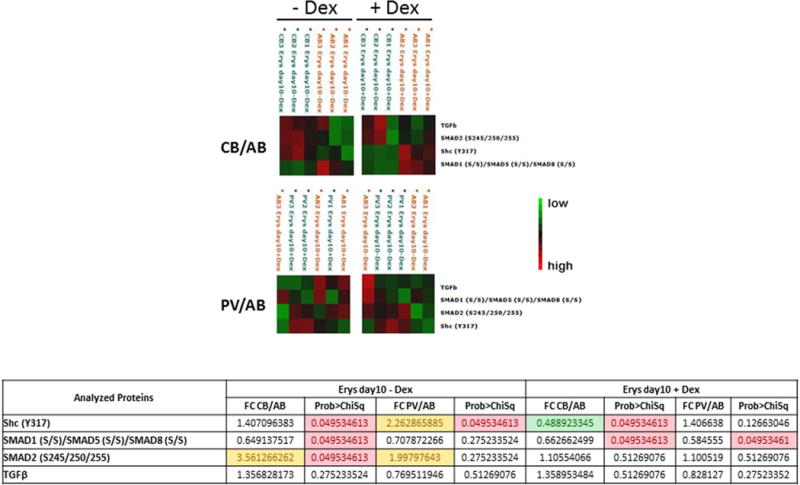
(the complete phosphoproteomic data set is available at http://capmm.gmu.edu/data).
A) Hierarchical clustering representing Erys expanded from three separate AB, CB and JAK2+-PV (allele burden 67, 88 and 94%) respectively) in cultures with (blue) or without (red) Dex (horizontal axis) and the analyzed total or phospho-proteins (vertical axis). Specific endpoint relative intensity values have been used to create the heatmap after overall standardization. Within the heatmap, red color represents higher levels of relative activity/expression; black represents intermediate levels, and green represents lower levels of relative activity/expression. The table on the bottom summarizes the results as fold-change (FC) between minus Dex/plus Dex) for each group. Fold-changes <0.5 are highlighted in green. Group mean differences statistically significant (p<0.05) are highlighted in pink. The comparison of data from PV with and without Dex was already reported [34].
B) Hierarchical clustering representing Erys expanded from three separate AB with (left panels) and without (right panel) Dex with respect to the same cells obtained under the same conditions from CB (top panels) or JAK2+-PV (the same donors as in A) (horizontal axis) and the analyzed total or phospho-proteins (vertical axis). See legend to Fig. 9A for further detail. Fold-changes (FC) between CB and AB and PV and AB obtained minus Dex and plus Dex are summarized in the Table on the bottom. Fold-changes <0.5 or <1.5 are highlighted in green and yellow, respectively. Group mean differences statistically significant (p<0.05) are highlighted in pink. The comparison of data obtained from AB and PV with Dex was already reported [34].
Day 10 Erys obtained from AB and PV without Dex expressed significantly lower levels of SHC and SMAD2 activation and similar levels of SMAD1/SMAD5/SMAD8 activation than those obtained from the same sources with Dex. By contrast, all these signaling elements were activated at similar levels in Day 10 Erys obtained from CB without and with Dex (Fig. 9A). These results suggest that Dex renders more susceptible adult (AB and PV), but not neonatal (CB), Erys to activation of TGF-β signaling. In culture without Dex, Day 10 Erys from CB and PV expressed greater levels of SHC and SMAD2 activation and lower levels of SMAD1/SMAD5/SMAD8 activation (significant only for CB) than those from AB. The activation state of SMAD1/SMAD5/SMAD8 was significant lower than in AB also in Day 10 Erys from CB cultured with Dex but the activation state of SMAD2 in CB and PV cells cultured with Dex were similar to that of AB (Fig. 9B). In addition, in culture with Dex, the levels of SHC activation of PV Erys were similar to those of AB while that of CB Erys were significantly lower than in AB.
It has been described that TGF-β inhibits proliferation of adult Erys through activation of SMAD4 [26], an obligatory partner downstream of both the SMAD2- and SMAD1/SMAD5/SMAD8-dependent canonical signaling but the role of the individual canonical pathways, as well as that of the SHC-dependent non-canonical signaling in these cells has not been detailed as of yet. The phosphoproteomic analyses described above confirms the presence of similarities but also of important ontogenetic- (AB vs CB) and disease (AB vs PV)-specific differences in the activation state of TGF-β signaling in Erys which deserve further investigation by dedicated studies.
DISCUSSION
In spite of the overwhelming evidence for the active role exerted by alterations in TGF-β signaling in the pathobiology of PMF, the details of the pathobiological mechanism(s) underlying this growth factor to sustain disease progression has not been completely clarified.
The knowledge that TGF-β signaling induces normal HSC into quiescence through the SMAD pathway [21, 29], which is not activated in PMF [4, 28], suggested to us that TGF-β may promote proliferation of the malignant clone by directly and competitively suppressing the growth of normal HSC (Fig. 1). This hypothesis was tested by comparing the effects of SB431542, an inhibitor targeting ALK5, the first element of the canonical TGF-β R1 signaling [44], on the growth in vitro of hematopoietic progenitor and precursor cells derived from MNC from normal controls (AB and CB) or from JAK2+-PV or JAK2+- and CALR+-PMF. Since TGF-β exerts a predominantly inhibitory effect on erythroid differentiation [25, 26], the cultures were exposed either to the presence or absence of Dex, in order to promote the generation of erythroid cells (Dex) or of cells of multiple lineages (no Dex). The results obtained indicate that, with same variegation, SB431542 promoted proliferation of hematopoietic progenitor and precursor cells from normal sources (AB and CB) and PV patients, but had no effect on the growth of progenitor and precursor cells from PMF. Since the levels of TGF-β in the cultures of the three experimental groups (normal sources, PV and PMF) were similar, it is unlikely that the differences in the effects exerted by SB431542 reflect the amount of ligand to be neutralized. The consistency, at least at the Ery level and for AB, CB and PV, between the response to SB431542 and the phosphoproteomic state of the canonical and non-canonical TGF-β signaling suggests instead that the different responses are due to intrinsic baseline differences in the state of this pathway in Erys derived from the three sources. Unfortunately, phosphoproteomic data in support of the results obtained with PMF are not available as yet.
The observation that SB431542 increased by 1.5–2-fold the number and cell cycle state of normal CD34+ cells while leaving unaffected that of the malignant clones suggests that treatment of PMF with a TGF-β R1 kinase inhibitor will provide a selective proliferative advantage to normal HSC over MPN cells especially if in vivo the treatment will also reduce, as predicted by the results in Gata1low mice [4], the presence of the myelofibrosis-specific HSC niches in the spleen (Fig. 1). Eventually, this would lead to overall reduction of malignant megakaryocytes, the major source of TGF-β [1, 4, 45], initiating a positive autogenous cycle that would restore the normal homeostasis of TGF-β. A further contribution to this positive cycle may come from the fact that inhibition of canonical TGF-β signaling will also reduce transcription of the TGF-β gene itself, since activation of the transcription of its own gene is one of the pleiotropic effects exerted by this growth factor [14]. Consistent with this hypothesis, treatment with SB431542 greatly reduced the levels of TGF-β mRNA expressed by bone marrow and spleen cells from Gata1low mice [4].
The autogenous positive cycle discussed above may explain the apparent “treatment paradox” observed in Gata1low mice. In fact, in this model, treatment with the TGF-β R1 kinase inhibitor completely rescued traits presumably sustained by non-canonical MAPK signaling activated by the TGF-β R2 dimer [44] such as fibrosis in the marrow and presence of activated fibrocytes in the spleen (Fig. 1). We hypothesize that SB431542 inhibited the non-canonical pathway indirectly by reducing the level of expression of TGF-β.
A corollary of the hypothesis that TGF-β R1 kinase inhibition ignites a positive autogenous cycle that eventually restores normal regulation of TGF-β in PMF is that continuous administration of the inhibitor is not necessary for effective treatment. This corollary, supported by the results obtained in Gata1low mice which remained disease-free for one month after treatment with SB431542 for two cycles of five days pulse dosing [4], has great clinical implication and significance. Given the many pleiotropic effects exerted by TGF-β [20, 44], long term inhibition of this growth factor is expected to exert severe cardio and rheumatologic toxicity [44], and may even lead to hematopoietic failure by exhausting normal HSC. Pulsed treatments with TGF-β R1 kinase inhibitors followed by drug holiday would be expected to limit off target toxicity. Consistent with this hypothesis, Gata1low mice treated by brief cycles of SB431542 expressed no sign of toxicity and actually demonstrated increased mobility [4], a sign of reduction in the osteoarthritis that affects these animals with advancing age [7, 46].
The overarching therapeutic hypothesis that TGF-β inhibition may effectively treat PMF described in Fig. 1 was already tested in a limited clinical trial with GC1008 (Fresolimumab, Sanofi Aventis), a human monoclonal antibody that neutralizes the mammalian isoforms of TGF-β [47]. This trial provided evidence of reduced bone marrow fibrosis and sustained improvements in hemoglobin level in at least two of the three patients treated, lasting greater than one year after study drug discontinuation (personal communication JM). Unfortunately, the trial was interrupted prematurely due to pharmaceutical company decision to discontinue antibody production and distribution for clinical investigation. Although SB431542 is not suited for clinical use, galunisertib (LY2157299, Lilly), a small molecule TGF-β R1 kinase inhibitor, presents an opportunity to test this therapeutic approach in patients with PMF. Galunisertib is structurally similar, but twice as potent as SB431542 (AKL5 ID50 = 56 vs 94 nM, respectively) and is currently being evaluated in clinical trials of fibrotic disease states and myelodysplastic syndrome. The therapeutic potential of galunisertib in PMF will soon be evaluated in a multi-center, phase II trial conducted by the MyeloProliferative Disorder-Research Consortium (MPD-RC 118). This important trial will provide the opportunity for correlative studies to validate the proposed mechanisms of action of TGF-β R1 kinase inhibitor therapy in PMF and will advance our understanding of the pathobiologic role of TGF-β in PMF.
Supplementary Material
Acknowledgments
This study was supported by grants from the National Cancer Institute (P01-CA108671) and Associazione Italiana Ricerca sul Cancro (AIRC 17608).
Footnotes
Disclosure of conflict of interest
The authors have no conflict of interest to declare.
References
- 1.Schmitt A, Jouault H, Guichard J, Wendling F, Drouin A, Cramer E-M. Pathologic interaction between megakaryocytes and polymorphonuclear leukocytes in myelofibrosis. Blood. 2000;96:1342–1347. [PubMed] [Google Scholar]
- 2.Ciurea SO, Merchant D, Mahmud N, et al. Pivotal contributions of megakaryocytes to the biology of idiopathic myelofibrosis. Blood. 2007;110:986–993. doi: 10.1182/blood-2006-12-064626. [DOI] [PMC free article] [PubMed] [Google Scholar]
- 3.Campanelli R, Rosti V, Villani L, et al. Evaluation of the bioactive and total transforming growth factor β1 levels in primary myelofibrosis. Cytokine. 2011;53:100–106. doi: 10.1016/j.cyto.2010.07.427. [DOI] [PubMed] [Google Scholar]
- 4.Zingariello M, Martelli F, Ciaffoni F, et al. Characterization of the TGF-beta1 signaling abnormalities in the Gata1low mouse model of myelofibrosis. Blood. 2013;121:3345–3363. doi: 10.1182/blood-2012-06-439661. [DOI] [PMC free article] [PubMed] [Google Scholar]
- 5.Chagraoui H, Komura E, Tulliez M, Giraudier S, Vainchenker W, Wendling F. Prominent role of TGF-beta 1 in thrombopoietin-induced myelofibrosis in mice. Blood. 2002;100:3495–3503. doi: 10.1182/blood-2002-04-1133. [DOI] [PubMed] [Google Scholar]
- 6.Gastinne T, Vigant F, Lavenu-Bombled C, et al. Adenoviral-mediated TGF-beta1 inhibition in a mouse model of myelofibrosis inhibit bone marrow fibrosis development. Exp Hematol. 2007;35:64–74. doi: 10.1016/j.exphem.2006.08.016. [DOI] [PubMed] [Google Scholar]
- 7.Vannucchi AM, Bianchi L, Cellai C, et al. Development of myelofibrosis in mice genetically impaired for GATA-1 expression (GATA-1(low) mice) Blood. 2002;100:1123–1132. doi: 10.1182/blood-2002-06-1913. [DOI] [PubMed] [Google Scholar]
- 8.Centurione L, Di Baldassarre A, Zingariello M, et al. Increased and pathological emperipolesis of neutrophils within megakaryocytes associated with marrow fibrosis in GATA-1low mice. Blood. 2004;104:3573–3579. doi: 10.1182/blood-2004-01-0193. [DOI] [PubMed] [Google Scholar]
- 9.Vannucchi AM, Bianchi L, Paoletti F, et al. A patho-biological pathway linking thrombopoietin, GATA-1 and TGF-β1 in the development of myelofibrosis. Blood. 2005;105:3493–3501. doi: 10.1182/blood-2004-04-1320. [DOI] [PubMed] [Google Scholar]
- 10.Vannucchi AM, Pancrazzi A, Bianchi L, et al. Abnormalities of GATA-1 in megakaryocytes from patients with idiopathic myelofibrosis. Am J Pathol. 2005;167:849–858. doi: 10.1016/S0002-9440(10)62056-1. [DOI] [PMC free article] [PubMed] [Google Scholar]
- 11.Wang X, Prakash S, Lu M, et al. Spleens of myelofibrosis patients contain malignant hematopoietic stem cells. J Clin Invest. 2012;122:3888–3899. doi: 10.1172/JCI64397. [DOI] [PMC free article] [PubMed] [Google Scholar]
- 12.Spangrude GJ, Lewandowski D, Martelli F, et al. P-Selectin Sustains Extramedullary HEMAtopoiesis in the Gata1(low) Model of Myelofibrosis. Stem Cells. 2016;34:67–82. doi: 10.1002/stem.2229. [DOI] [PubMed] [Google Scholar]
- 13.Migliaccio AR, Martelli F, Verrucci M, et al. Gata1 expression driven by the alternative HS2 enhancer in the spleen rescues the hematopoietic failure induced by the hypomorphic Gata1low mutation. Blood. 2009;114:2107–2120. doi: 10.1182/blood-2009-03-211680. [DOI] [PMC free article] [PubMed] [Google Scholar]
- 14.Zingariello M, Ruggeri A, Martelli F, et al. A novel interaction between megakaryocytes and activated fibrocytes increases TGF-β bioavailability in the Gata1low mouse model of myelofibrosis. Am J Blood Res. 2015;5:34–61. [PMC free article] [PubMed] [Google Scholar]
- 15.LeBleu VS, Taduri G, O’Connell J, et al. Origin and function of myofibroblasts in kidney fibrosis. Nat Med. 2013;19:1047–1053. doi: 10.1038/nm.3218. [DOI] [PMC free article] [PubMed] [Google Scholar]
- 16.Orimo A, Weinberg R-A. Stromal fibroblasts in cancer: a novel tumor-promoting cell type. Cell Cycle. 2006;5:1597–1601. doi: 10.4161/cc.5.15.3112. [DOI] [PubMed] [Google Scholar]
- 17.Kalluri R, Neilson E-G. Epithelial-mesenchymal transition and its implications for fibrosis. Journal of Clinical Investigation. 2003;112:1776–1784. doi: 10.1172/JCI20530. [DOI] [PMC free article] [PubMed] [Google Scholar]
- 18.Ronnov-Jessen L, Petersen OW, Koteliansky VE, Bissell M-J. The origin of the myofibroblasts in breast cancer. Recapitulation of tumor environment in culture unravels diversity and implicates converted fibroblasts and recruited smooth muscle cells. Journal of Clinical Investigation. 1995;95:859–873. doi: 10.1172/JCI117736. [DOI] [PMC free article] [PubMed] [Google Scholar]
- 19.Kalluri R, Zeisberg M. Fibroblasts in cancer. Nature Reviews Cancer. 2006;6:392–401. doi: 10.1038/nrc1877. [DOI] [PubMed] [Google Scholar]
- 20.Shi Y, Massagué J. Mechanisms of TGF-beta signaling from cell membrane to the nucleus. Cell. 2003;113:685–700. doi: 10.1016/s0092-8674(03)00432-x. [DOI] [PubMed] [Google Scholar]
- 21.Chabanon A, Desterke C, Rodenburger E, et al. A cross-talk between stromal cell-derived factor-1 and transforming growth factor-beta controls the quiescence/cycling switch of CD34(+) progenitors through FoxO3 and mammalian target of rapamycin. Stem Cells. 2008;26:3150–3161. doi: 10.1634/stemcells.2008-0219. [DOI] [PubMed] [Google Scholar]
- 22.Bruno E, Horrigan SK, Van Den Berg D, et al. The Smad5 gene is involved in the intracellular signaling pathways that mediate the inhibitory effects of transforming growth factor-beta on human hematopoiesis. Blood. 1998;91:1917–1923. [PubMed] [Google Scholar]
- 23.Jacobsen FW, Stokke T, Jacobsen S-E. Transforming growth factor-beta potently inhibits the viability-promoting activity of stem cell factor and other cytokines and induces apoptosis of primitive murine hematopoietic progenitor cells. Blood. 1995;86:2957–2966. [PubMed] [Google Scholar]
- 24.Geng Y, Weinberg R-A. Transforming growth factor beta effects on expression of G1 cyclins and cyclin-dependent protein kinases. Proc Natl Acad Sci U S A. 1993;90:10315–10319. doi: 10.1073/pnas.90.21.10315. [DOI] [PMC free article] [PubMed] [Google Scholar]
- 25.Zermati Y, Fichelson S, Valensi F, et al. Transforming growth factor inhibits erythropoiesis by blocking proliferation and accelerating differentiation of erythroid progenitors. Exp Hematol. 2000;28:885–894. doi: 10.1016/s0301-472x(00)00488-4. [DOI] [PubMed] [Google Scholar]
- 26.Choi SJ, Moon JH, Ahn YW, Ahn JH, Kim DU, Han T-H. Tsc-22 enhances TGF-beta signaling by associating with Smad4 and induces erythroid cell differentiation. Mol Cell Biochem. 2005;271:23–28. doi: 10.1007/s11010-005-3456-7. [DOI] [PubMed] [Google Scholar]
- 27.Qiu J, Papatsenko D, Niu X, Schaniel C, Moore K. Divisional history and hematopoietic stem cell function during homeostasis. Stem Cell Reports. 2014;2:473–490. doi: 10.1016/j.stemcr.2014.01.016. [DOI] [PMC free article] [PubMed] [Google Scholar]
- 28.Ciaffoni F, Cassella E, Varricchio L, Massa M, Barosi G, Migliaccio A-R. Activation of non-canonical TGF-β1 signaling indicates an autoimmune mechanism for bone marrow fibrosis in primary myelofibrosis. Blood Cells Mol Dis. 2015;54:234–241. doi: 10.1016/j.bcmd.2014.12.005. [DOI] [PMC free article] [PubMed] [Google Scholar]
- 29.Brenet F, Kermani P, Spektor R, Rafii S, Scandura J-M. TGFbeta restores hematopoietic homeostasis after myelosuppressive chemotherapy. Journal of Experimental Medicine. 2013;210:623–639. doi: 10.1084/jem.20121610. [DOI] [PMC free article] [PubMed] [Google Scholar]
- 30.Gerber EE, Gallo EM, Fontana SC, et al. Integrin-modulating therapy prevents fibrosis and autoimmunity in mouse models of scleroderma. Nature. 2013;503:126–130. doi: 10.1038/nature12614. [DOI] [PMC free article] [PubMed] [Google Scholar]
- 31.Akhmetshina A, Palumbo K, Dees C, et al. Activation of canonical Wnt signalling is required for TGF-beta-mediated fibrosis. Nat Commun. 2012;3:735. doi: 10.1038/ncomms1734. [DOI] [PMC free article] [PubMed] [Google Scholar]
- 32.Migliaccio G, Di Pietro R, di Giacomo V, et al. In vitro mass production of human erythroid cells from the blood of normal donors and of thalassemic patients. Blood Cells Mol Dis. 2002;28:169–180. doi: 10.1006/bcmd.2002.0502. [DOI] [PubMed] [Google Scholar]
- 33.Varricchio L, Tirelli V, Masselli E, Ghinassi B, Besmer P, Migliaccio A-R. The expression of the glucocorticoid receptor in human erythroblasts is uniquely regulated by KIT ligand: implications for stress erythropoiesis. Stem Cells Dev. 2012;21:2852–2865. doi: 10.1089/scd.2011.0676. [DOI] [PMC free article] [PubMed] [Google Scholar]
- 34.Hricik T, Federici G, Zeuner A, et al. Transcriptomic and phospho-proteomic analyzes of erythroblasts expanded in vitro from normal donors and from patients with polycythemia vera. Am J Hematol. 2013;88:723–729. doi: 10.1002/ajh.23487. [DOI] [PMC free article] [PubMed] [Google Scholar]
- 35.Varricchio L, Masselli E, Alfani E, et al. The dominant negative β isoform of the glucocorticoid receptor is uniquely expressed in erythroid cells expanded from polycythemia vera patients. Blood. 2011;118:425–436. doi: 10.1182/blood-2010-07-296921. [DOI] [PMC free article] [PubMed] [Google Scholar]
- 36.Heideveld E, Masiello F, Marra M, et al. CD14+ cells from peripheral blood positively regulate hematopoietic stem and progenitor cell survival resulting in increased erythroid yield. Haematologica. 2015;100:1396–1406. doi: 10.3324/haematol.2015.125492. [DOI] [PMC free article] [PubMed] [Google Scholar]
- 37.Migliaccio G, Masiello F, Tirelli V, et al. Under HEMA conditions, self-replication of human erythroblasts is limited by autophagic death. Blood Cells Mol Dis. 2011;47:182–197. doi: 10.1016/j.bcmd.2011.06.001. [DOI] [PubMed] [Google Scholar]
- 38.Lee HY, Gao X, Barrasa MI, et al. PPAR-α and glucocorticoid receptor synergize to promote erythroid progenitor self-renewal. Nature. 2015;522:474–477. doi: 10.1038/nature14326. [DOI] [PMC free article] [PubMed] [Google Scholar]
- 39.Masiello F, Tirelli V, Sanchez M, et al. Mononuclear cells from a rare blood donor, after freezing under good manufacturing practice conditions, generate red blood cells that recapitulate the rare blood phenotype. Transfusion. 2014;54:1059–1070. doi: 10.1111/trf.12391. [DOI] [PMC free article] [PubMed] [Google Scholar]
- 40.Peschle C, Migliaccio AR, Migliaccio G, et al. Identification and characterization of three classes of erythroid progenitors in human fetal liver. Blood. 1981;58:565–572. [PubMed] [Google Scholar]
- 41.Massagué J, Seoane J, Wotton D. Smad transcription factors. Genes Dev. 2005;19:2783–2810. doi: 10.1101/gad.1350705. [DOI] [PubMed] [Google Scholar]
- 42.Matsuzaki K. Smad phospho-isoforms direct context-dependent TGF-β signaling. Cytokine Growth Factor Rev. 2013;24:385–399. doi: 10.1016/j.cytogfr.2013.06.002. [DOI] [PubMed] [Google Scholar]
- 43.Zhang Y-E. Non-Smad pathways in TGF-beta signaling. Cell Res. 2009;19:128–39. doi: 10.1038/cr.2008.328. [DOI] [PMC free article] [PubMed] [Google Scholar]
- 44.Akhurst RJ, Hata A. Targeting the TGFβ signalling pathway in disease. Nat Rev Drug Discov. 2012;11:790–811. doi: 10.1038/nrd3810. [DOI] [PMC free article] [PubMed] [Google Scholar]
- 45.Vannucchi AM, Bianchi L, Paoletti F, et al. A pathobiologic pathway linking thrombopoietin, GATA-1, and TGF-beta1 in the development of myelofibrosis. Blood. 2005;105:3493–3501. doi: 10.1182/blood-2004-04-1320. [DOI] [PubMed] [Google Scholar]
- 46.Garimella R, Kacena MA, Tague SE, Wang J, Horowitz MC, Anderson H-C. Expression of bone morphogenetic proteins and their receptors in the bone marrow megakaryocytes of GATA-1(low) mice: a possible role in osteosclerosis. J Histochem Cytochem. 2007;55:745–752. doi: 10.1369/jhc.6A7164.2007. [DOI] [PubMed] [Google Scholar]
- 47.Mascarenhas J, Li T, Sandy L, et al. Anti-transforming growth factor-beta therapy in patients with myelofibrosis. Leukemia & Lymphoma. 2014;55:450–452. doi: 10.3109/10428194.2013.805329. [DOI] [PubMed] [Google Scholar]
Associated Data
This section collects any data citations, data availability statements, or supplementary materials included in this article.


