

Abstract
Background
Consumption of almonds or dark chocolate and cocoa has favorable effects on markers of coronary heart disease; however, the combined effects have not been evaluated in a well‐controlled feeding study. The aim of this study was to examine the individual and combined effects of consumption of dark chocolate and cocoa and almonds on markers of coronary heart disease risk.
Methods and Results
A randomized controlled, 4‐period, crossover, feeding trial was conducted in overweight and obese individuals aged 30 to 70 years. Forty‐eight participants were randomized, and 31 participants completed the entire study. Each diet period was 4 weeks long, followed by a 2‐week compliance break. Participants consumed each of 4 isocaloric, weight maintenance diets: (1) no treatment foods (average American diet), (2) 42.5 g/d of almonds (almond diet [ALD]), (3) 18 g/d of cocoa powder and 43 g/d of dark chocolate (chocolate diet [CHOC]), or (4) all 3 foods (CHOC+ALD). Compared with the average American diet, total cholesterol, non–high‐density lipoprotein cholesterol, and low‐density lipoprotein cholesterol after the ALD were lower by 4%, 5%, and 7%, respectively (P<0.05). The CHOC+ALD decreased apolipoprotein B by 5% compared with the average American diet. For low‐density lipoprotein subclasses, compared with the average American diet, the ALD showed a greater reduction in large buoyant low‐density lipoprotein particles (−5.7±2.3 versus −0.3±2.3 mg/dL; P=0.04), whereas the CHOC+ALD had a greater decrease in small dense low‐density lipoprotein particles (−12.0±2.8 versus −5.3±2.8 mg/dL; P=0.04). There were no significant differences between diets for measures of vascular health and oxidative stress.
Conclusions
Our results demonstrate that consumption of almonds alone or combined with dark chocolate under controlled‐feeding conditions improves lipid profiles. Incorporating almonds, dark chocolate, and cocoa into a typical American diet without exceeding energy needs may reduce the risk of coronary heart disease.
Clinical Trial Registration
URL: https://www.clinicaltrials.gov. Unique identifier: NCT01882881.
Keywords: almonds, cardiovascular disease risk factors, dark chocolate, flow‐mediated dilation, lipids and lipoproteins
Subject Categories: Diet and Nutrition
Clinical Perspective
What Is New?
Consumption of almonds alone (42.5 g/d) or combined with dark chocolate (43 g/d) and cocoa (18 g/d) for 4 weeks improved lipid/lipoprotein profiles, when compared with an average American diet with no treatment foods.
The combined consumption of almonds, dark chocolate, and cocoa resulted in a significant reduction in small dense low‐density lipoprotein particles that are recognized as a risk factor for coronary heart disease.
However, neither almonds nor dark chocolate and cocoa affected the markers of vascular health and oxidative stress.
These findings were specific to overweight and obese individuals aged 30 to 70 years.
What Are the Clinical Implications?
On the basis of our findings, incorporating almonds, dark chocolate, and cocoa into a healthy diet that does not exceed energy needs may reduce the risk of coronary heart disease.
Heart disease is the leading cause of mortality in the United States, which accounted for nearly 610 000 deaths in 2015.1 Suboptimal diet quality led to 678 000 annual deaths in 2010; one of the major dietary contributors was low nut consumption, according to the 2016 report of the American Heart Association.1 Previous epidemiologic studies have reported that nut consumption was inversely correlated with the risk of coronary heart disease and all‐cause mortality.2, 3 The PREDIMED (Prevención con Dieta Mediterránea) trial showed that a Mediterranean diet supplemented with mixed nuts (15 g/d walnuts, 7.5 g/d hazelnuts, and 7.5 g/d almonds) reduced the incidence of major cardiovascular events by 28%, compared with the control group that received recommendations to consume a lower‐fat control diet.4 Among different tree nuts, almonds are high in unsaturated fatty acids, particularly oleic acid (18:1) and linoleic acid (18:2), are an excellent source for α‐tocopherol, and contain minerals, plant protein, fiber, and phytosterols.5 A recent meta‐analysis of 18 randomized controlled trials has shown that intake of almonds improved the lipid profile by decreasing total cholesterol (TC), low‐density lipoprotein cholesterol (LDL‐C), and triglycerides.6 Furthermore, almonds improve other cardiovascular risk factors, including insulin resistance,7 endothelial dysfunction,8 inflammation,9 and oxidative stress.10
Observational studies have shown that a higher consumption of dietary flavonoids is associated with a lower risk of coronary heart disease.11, 12 Dark chocolate has a higher amount of flavonoids per weight than red wine, black tea, cranberry juice, and apples.13 The flavonoids, particularly flavanols (ie, catechin, epicatechin, and procyanidins), in dark chocolate may contribute to cardioprotective benefits.14 A meta‐analysis of randomized controlled trials showed that chocolate or cocoa consumption reduced insulin resistance and improved endothelial function and blood pressure in adults.15
The objective of the current study was to investigate the individual and combined effects of dark chocolate, cocoa, and almonds on lipid, lipoprotein, and apolipoprotein concentrations, vascular health, and oxidative stress in overweight and obese individuals. We hypothesized that the individual and combined consumption of dark chocolate, cocoa, and almonds would favorably affect lipids, lipoproteins, apolipoproteins, vascular health, and oxidative stress; the effects would be greatest when dark chocolate, cocoa, and almonds were consumed together compared with an average American diet (AAD).
Methods
Participants
Overweight and obese individuals (body mass index, 25–40 kg/m2), aged 30 to 70 years, with an LDL‐C between the 25th and 95th percentile from the National Health and Nutrition Examination Survey 1999–2000 (105–194 mg/dL for men and 98–190 mg/dL for women) were recruited. Exclusion criteria included smoking, elevated blood pressure (≥159/99 mm Hg), a history of myocardial infarction, stroke, diabetes mellitus, liver disease, kidney disease, thyroid disease (unless controlled by medication), and inflammatory gastrointestinal tract disease. Participants taking the following supplements/medications were excluded unless they were willing to discontinue for the duration of the study: nutritional supplements, herbs, vitamins or minerals, nonsteroidal anti‐inflammatory drugs, cholesterol‐lowering supplements/medications (eg, psyllium, fish oil capsules, soy lecithin, niacin, fiber, flax, and phytoestrogens), and stanol/sterol supplemented foods. Women were excluded if they were lactating, pregnant, or planned to become pregnant during the study. Individuals who followed a vegetarian diet or had nut allergies were excluded. The study protocol was approved by the Institutional Review Board of The Pennsylvania State University (University Park, PA). Written informed consent was obtained from all participants before they were enrolled into the study. All study samples were collected and procedures were conducted at The Penn State Clinical Research Center.
Recruitment, Screening, and Randomization
Participants were recruited from March 2013 to July 2015 via flyers posted on university bulletin boards, local newspaper advertisements, and e‐mail lists at The Pennsylvania State University. Five hundred thirty potential participants e‐mailed or called to express interest in the study. A trained interviewer (Y.L.) conducted the telephone screening, which included a list of medical and lifestyle questions. One hundred forty‐nine people met the inclusion criteria and were scheduled for a screening appointment at The Penn State Clinical Research Center. At the screening visit, height, weight, and blood pressure were measured, and fasting blood samples were collected by staff nurses. The computer‐generated (http://www.randomization.com) randomization scheme utilized a Williams design (i.e., ADBC, BACD, CBDA, DCAB) with permuted block (n=4) randomization (by CEB).
Study Design and Intervention
The study was a randomized, 4‐period, crossover, controlled‐feeding trial. Eligible participants were randomly assigned to receive 1 of 4 diets for 4 weeks. After a 2‐week washout period, participants were crossed over to the subsequent test diet. At baseline and at the end of each diet period, participants fasted overnight and visited the Clinical Research Center on 2 consecutive days for measuring weight, waist circumference, blood pressure, and vascular endothelial function. In addition, fasting blood samples were collected by staff nurses. Participants were given a 24‐hour urine collection kit on the first day of the visit and returned the urine samples on the second day of the visit. All meals and snacks were prepared in The Penn State Metabolic Diet Study Center, where participants picked up food from Monday through Friday. On Fridays, participants were given a cooler containing meals and snacks for Saturday and Sunday. The Metabolic Diet Study Center coordinator and kitchen staff were the only study personnel not blinded to volunteer treatment assignments. The Metabolic Diet Study Center coordinator retained the code (e.g., A corresponds to treatment X) until the study was complete. Outcome assessors (staff nurses and a single sonographer) and study coordinators were blinded to the treatments; however, participants could not be blinded to the treatments because of the presence or absence of treatment foods in their meals and snacks. Participants were asked to weigh themselves and fill out a daily weight log when they picked up food at the diet center. Compliance was assessed by the Diet Study Center coordinators who checked daily weight logs and daily food logs to ensure that participants consumed all meals and snacks provided. Non‐caloric beverages were consumed ad libitum and ≤ 2 alcoholic drinks were allowed each week. In addition, participants were instructed to maintain their physical activity and lifestyle habits throughout the study.
Diets were provided at energy levels that matched individual participants’ daily requirements, which were calculated using the Harris‐Benedict equation16 to maintain body weight throughout the study period, and adjustments were made as needed to maintain participants' weight throughout the study. All participants were given isocaloric weight maintenance diets. Diets were similar, except for the presence or absence of treatment foods; 42.5 g of raw almonds (253 kcal/d), 18 g of natural cocoa powder and 43 g of dark chocolate (251.1 kcal/d), or both (504.1 kcal/d) were provided as a snack (Table 1). The treatment foods accounted for the major differences in the nutrient profile (Table 2). The 4 test diets were as follows: (1) AAD, composed of the same foods as the other diets, with the exception of almonds, dark chocolate, and cocoa. In the AAD, butter, cheese, and refined grains were isocalorically substituted for the treatment foods in the other test diets. (2) Almond diet (ALD), which included almonds and was lower in saturated fatty acids (8% compared with 13%) and higher in monounsaturated fatty acids (16% compared with 13%) and polyunsaturated fatty acids (9% compared with 7%) compared with the AAD. (3) Chocolate diet (CHOC), which contained the same foods as the ALD, but natural cocoa powder and dark chocolate were isocalorically substituted for almonds. (4) CHOC+ALD, which contained natural cocoa powder, dark chocolate, almonds, and less butter, cheese, and refined grains. This diet had the most fiber (32 g) because of the fiber content of dark chocolate, natural cocoa, and almonds. Average energy intake was 2500±426 kcal/d and ranged from 1800 to 3300 kcal/d: men, 2772±294 kcal/d (range, 2400–3300 kcal/d); and women, 2123±258 kcal/d (range, 1800–2400 kcal/d). All diets used the same 6‐day cycle menu. An example of food substitution in a sample 1‐day menu is presented in Table 3. Menus were developed using Food Processor SQL software, version 10.8 (ESHA Research, Salem, OR).
Table 1.
Nutrient Profiles of Test Materials
| Nutrients | Almonds | Dark Chocolate+Cocoa Powder | Almonds+Dark Chocolate+Cocoa Powder |
|---|---|---|---|
| Product per day, g | 42.5 | 61.0 | 103.5 |
| Calories, kcal | 253.0 | 251.1 | 504.1 |
| Protein, g | 9.0 | 7.2 | 16.2 |
| Carbohydrate, g | 9.0 | 34.2 | 43.2 |
| Fat, g | 22.1 | 15.2 | 37.3 |
| SFAs, g | 1.7 | 9.4 | 11.1 |
| Trans fat, g | 0.0 | 0.1 | 0.1 |
| MUFAs, g | 13.8 | 5.1 | 18.9 |
| PUFAs, g | 5.5 | 0.6 | 6.1 |
| Cholesterol, mg | 0.0 | 5.5 | 5.5 |
| Fiber, g | 4.6 | 7.3 | 11.9 |
| Sugars, g | 1.8 | 22.7 | 24.5 |
| Sodium, mg | 1.0 | 122.9 | 123.9 |
| Potassium, mg | 303.0 | 512.0 | 815.0 |
| Calcium, mg | 114.0 | 107.5 | 221.5 |
| Iron, mg | 2.0 | 3.6 | 5.6 |
| Caffeine, mg | 0.0 | 39.8 | 39.8 |
| Theobromine, mg | 0.0 | 422.7 | 422.7 |
| Total proanthocyanidins, mg | 1.9 | 271.9 | 273.8 |
MUFA indicates monounsaturated fatty acid; PUFA, polyunsaturated fatty acid; and SFA, saturated fatty acid.
Table 2.
Nutritional Composition of Test Diets at the 2100‐kcal Level
| Nutrients | AAD | ALD | CHOC | CHOC+ALD |
|---|---|---|---|---|
| Total energy, kcal | 2088 | 2098 | 2079 | 2076 |
| Carbohydrates | 260 (49) | 264 (48) | 285 (51) | 272 (49) |
| Protein | 89 (17) | 87 (16) | 84 (16) | 87 (16) |
| Total fat | 81 (34) | 83 (36) | 76 (33) | 82 (35) |
| SFAs | 29 (13) | 20 (8) | 27 (12) | 20 (9) |
| MUFAs | 29 (13) | 37 (16) | 29 (12) | 38 (16) |
| PUFAs | 15 (7) | 20 (9) | 15 (6) | 19 (8) |
| Cholesterol, mg | 262 | 152 | 157 | 115 |
| Fiber | 23 | 27 | 28 | 32 |
| Magnesium, mg | 266 | 371 | 251 | 358 |
| Calcium, mg | 1125 | 916 | 874 | 855 |
| Sodium, mg | 3311 | 2889 | 2967 | 2633 |
| Potassium, mg | 2787 | 2993 | 2998 | 3219 |
Data are given as grams (percentage of energy) unless otherwise specified. The average of the nutrient composition from 6‐day menus is presented. All nutrients were analyzed by Food Processor SQL software, version 10.8. AAD indicates average American diet; ALD, almond diet; CHOC, chocolate diet; CHOC+ALD, chocolate and almond diet; MUFA, monounsaturated fatty acid; PUFA, polyunsaturated fatty acid; and SFA, saturated fatty acid.
Table 3.
Example of 1‐Day Sample Menus for the Test Diets
| AAD | ALD | CHOC | CHOC+ALD |
|---|---|---|---|
| Breakfast | |||
| Granola (68g) | Granola (68g) | Granola (68g) | Granola (68g) |
| Croissant (40g) | Almonds (1oz.) | Cocoa beverage (18g) | Cocoa beverage (18g) |
| Butter (9g) 2% Milk (227g) | 2% Milk (227g) | 2% Milk (227g) | 2% Milk (227g) |
| 2% Milk (227g) | |||
| Lunch | |||
| White bread (50g) | White bread (50g) | White bread (50g) | White bread (50g) |
| Pretzels (28g) | Pretzels (28g) | Pretzels (28g) | Pretzels (28g) |
| Baby carrots (60g) | Baby carrots (60g) | Baby carrots (60g) | Baby carrots (60g) |
| Mayonnaise (20g) | Mayonnaise (20g) | Mayonnaise (20g) | Mayonnaise (20g) |
| Celery (45g) | Celery (45g) | Celery (45g) | Celery (45g) |
| Hummus (40g) | Hummus (40g) | Hummus (40g) | Hummus (40g) |
| Pear (178g) | Pear (178g) | Pear (178g) | Pear (178g) |
| Tuna fish (85g) | Tuna fish (85g) | Tuna fish (85g) | Tuna fish (85g) |
| Dinner | |||
| Beef gravy (58g) | Beef gravy (58g) | Beef gravy (58g) | Beef gravy (58g) |
| Meatloaf with potatoes (70g, 105g) | Meatloaf with potatoes (70g, 105g) | Meatloaf with potatoes(70g, 105g) | Meatloaf with potatoes (70g, 105g) |
| Green beans (61g) | Green beans (61g) | Green beans (61g) | Green beans (61g) |
| Vanilla pudding (99g) | Vanilla pudding (99g) | Vanilla pudding (99g) | Vanilla pudding (99g) |
| Dinner roll (32g) | Dinner roll (32g) | Dinner roll (32g) | Almonds (1oz.) |
| Butter (6g) | Butter (6g) | Butter (6g) | |
| Snack | |||
| Saltines (35g) | Saltines (35g) | Saltines (35g) | Saltines (35g) |
| Cheddar cheese (33g) | 3/4 Cheese (25g) | 3/4 Cheese (25g) | Almonds (0.5oz.) |
| Almonds (0.5oz.) | Dark chocolate (43g) | Dark chocolate (43g) | |
Based on a 2100 kcal/day menu. AAD indicates average American diet; ALD, almond diet; and CHOC, chocolate diet; CHOC+ALD, chocolate and almond diet.
Blood Sample Collection
Blood samples were collected by venipuncture on 2 consecutive days at baseline and at the end of each treatment period. Participants fasted for 12 hours and were asked not to consume alcohol and any medications for 48 and 24 hours, respectively. Blood was drawn into EDTA‐containing tubes, centrifuged at 4°C for 15 minutes, and stored at −80°C until the analyses were conducted.
Serum Lipids, Lipoproteins, and Apolipoproteins
TC and triglycerides were measured by enzymatic analysis (Quest Diagnostics, Pittsburgh, PA; coefficient of variation [CV], <2% for both measurements). High‐density lipoprotein cholesterol (HDL‐C) was measured according to the modified heparin‐manganese procedure (CV, <2%). The Friedewald equation [LDL‐C=TC−(HDL‐C+triglycerides/5)] was used to calculate LDL‐C.17 In addition, serum concentrations of lipids, lipoproteins, and apolipoproteins were measured using the Vertical Auto Profile test18 (Atherotech Diagnostics Lab, Birmingham, AL), a comprehensive test for all lipoprotein classes and subclasses: TC, direct measurement of LDL‐C, HDL‐C, non–HDL‐C, triglycerides, lipoprotein(a), intermediate‐density lipoprotein cholesterol (IDL‐C), very‐low‐density lipoprotein cholesterol (VLDL‐C), and subclasses of LDL‐C, HDL‐C, VLDL‐C, and IDL‐C. Apolipoproteins were calculated using equations according to Kulkarni et al.19
Serum Glucose, Insulin, and C‐Reactive Protein
Glucose was measured by spectrophotometry (Quest Diagnostics, Pittsburgh, PA). Plasma fasting insulin was measured by immunoassay (Quest Diagnostics). Serum high‐sensitivity C‐reactive protein was measured by latex‐enhanced immunonephelometry (Quest Diagnostics; CV, <8%).
Plasma Nitric Oxide
Plasma nitric oxide was measured by a spectrophotometric assay using the Griess reagent, according to Green et al20 (CV, 2.5%).
Plasma Flavonoids, Phenolic Acids, and Tocopherols
Plasma flavanols (catechin and epicatechin), flavonol (quercetin), and phenolic acids (caffeic, ferulic, vanillic, and p‐coumaric acids) were measured by high‐performance liquid chromatography analysis using an ESA CoulArray System (ESA, Inc, Chelmsford, MA) with electrochemical detection, according to Chen et al.21 Briefly, vitamin C‐EDTA, internal standard, and β‐glucuronidase sulfatase were added to plasma, and the mixture was then incubated at 37°C for 45 minutes. After the enzyme digestion, flavonoids and phenolic acids were extracted with acetonitrile, and the supernatant was dried and reconstituted in aqueous high‐performance liquid chromatography mobile phase for the analysis of flavonoids and phenolic acids. Quantification of flavonoids and phenolic acids was calculated on the basis of standard curves using authentic standards with adjustment for the internal standard (4′‐hydroxy‐3′‐methoxyacetophenone) (CV, 8.4%).
Plasma concentrations of α‐tocopherol extracted with hexane were measured using isocratic high‐performance liquid chromatography with fluorescence detection, as described by Sundram and Nor.22 Separation of analytes was achieved using silica Finepack SIL‐5 columns connected in series and a mobile phase of hexane and isopropyl alcohol (CV, 1.1%).
Ex Vivo Resistance of LDL to Oxidation
Plasma samples for the analysis of LDL oxidation were prepared by adding 166.5 μL of 6% sucrose solution to 1.5 mL of plasma and stored at −80°C <8 weeks before analysis. The ex vivo resistance of LDL to Cu2+‐mediated oxidation was measured by the formation of conjugated dienes at 37°C over 3 hours with a Shimadzu UV 1601 spectrophotometer at an absorbance of 234 nm, according to Chen et al.21 The results of the assay are expressed as lag time (minutes) (CV, 3.8%).
Urinary F2α‐Isoprostanes
8‐Isoprostaglandin F2α, a biomarker of lipid peroxidation, is related to in vivo oxidative damage. Urine samples for the isoprostane analysis were prepared by adding 18 μL of butylated hydroxytoluene to 1 mL urine and were stored at −80°C before analysis. Urinary concentrations of F2‐isoprostanes and their metabolites were measured by using a liquid chromatography–tandem mass spectrometry method, described by Liang et al.23 Values were adjusted for the creatinine concentration of urine (CV, 6.2%).
Endothelium Function
Flow‐mediated dilation
At baseline and at the end of each treatment, endothelium‐dependent flow‐mediated dilation (FMD) of the brachial artery was conducted in a darkened room. After a 12‐hour fast, participants visited the Clinical Research Center and rested in a supine position for 8 minutes. After the rest, the brachial artery in the upper arm was scanned by ultrasonographic probe in a longitudinal section. Continuous cross‐sectional images were recorded for 8 minutes at 250 mm Hg, which consisted of images during rest for 1 minute, arterial occlusion via a forearm cuff for 5 minutes, and reactive hyperemia for 2 minutes. Changes in brachial artery diameter (BAD) were measured using external B‐mode ultrasonographic imaging (Acuson Aspen 128XP equipped with a 10‐mHz linear array transducer; Acuson, Mountain View, CA). A single sonographer conducted all FMD tests throughout the study.
Quantification of arterial diameter and FMD
BADs were measured with edge detection software (Brachial Analyzer; MIA, Iowa City, IA). Images were gated at end diastole (1 image/cardiac cycle) using R‐wave detection. BAD was measured from the anterior to the posterior “m” line (interface between media and adventitia). The baseline BAD was determined by averaging diameters in all images recorded during the rest for 1 minute. The peak BAD was determined as the largest diameter recorded during cuff release for 2 minutes. FMD was expressed as percentage change from baseline and was calculated as follows: FMD%=[(peak BAD−baseline BAD)/baseline BAD]×100. Two independent individuals identified the baseline and peak BADs and calculated %FMD. If %FMD values differed by >2%, a third person scored the scan. The average of the 2 closest scores was used as a final value.
Measurement of reactive hyperemia
Using duplex pulsed Doppler, average flow velocity (m/s), maximum flow velocity, and velocity time integral were measured. Arterial blood flow was determined from Doppler flow velocity time integral, BAD, and heart rate measurements using the following equation: brachial arterial blood flow (mL/min)=π×(BAD/2)2×velocity time integral×heart rate. Reactive hyperemia was expressed as change in flow volume after cuff release and was calculated as follows: reactive hyperemia=[(peak flow volume−baseline flow volume)/baseline flow volume]×100.
Blood pressure
At baseline and at the end of each visit, blood pressure was measured by staff nurses on 2 consecutive days. Participants sat for 5 minutes with legs uncrossed and feet flat on the floor. After the 5‐minute rest, blood pressure was measured in triplicate by a standard mercury sphygmomanometer (V.A. Baum Co, Copiague, NY). The average of the second and third systolic and diastolic readings was used to assess blood pressure status.
Statistical Analysis
Statistical analyses were performed using SAS version 9.3 (SAS Institute, Cary, NC). Normality for each variable was assessed using the univariate procedure (PROC UNIVARIATE) to check skewness. Variables were log transformed if skewed and presented as geometric means (95% confidence intervals). For normally distributed variables, values are presented as mean±SEM. P<0.05 was considered significant. Only participants who completed the entire study were included in the final analyses. Therefore, a per‐protocol approach was used for the data analysis to avoid the need for multiple imputations for missing data. Separate analyses were conducted for the following: (1) between‐treatment mean values at the end of each diet period for all study outcomes; (2) within‐treatment percentage changes in lipids, lipoproteins, and apolipoproteins and Framingham 10‐year coronary heart disease risk score; and (3) within‐treatment changes from baseline in lipoprotein subclasses. The mixed‐model procedure in SAS version 9.3 was used, with treatment, visit, and sex considered as fixed effects, repeated for subjects over treatment periods, and baseline values (for absolute values and change from baseline values), age, and body mass index adjusted as covariates. For the FMD analysis, baseline BAD was included as a covariate in the model. An interaction between treatment and visit (carryover effect) was included in the model. No statistically significant carryover was seen in the study. Tukey‐adjusted P values were used for post hoc comparisons between groups. The adjusted P<0.05 and P<0.10 were considered significant and a trend, respectively. Percentage change scores were calculated by dividing change scores by baseline values, then multiplying the result by 100. Change scores were calculated by subtracting baseline values from values after each treatment. The primary outcome in the study was LDL‐C. The sample size calculation was based on information from the previous studies7, 24 and showed that 33 participants were needed, with the assumption of a significance level of 5% and 80% power.
Results
Of the 149 individuals who were screened, 48 met the study inclusion criteria and were randomized to 1 of 4 treatment sequences (Figure 1). There were 17 dropouts: 7 participants completed the baseline visit only, 8 participants dropped out after the first diet period (1 participant dropped out after AAD, 2 participants dropped out after ALD, 3 participants dropped out after CHOC, and 2 participants dropped out after CHOC+ALD), 1 participant dropped out after the second diet period (CHOC and CHOC+ALD), and 1 participant dropped out after the third diet period (AAD, CHOC, and CHOC+ALD). Therefore, the balance of sequences was lost because of dropouts (AAD, 34; ALD, 33; CHOC, 36; and CHOC+ALD, 35). A total of 31 participants completed all 4 diet periods and were included in the final analyses. The baseline characteristics of participants are presented in Table 4. Study participants were middle aged (age, 46.3±1.8 years) and overweight (body mass index, 29.6±0.5 kg/m2). They had elevated TC (210.0±6.6 mg/dL) and LDL‐C (138.3±5.7 mg/dL) but were otherwise healthy. On the basis of daily food logs, participants consumed all meals and snacks provided and did not consume any nonstudy foods on 95.2% of reported days. Participants experienced a slight weight loss (mean±SEM, −1.4±1.7 kg) after the first visit but maintained weight during the remainder of the study; therefore, there were no differences in participants’ weight between treatments (P>0.05).
Figure 1.
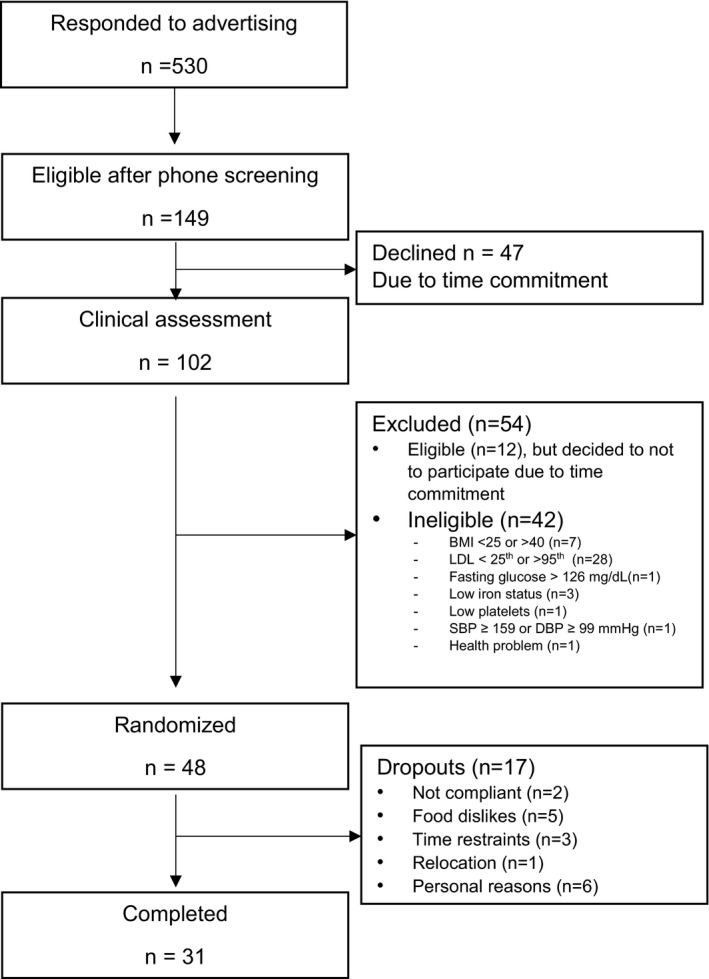
Flow of participants in the study. BMI indicates body mass index; DBP, diastolic blood pressure; LDL, low‐density lipoprotein; and SBP, systolic blood pressure.
Table 4.
Baseline Characteristics of the Participants
| Characteristics | Value |
|---|---|
| No. (female/male ratio) | 31 (13:18) |
| Age, y | 46.3±1.8 |
| BMI, kg/m2 | 29.6±0.5 |
| Waist circumference, cm | 100.1±1.4 |
| Office blood pressure, mm Hg | |
| Systolica | 119.8 (115.0–124.8) |
| Diastolic | 82.0±1.6 |
| Lipids and lipoproteins, mg/dL | |
| TC | 210.0±6.6 |
| HDL‐C | 41.9±2.0 |
| LDL‐C | 138.3±5.7 |
| Triglyceridesa | 137.1 (116.7–161.0) |
| Glucose, mg/dL | 93.9±1.5 |
| Insulin, μU/mLa | 5.8 (4.4–7.5) |
| hs‐CRP, mg/La | 1.5 (1.0–2.3) |
Values are mean±SEM, unless otherwise indicated, and were obtained using the univariate procedure (PROC UNIVARIATE) in SAS. BMI indicates body mass index; HDL‐C, high‐density lipoprotein cholesterol; hs‐CRP, high‐sensitivity C‐reactive protein; LDL‐C, low‐density lipoprotein cholesterol; and TC, total cholesterol.
Data are given as geometric mean (95% confidence interval) for nonnormally distributed variables.
End Point Differences Between Treatments
End point lipid results for the 4 diets are presented in Table 5. The ALD had lower levels of TC (195.4±3.6 compared with 204.6±3.6 mg/dL; P=0.004), non–HDL‐C (154.0±3.5 compared with 162.8±3.5 mg/dL; P=0.006), and LDL‐C (126.4±2.8 compared with 135.6±2.8 mg/dL; P=0.003) compared with the AAD. However, there were no differences between the diets for HDL‐C, IDL‐C, lipoprotein(a), VLDL‐C, and triglycerides (all P>0.05).
Table 5.
Effects of Treatments on the Fasting Markers of Metabolic Variables
| Markers | AAD | ALD | CHOC | CHOC+ALD | P Value |
|---|---|---|---|---|---|
| TC, mg/dL | 204.6±3.6ab | 195.4±3.6c | 207.6±3.6a | 199.6±3.6bc | <0.01 |
| Non–HDL‐C, mg/dL | 162.8±3.5ab | 154.0±3.5c | 165.0±3.5a | 156.5±3.5bc | <0.01 |
| HDL‐C, mg/dLa | 40.7 (39.2–42.3) | 40.2 (38.7–41.7) | 41.4 (39.9–43.0) | 41.9 (40.3–43.5) | 0.11 |
| HDL2 a | 9.6 (8.9–10.3) | 9.0 (8.4–9.7) | 9.7 (9.0–10.4) | 9.9 (9.2–10.6) | 0.11 |
| HDL3 a | 35.0 (33.6–36.5) | 34.4 (33.0–35.8) | 34.8 (33.5–36.3) | 35.2 (33.8–36.7) | 0.61 |
| LDL‐C, mg/dL | 135.6±2.8a | 126.4±2.8b | 136.1±2.8a | 128.9±2.8b | <0.01 |
| LDL1 | 20.2±0.7 | 18.6±0.7 | 20.5±0.7 | 19.9±0.7 | 0.07 |
| LDL2 | 27.4±2.0 | 23.6±2.0 | 25.9±2.0 | 27.4±2.0 | 0.10 |
| LDL1+2 | 47.5±2.3a | 42.1±2.3b | 46.2±2.3ab | 47.1±2.3ab | 0.03 |
| LDL3 | 53.1±2.0 | 49.6±2.0 | 51.5±2.0 | 48.1±2.0 | 0.07 |
| LDL4 a | 8.7 (6.5–11.7) | 10.1 (7.5–13.6) | 9.5 (7.1–12.7) | 7.5 (5.6–10.1) | 0.27 |
| LDL3+4 | 65.2±2.8a | 62.8±2.8ab | 63.7±2.8ab | 58.5±2.8b | 0.054 |
| IDL‐C, mg/dL | 16.7±0.6 | 16.0±0.6 | 16.6±0.6 | 16.0±0.6 | 0.65 |
| VLDL‐C, mg/dL* | 27.4 (24.9–30.1) | 27.6 (25.1–30.3) | 27.9 (25.4–30.6) | 26.1 (23.7–28.7) | 0.39 |
| Triglyceride‐rich remnant (IDL+VLDL3) | 32.1±1.1 | 31.5±1.1 | 32.2±1.1 | 30.9±1.1 | 0.61 |
| VLDL3 a | 15.0 (14.0–16.0) | 15.2 (14.2–16.2) | 15.0 (14.0–16.0) | 14.5 (13.5–15.5) | 0.54 |
| Lipoprotein(a), mg/dLa | 4.9 (4.1–5.8) | 5.3 (4.5–6.3) | 4.6 (3.9–5.5) | 5.1 (4.3–6.1) | 0.35 |
| Triglycerides, mg/dLa | 126.9 (114.5–140.6) | 128.4 (115.8–142.3) | 135.5 (122.3–150.1) | 127.8 (115.3–141.7) | 0.45 |
| ApoB, mg/dL | 107.5±2.4a | 102.9±2.4ab | 106.8±2.3a | 101.9±2.4b | 0.01 |
| ApoA1, mg/dL | 143.1±2.2 | 141.2±2.2 | 143.7±2.2 | 143.1±2.2 | 0.54 |
| ApoB/ApoA1 ratio | 0.8±0.0a | 0.7±0.0ab | 0.7±0.0ab | 0.7±0.0b | 0.02 |
| TC/HDL‐C ratio | 5.1±0.1a | 4.9±0.1ab | 5.1±0.1a | 4.8±0.1b | 0.01 |
| Triglycerides/HDL‐C ratioa | 3.1 (2.7–3.6) | 3.2 (2.8–3.7) | 3.3 (2.9–3.8) | 3.1 (2.7–3.5) | 0.61 |
| Insulin, mU/La | 4.9 (4.2–5.8) | 4.9 (4.2–5.8) | 4.9 (4.2–5.8) | 5.0 (4.3–5.9) | 0.98 |
| Glucose, mg/dL | 94.9±1.1ab | 92.6±1.1a | 96.2±1.1b | 95.7±1.1b | <0.01 |
| HOMA‐IRa | 1.2 (1.0–1.4) | 1.1 (1.0–1.3) | 1.2 (1.0–1.4) | 1.2 (1.0–1.4) | 0.88 |
| hs‐CRP, mg/La | 1.4 (1.0–2.0) | 1.1 (0.8–1.6) | 1.1 (0.8–1.6) | 1.3 (0.9–1.8) | 0.29 |
Data are least‐squares mean±SEM; n=31. Statistical significance was assessed by PROC MIXED in SAS, P<0.05. Different superscripts denote significant differences between groups not sharing the same superscript. AAD indicates average American diet; ALD, almond diet; ApoA1, apolipoprotein A1; ApoB, apolipoprotein B; CHOC, chocolate diet; CHOC+ALD, chocolate and almond diet; HDL‐C, high‐density lipoprotein cholesterol; HDL2, large HDL; HDL3, small HDL; HOMA‐IR, homeostasis model assessment estimated insulin resistance; hs‐CRP, high‐sensitivity C‐reactive protein; LDL, low‐density lipoprotein; LDL‐C, LDL cholesterol; LDL1+2, large buoyant LDL; LDL3+4, small dense LDL; TC, total cholesterol; VLDL‐C, very‐low‐density lipoprotein cholesterol; and VLDL3, small remnant very‐low‐density lipoprotein cholesterol.
Data are given as geometric mean (95% confidence interval) for nonnormally distributed variables.
For lipoprotein subclasses, there were no treatment effects for large HDL, small HDL, or VLDL3; however, the concentration of large buoyant LDL particles (LDL1+2) was lower after the ALD compared with the AAD (42.1±2.3 compared with 47.5±2.3 mg/dL; P=0.04). In addition, there was a lower concentration of small dense LDL particles (LDL3+4) after the CHOC+ALD compared with the AAD (58.5±2.8 compared with 65.2±2.8 mg/dL; P=0.04).
For apolipoproteins, the CHOC+ALD had a lower concentration of apolipoprotein B (ApoB) compared with the AAD (101.9±2.4 compared with 107.5±2.4 mg/dL; P=0.02); however, there was no treatment effect on apolipoprotein A1 (P>0.05). The ratios of ApoB/apolipoprotein A1 (0.7±0.0 compared with 0.8±0.0; P=0.02) and TC/HDL‐C (4.8±0.1 compared with 5.1±0.1; P=0.02) were lower after the CHOC+ALD compared with the AAD.
For other metabolic parameters, higher levels of fasting glucose were seen after the CHOC and CHOC+ALD compared with the AAD (96.2±1.1 and 95.7±1.1 compared with 94.9±1.1 mg/dL; both P<0.05); however, there were no treatment effects for insulin, homeostasis model assessment estimated insulin resistance, and high‐sensitivity C‐reactive protein (all P>0.05).
Changes From Baseline to End Point in Lipids, Lipoproteins, and Apolipoproteins
Percentage changes in lipids, lipoproteins, and apolipoproteins are shown in Figure 2. Percentage changes in TC after the AAD, ALD, CHOC and CHOC+ALD were −2.3±2.0%, −6.8±2.0%, −0.9±2.0%, and −4.8±2.0%, respectively. There was a greater percentage reduction in TC after the ALD compared with the AAD (−6.8±2.0% compared with −2.3±2.0%; P=0.004). Percentage changes in non–HDL‐C for the AAD, ALD, CHOC, and CHOC+ALD were −2.8±2.3%, −8.3±2.3%, −1.3±2.3%, and −6.7±2.3%, respectively. The percentage reduction in non–HDL‐C after the ALD was greater than after the AAD (−8.3±2.3% compared with −2.8±2.3%; P=0.009). For LDL‐C, the percentage changes for the AAD, ALD, CHOC, and CHOC+ALD were −0.6±2.6%, −7.7±2.6%, −0.0±2.6%, and −6.1±2.6%, respectively. The percentage reduction was greater after the ALD and CHOC+ALD compared with the AAD (−7.7±2.6% and −6.1±2.6% compared with −0.6±2.6%; P=0.004 and P=0.04, respectively). The percentage changes in ApoB for the AAD, ALD, CHOC, and CHOC+ALD were −2.1±2.6%, −6.6±2.6%, −2.6±2.6%, and −7.2±2.6%, respectively. There was a greater reduction in ApoB after the CHOC+ALD compared with the AAD (−7.2±2.6% compared with −2.1±2.6%; P=0.02). Consistently, the percentage reduction in the ApoB/apolipoprotein A1 ratio was greater after the CHOC+ALD compared with the AAD (−6.2±2.0% compared with −1.2±2.0%; P=0.04). There were no differences in percentage changes in HDL‐C, triglycerides, TC/HDL, triglycerides/HDL, VLDL‐C, IDL‐C, and apolipoprotein A1 between treatments (P>0.05). For additional metabolic parameters, the CHOC increased glucose, and this percentage change was higher compared with the ALD (2.6±1.3% compared with −1.2±1.3%; P=0.003); however, there were no treatment effects on percentage changes in insulin, homeostasis model assessment estimated insulin resistance, and high‐sensitivity C‐reactive protein (P>0.05).
Figure 2.
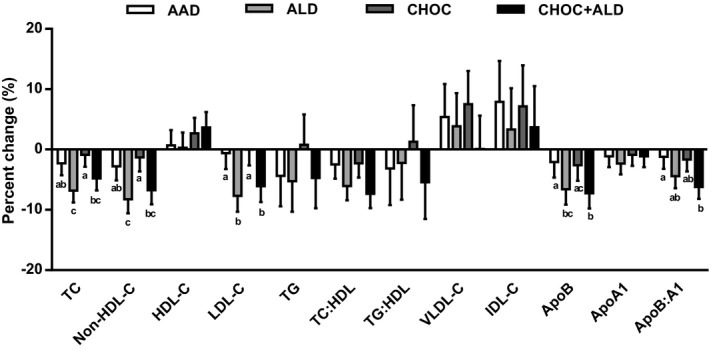
Percentage change in serum lipids, lipoproteins, and apolipoproteins in response to 4 diets. Percentage change was calculated from the baseline value of each diet period. The bars represent least‐squares means for n=31. The error bars represent SEMs. Statistical significance was assessed using the PROC MIXED procedure in SAS; mean values with different lowercase letters are significantly different, P<0.05. AAD indicates average American diet; ALD, almond diet; ApoA1, apolipoprotein A1; ApoB, apolipoprotein B; CHOC, chocolate diet; CHOC+ALD, chocolate and almond diet; HDL, high‐density lipoprotein; HDL‐C, HDL cholesterol; IDL‐C, intermediate‐density lipoprotein cholesterol; LDL‐C, low‐density lipoprotein cholesterol; TC, total cholesterol; and VLDL‐C, very‐low‐density lipoprotein cholesterol.
Changes in LDL subclasses from baseline are shown in Figure 3. The reduction in large buoyant LDL particles after the ALD diet was greater than after the AAD diet (−5.7±2.3 compared with −0.3±2.3 mg/dL; P=0.04). For the change in LDL3+4, there was a greater reduction in LDL3+4 after the CHOC+ALD diet compared with the AAD diet (−12.0±2.8 compared with −5.3±2.8 mg/dL; P=0.04). Furthermore, there were no treatment effects for changes in large HDL, small HDL, VLDL3, and triglyceride‐rich remnant (IDL‐C+VLDL3) (P>0.05) (Figures 4 and 5).
Figure 3.
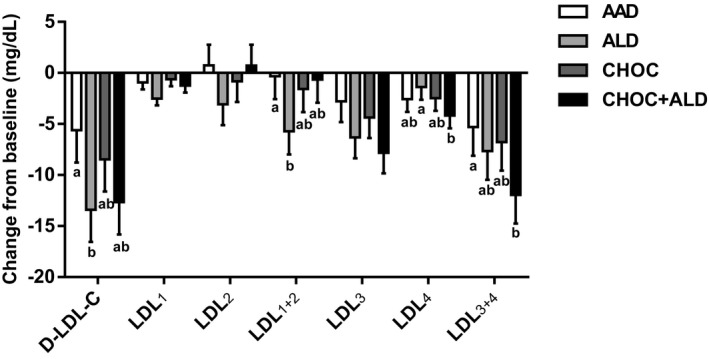
Change from baseline in low‐density lipoprotein cholesterol (LDL‐C) subclasses in response to 4 diets. The bars represent least‐squares means for n=31. The error bars represent SEMs. Statistical significance was assessed using the PROC MIXED procedure in SAS; mean values with different lowercase letters are significantly different, P<0.05. AAD indicates average American diet; ALD, almond diet; CHOC, chocolate diet; CHOC+ALD, chocolate and almond diet; D‐LDL‐C, direct measurement of low‐density lipoprotein cholesterol; LDL1+2, large buoyant LDL‐C; and LDL3+4, small dense LDL‐C.
Figure 4.
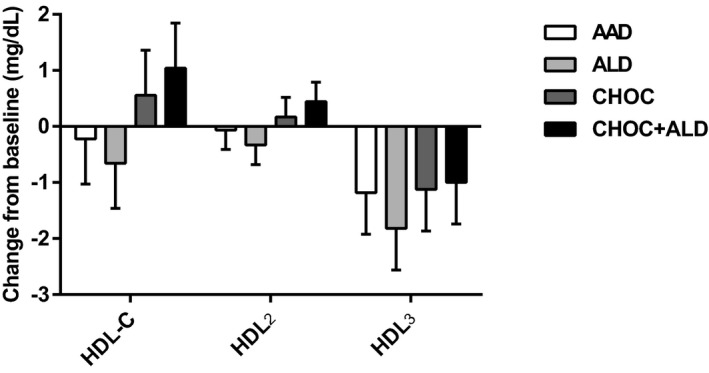
Change from baseline in high‐density lipoprotein cholesterol (HDL‐C) subclasses in response to 4 diets. The bars represent least‐squares means for n=31. The error bars represent SEMs. Statistical significance was assessed using the PROC MIXED procedure in SAS; no treatment effects occurred on HDL‐C subclasses, P>0.05. AAD indicates average American diet; ALD, almond diet; CHOC, chocolate diet; CHOC+ALD, chocolate and almond diet; HDL2, large HDL‐C particle; and HDL3, small HDL‐C particle.
Figure 5.
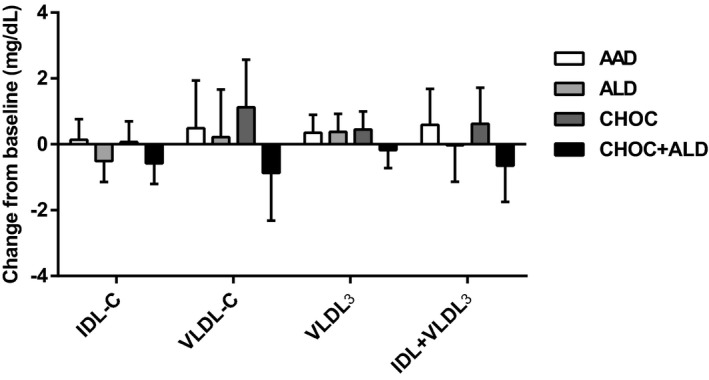
Change from baseline in intermediate‐density lipoprotein (IDL), very‐low‐density lipoprotein (VLDL), VLDL 3, and triglyceride‐rich remnant (IDL+VLDL 3) in response to 4 diets. The bars represent least‐squares means for n=31. The error bars represent SEMs. Statistical significance was assessed using the PROC MIXED procedure in SAS; no treatment effects were seen in change in IDL, VLDL, VLDL 3, and triglyceride‐rich remnant, P>0.05. AAD indicates average American diet; ALD, almond diet; CHOC, chocolate diet; CHOC+ALD, chocolate and almond diet; IDL‐C, intermediate‐density lipoprotein cholesterol; VLDL‐C, very‐low‐density lipoprotein cholesterol; VLDL3, small remnant very‐low‐density lipoprotein cholesterol.
Vascular Parameters
Systolic blood pressure significantly decreased from baseline after the AAD (−3.2±1.3%) and ALD (−5.0±1.3%) but not after the CHOC (−1.2±1.3%) and CHOC+ALD (−1.3±1.3%); there was a greater reduction in percentage change in systolic blood pressure for the ALD compared with the CHOC (P=0.03) and the CHOC+ALD (P=0.04). Similarly, diastolic blood pressure significantly decreased from baseline after the ALD (−3.1±1.5%; P=0.04); however, there were no treatment differences in percentage change in diastolic blood pressure (P>0.05). The plasma NO concentration did not differ by treatment (P>0.05). The BAD before cuff occlusion (baseline BAD) and at the peak dilation after cuff release (peak BAD) after the CHOC were larger than those after the ALD (both P<0.01). FMDs (percentage change from baseline BAD) were not different between CHOC and ALD. Furthermore, there were no treatment effects on baseline, peak flow volume, and reactive hyperemia (percentage change from baseline flow volume; Table 6).
Table 6.
Effects of Treatments on Measures of Vascular Health
| Variable | AAD | ALD | CHOC | CHOC+ALD | P Value |
|---|---|---|---|---|---|
| SBP, mm Hga | 115.5 (113.0–118.0) | 113.3 (110.9–115.8) | 117.3 (114.8–119.9) | 117.5 (115.0–120.1) | 0.06 |
| DBP, mm Hg | 79.2±1.0 | 78.4±1.0 | 79.8±1.0 | 80.1±1.0 | 0.49 |
| Plasma NO, μmol/La | 27.8 (23.7–32.5) | 34.2 (29.1–40.1) | 29.2 (24.9–34.2) | 30.9 (26.3–36.2) | 0.08 |
| Baseline BAD, mm | 4.5±0.0ab | 4.4±0.0a | 4.5±0.0b | 4.5±0.0ab | 0.01 |
| Peak BAD, mm | 4.6±0.1ab | 4.5±0.1a | 4.7±0.1b | 4.6±0.1ab | <0.01 |
| FMD, % | 5.9±0.4 | 5.6±0.4 | 5.8±0.4 | 5.8±0.4 | 0.90 |
| Baseline flow volume, mL/min | 193.6±15.5 | 175.5±15.1 | 192.2±15.1 | 197.4±15.3 | 0.58 |
| Peak flow volume, mL/min | 1008.8±46.3 | 1033.9±45.2 | 1019.9±45.2 | 1035.8±45.9 | 0.94 |
| Reactive hyperemia, % changea | 443.4 (374.4–525.2) | 510.1 (434.3–599.0) | 457.0 (388.0–538.2) | 446.5 (379.3–525.6) | 0.47 |
Data are mean±SEM; n=31. Statistical significance was assessed by PROC MIXED in SAS, P<0.05. Different superscripts denote significant differences between groups not sharing the same superscript. AAD indicates average American diet; ALD, almond diet; BAD, brachial artery diameter; CHOC, chocolate diet; CHOC+ALD, chocolate and almond diet; DBP, diastolic blood pressure; FMD, flow‐mediated dilation; and SBP, systolic blood pressure.
Data are given as geometric mean (95% confidence interval) for nonnormally distributed variables.
Oxidative Stress Parameters
Oxidative stress was evaluated by the lag time of LDL oxidation and urinary 8‐isoprostanes. There were no treatment effects on LDL oxidation and urinary 8‐isoprostanes. Furthermore, plasma total flavonoids and phenolic acids and plasma α‐tocopherol did not differ by treatment diet (P>0.05; Table 7).
Table 7.
Effects of Treatment on Markers of Oxidative Stress
| Markers | AAD | ALD | CHOC | CHOC+ALD | P Value |
|---|---|---|---|---|---|
| Oxidized LDL, lag time, min | 87.3±3.2 | 89.7±3.2 | 90.8±3.2 | 89.5±3.2 | 0.76 |
| Urinary 8‐isoprostanes, ng/mmol creatininea | 0.2 (0.1–0.3) | 0.2 (0.1–0.3) | 0.3 (0.2–0.4) | 0.2 (0.1–0.2) | 0.11 |
| α‐Tocopherol, μmol/L | 30.3±0.7 | 31.6±0.7 | 30.5±0.7 | 30.7±0.7 | 0.17 |
| Total flavonoids and phenolic acids, ng/mL | 595.7±15.2 | 608.6±15.4 | 615.5±15.2 | 613.7±15.3 | 0.59 |
Data are mean±SEM; n=31. Statistical significance was assessed by PROC MIXED in SAS, P<0.05. AAD indicates average American diet; ALD, almond diet; CHOC, chocolate diet; CHOC+ALD, chocolate and almond diet; and LDL, low‐density lipoprotein.
Data are given as geometric mean (95% confidence interval) for nonnormally distributed variables.
Discussion
The lipid‐lowering effects of almonds have been reported in previous randomized controlled trials.25, 26, 27, 28 The mechanisms by which almonds may affect lipids and lipoproteins have not been fully understood, despite some plausible hypotheses. Almonds are low in saturated fatty acids and high in unsaturated fatty acids; 91% to 94% of total lipids are comprised of oleic acid and linoleic acid.29 This fatty acid profile likely contributed to the observed LDL‐C reduction in the current study.30 Furthermore, the CHOC did not change the level of LDL‐C. This neutral effect of cocoa and dark chocolate on LDL‐C is consistently shown in the recent meta‐analysis of 19 randomized controlled trials in which chocolate or cocoa consumption did not change the LDL‐C concentration.31
Both the ALD and CHOC+ALD decreased LDL‐C by a comparable degree; however, there were different treatment effects on LDL subclasses. The ALD decreased large buoyant LDL particles, whereas the CHOC+ALD decreased small dense LDL particles. These findings may be of clinical significance because the CHOC+ALD was shown to influence both quantity and quality of LDL‐C. LDL3+4 are recognized as a risk factor for cardiovascular disease because of the following mechanisms: increased transendothelium filtration, susceptibility to oxidation, reduced affinity for the LDL receptor, and prolonged circulation, which plays an important role in the pathogenesis of atherosclerosis.32 Toth et al33 reported a significant decrease in LDL3+4 particles after daily supplementation of 150 mg of bergamot‐derived flavonoids for 6 months. In the present study, the CHOC+ALD provided an additional 273.8 mg of flavonoids, which may have contributed to the decrease in LDL3+4. Furthermore, Parlesak et al reported that consumption of monounsaturated fatty acids negatively correlated with the ratio of LDL3+4/HDL2 cholesterol.34 Almonds are high in monounsaturated fatty acids, which may be responsible for the reduction in LDL3+4.
The glycemic control parameters, including insulin, glucose, and homeostasis model assessment estimated insulin resistance, did not change after any of the treatment periods compared with the AAD; however, fasting glucose was higher after the CHOC compared with the ALD. Previous studies have shown that the consumption of dark chocolate or cocoa improved glycemic control parameters by decreasing homeostasis model assessment estimated insulin resistance35 and increasing insulin sensitivity.24 This discrepancy may reflect different study designs and test methods used. In our study, the CHOC had a higher content of sugar compared with the AAD and ALD, whereas other studies24, 36 compared the effects of consumption of dark chocolate with white chocolate that contained a similar amount of sugar and no flavanols. Furthermore, fasting glucose and insulin were measured after each treatment period in the present study, whereas the previously mentioned studies used an oral glucose tolerance test that showed a greater sensitivity than glycosylated hemoglobin and fasting glucose.37 Furthermore, participants in the current study had a normal glucose level at baseline, whereas studies with positive findings included participants with pre–diabetes mellitus27 or type 2 diabetes mellitus,7 which may account for discrepancies between studies.
Numerous randomized controlled trials have shown that the consumption of dark chocolate or cocoa has favorable effects on blood pressure24, 38 and endothelial function measured by FMD.35, 39 These reports are inconsistent with our findings that there were no treatment effects on blood pressure and measures of vascular function. This discrepancy may be because of the dose of flavanols in the study, which may not be enough to change vascular parameters. Compared with the mean dose of flavanols of 11 studies in a meta‐analysis,40 a lower dose of flavanols was used in the present study (274 compared with 586 mg).
FMD% remained unchanged during the study period; however, both baseline and peak BADs were significantly increased from baseline after the CHOC. Similar findings were observed in a study41 in which participants received a sugar‐free cocoa beverage (22 g/d) and dark chocolate (37 g/d) for 4 weeks. The mechanism for this sustained vasodilation after the CHOC has not been fully understood; therefore, further studies are needed to explore this possible mechanism.
Despite the high compliance rate, the concentrations of plasma α‐tocopherol, flavonoids, and phenolic acids did not change after any of the treatments. The results were not consistent with the results from previous studies in which the level of plasma α‐tocopherol was increased after the consumption of almonds.8, 42 The baseline plasma α‐tocopherol concentration in our population was between the 50th and 90th percentiles, according to the National Health and Nutrition Examination Survey 2005 to 2006. Given that our subjects did not have a low plasma α‐tocopherol level, potential ceiling effects may have occurred in the current study. Rein et al43 reported that plasma flavanol concentration peaked 2 hours after the consumption of chocolate and returned to baseline by 6 hours after ingestion. In the present study, blood was collected after a 12‐hour fast, which may have accounted for the unchanged flavonoid concentrations after the CHOC and CHOC+ALD. These results may explain the null findings for oxidized LDL and urinary isoprostanes, biomarkers of oxidative stress in the present study.
There were several limitations in the present study. First, the dropout rate was 35%. However, baseline characteristics between the participants who completed the study and those who withdrew were similar. Second, there is no control for multiplicity. The results other than the primary study hypothesis should be interpreted with caution because the multiplicity of other end points was not taken into account. Third, there was a lack of objective evidence to support a high participant compliance that was assessed by daily food logs. Plasma flavanol levels should be quantified within 6 hours after cocoa ingestion because of the short half‐life of flavanols. Another limitation was the inability to maintain baseline weights of the participants during the study period. The participants lost 1.4 kg after the first phase of the diet. Incorporating a run‐in period may prevent this issue in future studies. Furthermore, there was a reduction in blood pressure with the AAD. It is possible that the diet quality of AAD was better than the prestudy diet of the participants. Data collection of prestudy diets of participants would help researchers understand the metabolic changes from baseline. Finally, the impact of test foods is dependent on the selection of comparison foods. In the current study, butter, cheese, and refined grains were used as comparison foods. This may limit generalizability to populations in which these foods are not widely consumed. The strengths of this study include the comprehensive measures of cardiovascular disease risk factors, a high rate of participant adherence, and the controlled feeding and crossover study design.
In conclusion, consumption of the almonds and almonds with dark chocolate and cocoa for 4 weeks resulted in favorable effects on lipid, lipoprotein, and apolipoprotein profiles; however, there were no effects on markers of vascular health and oxidative stress. Consumption of almonds alone improved lipid and lipoprotein profiles, whereas dark chocolate and cocoa alone had no effect on the study outcomes. The combined consumption of dark chocolate, cocoa, and almonds resulted in a significant reduction in small, dense LDL, apoB, and the apoB‐to‐apoAI ratio. Our findings indicate that the consumption of almonds alone or combined with dark chocolate and cocoa may improve lipid/lipoprotein profiles, which, in turn, would be expected to decrease coronary heart disease risk.
Sources of Funding
This study was funded by The Hershey Company and the Almond Board of California. Also, this is was supported by the Penn State Clinical and Translational Research Institute, Pennsylvania State University Clinical and Translational Science Award, and NIH/National Center for Advancing Translational Sciences grant no. UL1TR000127.
Disclosures
Lee, Berryman, West, Chen, Blumberg, Fleming, and Kris‐Etherton received funding from The Hershey Company and the Almond Board of California for the research reported in this article. Preston and Lapsley are employees of The Hershey Company and The Almond Board of California, respectively. Lee and Berryman received travel funds from The Hershey Company and the Almond Board of California for giving presentations on this research. The funders had no role in data collection and analysis.
Acknowledgments
We thank our study participants for their dedication to this study. We also thank staff at The Penn State Metabolic Diet Study Center for meal preparation. We acknowledge staff nurses at The Penn State Clinical Research Center for their collaboration. Kris‐Etherton, Berryman, West, Blumberg, Lapsley, Preston, and Fleming designed research. Lee and Berryman conducted research. Chen ran assays for assured quality control for the analyses. Lee analyzed data and wrote the article. Kris‐Etherton had primary responsibility for final content. All authors read and approved the final article.
(J Am Heart Assoc. 2017;6:e005162 DOI: 10.1161/JAHA.116.005162.)29187388
References
- 1. Mozaffarian D, Benjamin EJ, Go AS, Arnett DK, Blaha MJ, Cushman M, Das SR, de Ferranti S, Despres JP, Fullerton HJ, Howard VJ, Huffman MD, Isasi CR, Jimenez MC, Judd SE, Kissela BM, Lichtman JH, Lisabeth LD, Liu S, Mackey RH, Magid DJ, McGuire DK, Mohler ER III, Moy CS, Muntner P, Mussolino ME, Nasir K, Neumar RW, Nichol G, Palaniappan L, Pandey DK, Reeves MJ, Rodriguez CJ, Rosamond W, Sorlie PD, Stein J, Towfighi A, Turan TN, Virani SS, Woo D , Yeh RW , Turner MB. Executive summary: heart disease and stroke statistics—2016 update: a report from the American Heart Association. Circulation. 2016;133:447–454. [DOI] [PubMed] [Google Scholar]
- 2. Bao Y, Han J, Hu FB, Giovannucci EL, Stampfer MJ, Willett WC, Fuchs CS. Association of nut consumption with total and cause‐specific mortality. N Engl J Med. 2013;369:2001–2011. [DOI] [PMC free article] [PubMed] [Google Scholar]
- 3. Hu FB, Stampfer MJ, Manson JE, Rimm EB, Colditz GA, Rosner BA, Speizer FE, Hennekens CH, Willett WC. Frequent nut consumption and risk of coronary heart disease in women: prospective cohort study. BMJ. 1998;317:1341–1345. [DOI] [PMC free article] [PubMed] [Google Scholar]
- 4. Estruch R, Ros E, Salas‐Salvado J, Covas MI, Corella D, Aros F, Gomez‐Gracia E, Ruiz‐Gutierrez V, Fiol M, Lapetra J, Lamuela‐Raventos RM, Serra‐Majem L, Pinto X, Basora J, Munoz MA, Sorli JV, Martinez JA, Martinez‐Gonzalez MA. Primary prevention of cardiovascular disease with a Mediterranean diet. N Engl J Med. 2013;368:1279–1290. [DOI] [PubMed] [Google Scholar]
- 5. US Department of Agriculture, Agricultural Research Service, Nutrient Data Laboratory . USDA National Nutrient Database for Standard Reference, Release 28. https://ndb.nal.usda.gov/ndb/search/list Accessed January 2, 2016.
- 6. Musa‐Veloso K, Paulionis L, Poon T, Lee HY. The effects of almond consumption on fasting blood lipid levels: a systematic review and meta‐analysis of randomised controlled trials. J Nutr Sci. 2016;5:e34. [DOI] [PMC free article] [PubMed] [Google Scholar]
- 7. Li SC, Liu YH, Liu JF, Chang WH, Chen CM, Chen CY. Almond consumption improved glycemic control and lipid profiles in patients with type 2 diabetes mellitus. Metabolism. 2011;60:474–479. [DOI] [PubMed] [Google Scholar]
- 8. Choudhury K, Clark J, Griffiths HR. An almond‐enriched diet increases plasma alpha‐tocopherol and improves vascular function but does not affect oxidative stress markers or lipid levels. Free Radic Res. 2014;48:599–606. [DOI] [PubMed] [Google Scholar]
- 9. Liu JF, Liu YH, Chen CM, Chang WH, Chen CY. The effect of almonds on inflammation and oxidative stress in Chinese patients with type 2 diabetes mellitus: a randomized crossover controlled feeding trial. Eur J Nutr. 2013;52:927–935. [DOI] [PubMed] [Google Scholar]
- 10. Jenkins DJ, Kendall CW, Marchie A, Josse AR, Nguyen TH, Faulkner DA, Lapsley KG, Blumberg J. Almonds reduce biomarkers of lipid peroxidation in older hyperlipidemic subjects. J Nutr. 2008;138:908–913. [DOI] [PubMed] [Google Scholar]
- 11. Keli SO, Hertog MG, Feskens EJ, Kromhout D. Dietary flavonoids, antioxidant vitamins, and incidence of stroke: the Zutphen study. Arch Intern Med. 1996;156:637–642. [PubMed] [Google Scholar]
- 12. Hertog MG, Kromhout D, Aravanis C, Blackburn H, Buzina R, Fidanza F, Giampaoli S, Jansen A, Menotti A, Nedeljkovic S, Pekkarinen M, Simic BS, Toshima H, Feskens EJ, Hollman PC, Katan MB. Flavonoid intake and long‐term risk of coronary heart disease and cancer in the seven countries study. Arch Intern Med. 1995;155:381–386. [PubMed] [Google Scholar]
- 13. Steinberg FM, Bearden MM, Keen CL. Cocoa and chocolate flavonoids: implications for cardiovascular health. J Am Diet Assoc. 2003;103:215–223. [DOI] [PubMed] [Google Scholar]
- 14. Ried K, Sullivan TR, Fakler P, Frank OR, Stocks NP. Effect of cocoa on blood pressure. Cochrane Database Syst Rev. 2012;4:Cd008893. [DOI] [PubMed] [Google Scholar]
- 15. Hooper L, Kay C, Abdelhamid A, Kroon PA, Cohn JS, Rimm EB, Cassidy A. Effects of chocolate, cocoa, and flavan‐3‐ols on cardiovascular health: a systematic review and meta‐analysis of randomized trials. Am J Clin Nutr. 2012;95:740–751. [DOI] [PubMed] [Google Scholar]
- 16. Harris JA, Benedict FG. A biometric study of human basal metabolism. Proc Natl Acad Sci U S A. 1918;4:370–373. [DOI] [PMC free article] [PubMed] [Google Scholar]
- 17. Friedewald WT, Levy RI, Fredrickson DS. Estimation of the concentration of low‐density lipoprotein cholesterol in plasma, without use of the preparative ultracentrifuge. Clin Chem. 1972;18:499–502. [PubMed] [Google Scholar]
- 18. Kulkarni KR. Cholesterol profile measurement by vertical auto profile method. Clin Lab Med. 2006;26:787–802. [DOI] [PubMed] [Google Scholar]
- 19. Kulkarni KRTH, Moore L, Jones S. A novel approach to measure apolipoprotein B/apolipoprotein AI ratio using the vertical auto profile method (poster). Diab Vasc Dis Res. 2007;4:266. [Google Scholar]
- 20. Green LC, Wagner DA, Glogowski J, Skipper PL, Wishnok JS, Tannenbaum SR. Analysis of nitrate, nitrite, and [15n]nitrate in biological fluids. Anal Biochem. 1982;126:131–138. [DOI] [PubMed] [Google Scholar]
- 21. Chen CY, Milbury PE, Lapsley K, Blumberg JB. Flavonoids from almond skins are bioavailable and act synergistically with vitamins C and E to enhance hamster and human LDL resistance to oxidation. J Nutr. 2005;135:1366–1373. [DOI] [PubMed] [Google Scholar]
- 22. Sundram K, Nor RM. Analysis of tocotrienols in different sample matrixes by HPLC. Methods Mol Biol. 2002;186:221–232. [DOI] [PubMed] [Google Scholar]
- 23. Liang Y, Wei P, Duke RW, Reaven PD, Harman SM, Cutler RG, Heward CB. Quantification of 8‐iso‐prostaglandin‐F(2alpha) and 2,3‐dinor‐8‐iso‐prostaglandin‐F(2alpha) in human urine using liquid chromatography‐tandem mass spectrometry. Free Radic Biol Med. 2003;34:409–418. [DOI] [PubMed] [Google Scholar]
- 24. Grassi D, Necozione S, Lippi C, Croce G, Valeri L, Pasqualetti P, Desideri G, Blumberg JB, Ferri C. Cocoa reduces blood pressure and insulin resistance and improves endothelium‐dependent vasodilation in hypertensives. Hypertension. 2005;46:398–405. [DOI] [PubMed] [Google Scholar]
- 25. Berryman CE, West SG, Fleming JA, Bordi PL, Kris‐Etherton PM. Effects of daily almond consumption on cardiometabolic risk and abdominal adiposity in healthy adults with elevated LDL‐cholesterol: a randomized controlled trial. J Am Heart Assoc. 2015;4:e000993 DOI: 10.1161/JAHA.114.000993 [DOI] [PMC free article] [PubMed] [Google Scholar]
- 26. Sabate J, Haddad E, Tanzman JS, Jambazian P, Rajaram S. Serum lipid response to the graduated enrichment of a Step I diet with almonds: a randomized feeding trial. Am J Clin Nutr. 2003;77:1379–1384. [DOI] [PubMed] [Google Scholar]
- 27. Wien M, Bleich D, Raghuwanshi M, Gould‐Forgerite S, Gomes J, Monahan‐Couch L, Oda K. Almond consumption and cardiovascular risk factors in adults with prediabetes. J Am Coll Nutr. 2010;29:189–197. [DOI] [PubMed] [Google Scholar]
- 28. Jenkins DJ, Kendall CW, Marchie A, Parker TL, Connelly PW, Qian W, Haight JS, Faulkner D, Vidgen E, Lapsley KG, Spiller GA. Dose response of almonds on coronary heart disease risk factors: blood lipids, oxidized low‐density lipoproteins, lipoprotein(a), homocysteine, and pulmonary nitric oxide: a randomized, controlled, crossover trial. Circulation. 2002;106:1327–1332. [DOI] [PubMed] [Google Scholar]
- 29. Kaldor JC, Magnusson RS, Colagiuri S. Government action on diabetes prevention: time to try something new. Med J Aust. 2015;202:578–580. [DOI] [PubMed] [Google Scholar]
- 30. Kris‐Etherton PM, Pearson TA, Wan Y, Hargrove RL, Moriarty K, Fishell V, Etherton TD. High‐monounsaturated fatty acid diets lower both plasma cholesterol and triacylglycerol concentrations. Am J Clin Nutr. 1999;70:1009–1015. [DOI] [PubMed] [Google Scholar]
- 31. Lin X, Zhang I, Li A, Manson JE, Sesso HD, Wang L, Liu S. Cocoa flavanol intake and biomarkers for cardiometabolic health: a systematic review and meta‐analysis of randomized controlled trials. J Nutr. 2016;146:2325–2333. [DOI] [PMC free article] [PubMed] [Google Scholar]
- 32. Rajman I, Eacho PI, Chowienczyk PJ, Ritter JM. LDL particle size: an important drug target? Br J Clin Pharmacol. 1999;48:125–133. [DOI] [PMC free article] [PubMed] [Google Scholar]
- 33. Toth PP, Patti AM, Nikolic D, Giglio RV, Castellino G, Biancucci T, Geraci F, David S, Montalto G, Rizvi A, Rizzo M. Bergamot reduces plasma lipids, atherogenic small dense LDL, and subclinical atherosclerosis in subjects with moderate hypercholesterolemia: a 6 months prospective study. Front Pharmacol. 2015;6:299. [DOI] [PMC free article] [PubMed] [Google Scholar]
- 34. Parlesak A, Eckoldt J, Winkler K, Bode CJ, Schafer C. Intercorrelations of lipoprotein subfractions and their covariation with lifestyle factors in healthy men. J Clin Biochem Nutr. 2014;54:174–180. [DOI] [PMC free article] [PubMed] [Google Scholar]
- 35. Davison K, Coates AM, Buckley JD, Howe PR. Effect of cocoa flavanols and exercise on cardiometabolic risk factors in overweight and obese subjects. Int J Obes (Lond). 2008;32:1289–1296. [DOI] [PubMed] [Google Scholar]
- 36. Grassi D, Desideri G, Necozione S, Lippi C, Casale R, Properzi G, Blumberg JB, Ferri C. Blood pressure is reduced and insulin sensitivity increased in glucose‐intolerant, hypertensive subjects after 15 days of consuming high‐polyphenol dark chocolate. J Nutr. 2008;138:1671–1676. [DOI] [PubMed] [Google Scholar]
- 37. Picon MJ, Murri M, Munoz A, Fernandez‐Garcia JC, Gomez‐Huelgas R, Tinahones FJ. Hemoglobin A1c versus oral glucose tolerance test in postpartum diabetes screening. Diabetes Care. 2012;35:1648–1653. [DOI] [PMC free article] [PubMed] [Google Scholar]
- 38. Taubert D, Berkels R, Roesen R, Klaus W. Chocolate and blood pressure in elderly individuals with isolated systolic hypertension. JAMA. 2003;290:1029–1030. [DOI] [PubMed] [Google Scholar]
- 39. Balzer J, Rassaf T, Heiss C, Kleinbongard P, Lauer T, Merx M, Heussen N, Gross HB, Keen CL, Schroeter H, Kelm M. Sustained benefits in vascular function through flavanol‐containing cocoa in medicated diabetic patients a double‐masked, randomized, controlled trial. J Am Coll Cardiol. 2008;51:2141–2149. [DOI] [PubMed] [Google Scholar]
- 40. Hooper L, Kroon PA, Rimm EB, Cohn JS, Harvey I, Le Cornu KA, Ryder JJ, Hall WL, Cassidy A. Flavonoids, flavonoid‐rich foods, and cardiovascular risk: a meta‐analysis of randomized controlled trials. Am J Clin Nutr. 2008;88:38–50. [DOI] [PubMed] [Google Scholar]
- 41. West SG, McIntyre MD, Piotrowski MJ, Poupin N, Miller DL, Preston AG, Wagner P, Groves LF, Skulas‐Ray AC. Effects of dark chocolate and cocoa consumption on endothelial function and arterial stiffness in overweight adults. Br J Nutr. 2014;111:653–661. [DOI] [PubMed] [Google Scholar]
- 42. Chen CY, Holbrook M, Duess MA, Dohadwala MM, Hamburg NM, Asztalos BF, Milbury PE, Blumberg JB, Vita JA. Effect of almond consumption on vascular function in patients with coronary artery disease: a randomized, controlled, cross‐over trial. Nutr J. 2015;14:61. [DOI] [PMC free article] [PubMed] [Google Scholar]
- 43. Rein D, Lotito S, Holt RR, Keen CL, Schmitz HH, Fraga CG. Epicatechin in human plasma: in vivo determination and effect of chocolate consumption on plasma oxidation status. J Nutr. 2000;130:2109s–2114s. [DOI] [PubMed] [Google Scholar]