

Abstract
Background
Clinical decision making in abdominal aortic aneurysms (AAA) relies completely on diameter. At this point, improved decision tools remain an unmet medical need. Our goal was to identify changes at the molecular level specifically leading up to AAA rupture.
Methods and Results
Aortic wall tissue specimens were collected during open elective (eAAA; n=31) or emergency repair of ruptured AAA (rAAA; n=17), and gene expression was investigated using microarrays. Identified candidate genes were validated with quantitative real‐time polymerase chain reaction in an independent sample set (eAAA: n=46; rAAA: n=18). Two gene sets were identified, 1 set containing 5 genes linked to terminal progression, that is, positively associated with progression of larger AAA, and with rupture (HILPDA,ANGPTL4,LOX,SRPX2,FCGBP), and a second set containing 5 genes exclusively upregulated in rAAA (ADAMTS9,STC1,GFPT2,GAL3ST4,CCL4L1). Genes in both sets essentially associated with processes related to impaired tissue remodeling, such as angiogenesis and adipogenesis. In gene expression experiments we were able to show that upregulated gene expression for identified candidate genes is unique for AAA. Functionally, the selected upregulated factors converge at processes coordinated by the canonical HIF‐1α signaling pathway and are highly expressed in fibroblasts but not inflammatory cells of the aneurysmatic wall. Histological quantification of angiogenesis and exploration of the HIF‐1α network in rAAA versus eAAA shows enhanced microvessel density but also clear activation of the HIF‐1α network in rAAA.
Conclusions
Our study shows a specific molecular fingerprint for terminal AAA disease. These changes appear to converge at activation of HIF‐1α signaling in mesenchymal cells. Aspects of this cascade might represent targets for rupture risk assessment.
Keywords: abdominal aortic aneurysm, angiogenesis, endothelial cell differentiation, gene microarray, hypoxia‐inducible factor 1
Subject Categories: Angiogenesis, Vascular Biology, Gene Expression & Regulation, Aneurysm
Clinical Perspective
What Is New?
We identified a gene set that appears specific for terminal aneurysm wall weakening and ultimate rupture. Identified genes converge at an accentuated HIF‐1α signaling.
What Are the Clinical Implications?
These findings may help to direct future research to establish better risk prediction tools and possibly provide novel targets for medical therapy aimed at stabilizing growing abdominal aortic aneurysms.
Introduction
Rupture of abdominal aortic aneurysms (AAAs) represents a common cause of mortality in developed countries, predominantly in white men over 65 years of age with a history of smoking and/or hypertension.1 The definitive therapy for AAAs is surgery or stent placement, which is performed when the risk of rupture outweighs the risk of intervention. Current clinical risk assessment fully relies on diameter. According to prevailing guidelines, AAA repair should be performed when AAAs expand to ≥55 mm.2 Although the majority of ruptures occur at sizes far beyond 55 mm, rupture does occur at AAAs smaller than 55 mm. Therefore, more individualized risk prediction is urgently needed in order to prevent premature ruptures and unnecessary invasive repair, especially because treatment is associated with reasonable perioperative morbidity and high costs. Today the exact mechanisms underlying AAA progression and ultimate rupture are unknown. Although AAA growth and rupture can be the consequence of continuous and progressive wall destabilization, functional evidence from imaging studies and molecular studies implies AAA rupture is a process that is (partially) distinct from AAA growth.3 Serial monitoring of the biological activity of AAA would be valuable both in identifying high‐risk patients and in prompting earlier therapy to prevent rupture while sparing patients at low risk from morbid procedures. Results from positron emission tomography (PET) scans performed with 18F‐fluorodeoxyglucose show that functional AAA wall imaging is feasible.4 Yet, the nature of the relevant changes, and consequently their applicability as a risk prediction tool, has recently been scrutinized because conclusions from PET studies vary widely.5 Because the reliability of conventional tracers for monitoring the biological activity of AAA is under controversial debate, there is a need for new more specific molecular targets and tracers for AAA rupture risk prediction. Therefore, it is essential to identify the molecular changes preceding or associated with AAA rupture.
Our study aimed at identifying genes and pathways related to AAA rupture. Using microarray analyses, we undertook an unbiased bioinformatics approach to elaborate pathways potentially associated with AAA rupture. Candidate genes were validated in an independent cohort by quantitative polymerase chain reaction (PCR), and their correlation to diameter was tested. Results of this analysis showed a strong association for selective upregulation of genes involved with the processes of angiogenesis and adipogenesis during end‐stage AAA disease. Histological validation confirmed the functional activation of these processes in fibroblasts but not in inflammatory cells. Upstream, most upregulated pathways converged at activation of HIF‐1α signaling. The data herein provide a reference framework for the development of diagnostic and possibly medical strategies specifically targeted at preventing AAA rupture.
Methods
Study Cohorts
AAA specimens were obtained from a total of 84 patients undergoing open AAA repair. Full‐thickness AAA biopsies were obtained from the anterior aneurysm sac and snap frozen in liquid nitrogen. Specimens were collected and stored at −80°C until assayed. Utilization of human vascular tissues was approved by the ethics committee of the Medical Faculty Dresden University (EK 316122008), and the protocol conformed to ethical guidelines of the Declaration of Helsinki. For patients with AAA, risk factors were recorded on enrollment. Dyslipidemia, hypertension, and diabetes mellitus were defined by a history of diagnosis or treatment of hyperlipidemia, hypertension, or diabetes mellitus. Coronary artery disease was defined by a history of myocardial infarction, angina, or treatment. Smoking was defined by history as past or current (ever) smoker, and never smoker. Maximum infrarenal aortic diameter was assessed in patients with AAA from axial computed tomography angiography images or duplex sonography. Maximum AAA diameter was recorded in millimeters.
Human primary cells (endothelial cells, smooth muscle cells, adipocytes isolated from adipose tissue, and adventitial fibroblasts) from nondiabetic, nonsmoking patients were obtained, and experimental procedures were performed within the framework of the nonprofit Human Tissue and Cell Research Foundation.6 Written informed consent was obtained from all subjects.
RNA, Reverse Transcription, and Quantitative PCRs
Total RNA was extracted from 48 AAA biopsies using the TRIzol reagent (Sigma, St. Louis, MO) and was purified using the RNeasy Mini Kit (Qiagen, Hilden, Germany) according to the manufacturer's instructions before transcriptome analyses. RNA from 28 AAA biopsies used for array analysis (elective AAA [eAAA]: n=20, and ruptured AAA [rAAA]: n=8) were also included for validation experiments with accordingly extracted RNA from additional stable (n=26) and ruptured AAA samples (n=10). RNA from blood cells (peripheral blood mononuclear cells, CD14‐, CD19‐, CD‐3, CD4‐, CD8‐positive cells, and regulatory T‐cells was obtained by Clontech [Mountain View, CA; pool of 2 to 3 donors]) as well as from human primary cells was isolated using TRIzol reagent. Reverse transcription and quantitative real‐time PCR were performed as previously described.7 Primers and probes for investigated genes (HILPDA, ANGPTL4, SLC39A14, LOX, ADAMTS9, SRPX2, STC1, GFPT2, FCGBP, GAL3ST4, CCL4L1, and RAB7B) are given in Table 1. Absolute copies were determined using plasmid standard curves and were normalized to micrograms of RNA. All quantitative PCR experiments were performed in quadruplicate.
Table 1.
Primers and Probes Used for Validation of Differential Gene Expression Levels With Quantitative Real‐Time Polymerase Chain Reaction
| Gene | Primer/Probe | Sequence | Length (bp) |
|---|---|---|---|
| ADAMTS9 | 5′‐primer | 5′‐CCAAGCCAACATCTATGCAG‐3′ | 102 |
| 3′‐primer | 5′‐GCTGGTATCCCTGTCCACAA‐3′ | ||
| Probe | 5′F‐TTGTCAGCAGCCGGAATGTGCATCCTGGC‐3′T | ||
| ANGPTL4 | 5′‐primer | 5′‐GTGGACCCTGAGGTCCTTC‐3′ | 82 |
| 3′‐primer | 5′‐CCACCTTGTGGAAGAGTTGC‐3′ | ||
| Probe | 5′F‐AGACACAACTCAAGGCTCAGAACAGCAGGAT‐3′T | ||
| HILPDA | 5′‐primer | 5′‐CTACAGCCGGCGATCCA‐3′ | 114 |
| 3′‐primer | 5′‐AGAAACAGAGCTGCCTTCTCCTT‐3′ | ||
| Probe | 5′F‐CGGCTGTTCCCCCGGAGGG‐3′T | ||
| GFPT2 | 5′‐primer | 5′‐GGCTGTTCTCCGAGGATATG‐3′ | 123 |
| 3′‐primer | 5′‐TGGGACAGGTCTGGAATCA‐3′ | ||
| Probe | 5′F‐CCAAGTCTGTAACTGTGGAATGAGGCTGAGA‐3′T | ||
| LOX | 5′‐primer | 5′‐CGGATACGGCACTGGCTACTT‐3′ | 73 |
| 3′‐primer | 5′‐GGACGCCTGGATGTAGTAGGG‐3′ | ||
| Probe | 5′F‐ACGGTCTCCCAGACCTGGTGGCC‐3′T | ||
| SLC39A14 | 5′‐primer | 5′‐ACGCAGAACGCAGACAGTT‐3′ | 96 |
| 3′‐primer | 5′‐CATAAGCCAAGCAGGGTCAG‐3′ | ||
| Probe | 5′F‐ACCATGAAGCTGCTGCTGCTGCACC‐3′T | ||
| SRPX2 | 5′‐primer | 5′‐GGCATGTGACCATCATTGAA‐3′ | 118 |
| 3′‐primer | 5′‐CGAGTGAGGCGCTGAAAT‐3′ | ||
| Probe | 5′F‐AGCAACAGCTGTCAGCCAACATCATCGA‐3′T | ||
| STC1 | 5′‐primer | 5′‐GTGGCGGCTCAAAACTCA‐3′ | 121 |
| 3′‐primer | 5′‐AGATGTCATACATCCCATCTGTGT‐3′ | ||
| Probe | 5′F‐TGCTCTACAGGTCGGCTGCGGG‐3′T | ||
| CCL4L1 | 5′‐primer | 5′‐CTTCCTCGCAACTTTGTGGT‐3′ | 96 |
| 3′‐primer | 5′‐GCAGACTTGCTTGCCTCTTT‐3′ | ||
| Probe | 5′F‐TCTGCTCCCAGCCAGCTGTGGTATTC‐3′T | ||
| FCGBP | 5′‐primer | 5′‐CAACCACAGCCTGACACTGA‐3′ | 97 |
| 3′‐primer | 5′‐GTGCAGGAGCGAGTCCAG‐3′ | ||
| Probe | 5′F‐AAGCTACAGGTCGACGGCGTGTTCGT‐3′T | ||
| GAL3ST4 | 5′‐primer | 5′‐TCTTGGGGAAAGTTGAGCTG‐3′ | 120 |
| 3′‐primer | 5′‐GCAGATTTTTGCCTCTGTCA‐3′ | ||
| Probe | 5′F‐CGATTTCCCTTGCTGCTCCCCTTGT‐3′T | ||
| RAB7B | 5′‐primer | 5′‐TCCAAGGCTGGAATCTTTTTC‐3′ | 96 |
| 3′‐primer | 5′‐CCATTGAAGACCCTGAGAGG‐3′ | ||
| Probe | 5′F‐AGGCAGCACAGACAGGGCCTAGCCT‐3′T | ||
| ACTB | 5′‐primer | 5′‐ CCTGGCACCCAGCACAAT ‐3′ | 70 |
| 3′‐primer | 5′‐ GCCGATCCACACGGAGTACTT ‐3′ | ||
| Probe | 5′F‐ATCAAGATCATTGCTCCTCCTGAGCGCA ‐3′T |
Probes were labeled: 5′FAMRA (5′F‐) and 3′TAMRA (‐3′T). bp indicates base pairs.
Microarray Analysis
Transcriptome‐wide expression analysis was performed using the Illumina (San Diego, CA) HumanHT‐12 v4 Expression BeadChip platform as previously described.8 Background correction and quantile normalization were performed by the limma package9 used in R version 3.2. Differential expression was calculated using empirical Bayes statistics and corrected for multiples testing as implemented in the limma package. The intersection of differentially expressed genes (|log2 fold change‐[FC]| ≥1.5, adjusted P<0.05) in both analysis of eAAA versus rAAA samples and intermediate‐ (iAAA) versus large‐AAA (lAAA) samples were identified. Upstream regulators were analyzed using the Ingenuity Pathway Analysis (http://www.ingenuity.com) considering transcripts with an absolute log2FC ≥1 as differentially expressed. Gene expression data have been deposited at Gene Expression Omnibus under the GEO Accession number GSE98278.
Histology and Immunohistochemistry
Tissue samples were obtained from the maximally dilated region (aneurysm sac) of 9 patients with different AAA diameters (≤55 mm, n=3; >70 mm; n=3; rAAA, n=3) and divided in 2 parts. One half was immediately snap‐frozen in liquid nitrogen and stored at −80°C for later analysis. The other half was fixed in 4% formalin for 12 hours and decalcified. Afterward the latter segments were paraffin embedded, and 4‐μm sections were processed into slices.
Paraffin sections of full‐thickness human AAA tissue were stained with hematoxylin and eosin.
For immunostaining, aortic sections were rehydrated in PBS, permeabilized for 15 minutes in 0.5% Triton X100 PBS, and blocked for 30 minutes in PBS containing 1% BSA, 2% donkey serum, and 0.3% Triton X100 PBS (blocking buffer) at room temperature. Sections were probed with primary antibodies diluted in blocking buffer 1:100 at 4°C overnight. The following primary antibodies were used: ANGPTL4 (PA5‐26216, ThermoFischer Scientific, Waltham, MA), HILPDA (ABIN2175788, antikoerper‐online), SRPX2 (ab91584, Abcam, Cambridge, UK), LOX (ab31238, Abcam), FCGBP (ab121202, Abcam). After incubation, sections were washed 3 times with PBS and incubated with appropriate conjugated secondary antibodies and then diluted in blocking buffer 1:500 at room temperature for 2 hours. Nuclei were stained with Hoechst 33342 (Sigma Aldrich, St. Louis, MO) and SMA using the ImmPress HRP Anti‐Rabbit and Anti‐Mouse Ig Polymere Detection System (Vector Laboratories, Burlingame, CA) during secondary antibody incubation. Afterward, sections were washed 3 times with PBS, mounted with Fluorescence Mounting Medium (Dako, Santa Clara, CA) and kept at 4°C for imaging. Antibodies against HIF‐1α (ab8366, Abcam), vimentin (M7020, Dako), and CD31 (JC70A, Dako) were diluted 1:1000 in 5% BSA. The 4plus Biotinylated Universal Goat link kit (Biocare Medical, Pacheco, CA) in combination with 4plus streptavidin AP label was used as secondary antibody for Ferangi Blue and Vulcan Red visualizations in combination with Mayer hematoxylin (Merck Millipore, Billerica, MA).
Stained slides were scanned at ×400 magnification with a Philips IntelliSite Fast Scanner (Philips, Eindhoven, The Netherlands), and representative sections are shown in figures 5, 6, and 8.
Histological/Morphometric Analysis
Microvessel density of the medial‐adventitial border zone was quantified by light microscopy. Wall sections were Ulex‐stained and then scanned. Vessel lumen areas were marked, and the relative vessel area per full wall section was estimated with ImageJ.
Statistical Analysis
Demographic patient data are presented as mean±standard deviation or as absolute and relative frequency. Comparison of categorical demographic data between patient cohorts was performed using the Fisher exact test. A Mann‐Whitney U test was performed to identify differences in continuous variables and expression levels of selected genes between eAAA and rAAA in the validation cohort. The Spearman rank correlation coefficient was determined to detect associations for gene expression levels and related phenotypes. Multiple comparisons of gene expression levels in different tissues were performed using the Kruskal‐Wallis test with adjustment for multiple comparison. A P<0.05 was considered statistically significant. Differences in gene expression levels between samples are given as log2FC. Statistical analyses were performed using R software (R Foundation for Statistical Computing, Vienna, Austria) and GraphPad Prism version 6.0 (GraphPad Software, La Jolla, CA).
Results
Identification of Transcripts Associated With AAA Progression and Rupture
To identify genes and pathways associated with AAA progression and rupture, we harvested tissue from the aneurysm sacs of 48 patients undergoing open elective and emergency AAA repair. Patient characteristics are summarized in Table 2. We performed 2 analyses in the same set of patients to identify genes that (1) associate with rupture and (2) associate with both progression and rupture of AAA (Figure 1). First, we compared the gene expression profiles of patients undergoing elective repair (n=31) with those undergoing emergency repair due to AAA rupture (n=17). Groups were similar with respect to age, sex, hypertension, dyslipidemia, coronary artery disease, diabetes mellitus, and history of smoking (Table 2). The groups differed significantly regarding maximum aortic diameter (62.3±12.1 mm versus 77.0±14.7 mm; P<0.001) and male sex (97% versus 77%; P<0.05). Exploration of differential gene expression (|log2FC| ≥1.5‐fold, adjusted P<0.05) between the eAAA and rAAA groups identified 68 differentially expressed transcripts (Tables 3 and 4). Because size is the strongest known factor to predispose for both AAA progression and rupture, we aimed at identifying genes that are associated with a strong propensity for rupture. Hence, in a second analysis we compared patients with iAAA (≤55 mm, n=15, small rupture risk) and those with lAAA (>70 mm, n=16, ruptured and eAAA with high rupture risk—risk defined on basis of the diameter) in the same cohort. The mean diameters in these groups were 54.1±1.8 mm versus 84.1±12.6 mm (P<0.0001). Groups were similar with regard to common cardiovascular risk factors. In this analysis we identified 32 transcripts that were differentially expressed between iAAA and lAAA (|log2Fc| ≥1.5‐fold, adjusted P<0.05; Tables 5 and 6). We observed a considerable overlap between the differentially expressed gene sets in the eAAA versus rAAA analysis and the second iAAA versus lAAA analysis. A total of 14 transcripts were differentially expressed (|log2Fc| ≥1.5‐fold, adjusted P<0.05) in both analyses (Figure 1). We considered these transcripts the most promising candidates for risk assessment. The 14 transcripts represent 12 individual genes (Fc fragment binding protein [FCGBP] shows 2 significant transcripts, and no corresponding gene was found for the downregulated transcript LOC728835). Transcripts that were upregulated (ie, higher in rAAA than in lAAA) correspond to the following genes (Table 7): a disintegrin and metalloproteinase with thrombospondin type 1 motif 9 (ADAMTS9), angiopoietin‐like 4 (ANGPTL4), hypoxia‐inducible lipid droplet associated protein (HILPDA or C7orf68), lysyl‐oxidase (LOX), solute carrier family 39 family A 14 (SLC39A14 or ZIP14), sushi repeat protein X‐linked 2 (SRPX2), stanniocalcin‐1 (STC1), and glutamine‐fructose‐6‐phosphate transaminase 2 (GFPT2). Downregulated genes (lower in rAAA than in lAAA) were C‐C chemokine ligand 4‐like 1 (CCL4L1), Fc fragment binding protein (FCGBP), Gal‐3‐sulfontransferase 4 (GAL3ST4), and ras‐related protein Rab‐7b (RAB7B).
Table 2.
Patient Characteristics
| Characteristic | Identification Cohort (Array) | Validation Cohort (qPCR) | |||||||
|---|---|---|---|---|---|---|---|---|---|
| eAAA | rAAA | P Value | iAAA | lAAA | P Value | eAAA | rAAA | P Value | |
| N | 31 | 17 | 15 | 16 | 46 | 18 | |||
| Age, y | 69.5±7.2 | 73.5±11.3 | ns | 67.7±7.4 | 72.3±9.2 | ns | 68.9±7.1 | 73.4±11.9 | 0.0296 |
| Male sex | 97% | 77% | 0.0467 | 93% | 88% | ns | 96% | 78% | 0.0477 |
| BMI | 27.2±3.3 | 26.1±4.6 | ns | 28.3±3.3 | 26.4±3.8 | ns | 27.9±4.2 | 26.2±4.4 | ns |
| Diameter, mm | 62.3±12.1 | 77.0±14.7 | 0.0002 | 54.1±1.8 | 84.1±12.6 | <0.0001 | 62.7±13.3 | 79.8±16.0 | <0.0001 |
| CAD | 58.1% | 41.2% | ns | 46.7% | 43.8% | ns | 52.2% | 44.4% | ns |
| Hypertension | 93.5% | 88.2% | ns | 86.7% | 93.8% | ns | 93.5% | 94.4% | ns |
| Diabetes mellitus | 32.3% | 23.5% | ns | 26.7% | 31.3% | ns | 37.0% | 22.2% | ns |
| Dyslipidemia | 77.4% | 82.3% | ns | 86.7% | 81.3% | ns | 76.1% | 82.4% | ns |
| (Ever) smoking | 58.1% | 58.8% | ns | 33.3% | 68.8% | ns | 66.7% | 70.6% | ns |
For patients with AAA, risk factors were recorded. Dyslipidemia, hypertension, and diabetes mellitus were defined by a history of diagnosis or treatment of hyperlipidemia, hypertension, or diabetes mellitus. Coronary artery disease (CAD) was defined by a history of myocardial infarction, angina, or treatment. Smoking was defined by history as past or current (ever) smoker, and never smoker. Maximum infrarenal aortic diameter was assessed in patients with AAA from axial computed tomography angiography images or duplex sonography. Maximum AAA diameter was recorded in millimeters. Nominal variables are presented as percentages; continuous variables are presented as mean±standard deviation. Continuous variables were compared using the Mann‐Whitney U test; nominal variables were compared using the Fisher exact test. Associations of expression levels and variables listed were tested using the Spearman rank correlation. The P‐value was corrected for multiple testing using the Bonferroni correction. No significant correlations (P<0.05) were identified for age, sex, BMI, CAD, hypertension, diabetes mellitus, dyslipidemia, and smoking. Thus, gene expression levels were not adjusted for these phenotypes. Correlation of gene expression level and diameter of aneurysms was expected due to the experimental design. AAA indicates abdominal aortic aneurysm; BMI, body mass index; eAAA, stable—treated electively—abdominal aortic aneurysm; iAAA, intermediate size (≤55 mm) abdominal aortic aneurysm; lAAA, large size (>70 mm) abdominal aortic aneurysm); ns, not significant; qPCR, quantitative polymerase chain reaction; rAAA, ruptured abdominal aortic aneurysm.
Figure 1.

Study design. A, Two array analyses were performed in the identification cohort: ruptured (rAAA) vs stable and intermediate (≤55 mm) vs large (>70 mm) size AAA. The Venn diagram above depicts the overlap among the different groups in the identification cohort. The Venn diagrams underneath show the overlap among the identified differentially expressed transcripts of the 2 analyses. An independent validation cohort was used to validate the overlapping candidate genes from the array analyses with quantitative real‐time PCR. B, Volcano plot of differentially expressed transcripts for eAAA vs rAAA array analysis. C, Volcano plot of differentially expressed transcripts for intermediate vs large AAA array analysis (colored dots, |log2 FC| ≥1.5, adjusted P<0.05). AAA indicates abdominal aortic aneurysm; eAAA, elective AAA; iAAA, intermediate AAA; lAAA, large AAA; qRT‐PCR, quantitative real‐time polymerase chain reaction; rAAA, ruptured AAA.
Table 3.
Differentially Expressed Upregulated Transcripts (log2FC >1.5 and Adjusted P<0.05) by Comparison of Samples Taken From the Aneurysmatic Wall During Open Repair From Patients With Stable/Elective Surgery Versus From Patients With Ruptured/Emergency Repair
| Illumina Number | Symbol | log2FC | Adjusted P Value |
|---|---|---|---|
| ILMN_1659990 | HILPDA | 2.6149 | 0.0000 |
| ILMN_2386444 | ANGPTL4 | 2.3552 | 0.0000 |
| ILMN_1775170 | MT1X | 2.3523 | 0.0000 |
| ILMN_1780349 | TPR | 2.1645 | 0.0070 |
| ILMN_1805543 | ADAMTS9 | 2.1005 | 0.0001 |
| ILMN_1685714 | INHBB | 2.0515 | 0.0000 |
| ILMN_1764629 | SLC39A14 | 2.0280 | 0.0000 |
| ILMN_1695880 | LOX | 2.0091 | 0.0002 |
| ILMN_1685608 | NPTX2 | 1.9739 | 0.0001 |
| ILMN_1707727 | ANGPTL4 | 1.9397 | 0.0000 |
| ILMN_1720623 | SYTL3 | 1.8774 | 0.0000 |
| ILMN_1676213 | SRPX2 | 1.8692 | 0.0001 |
| ILMN_1661895 | PI15 | 1.7970 | 0.0004 |
| ILMN_1715401 | MT1G | 1.7884 | 0.0001 |
| ILMN_1661695 | IRAK3 | 1.7567 | 0.0000 |
| ILMN_2375879 | VEGFA | 1.7518 | 0.0003 |
| ILMN_3221432 | PRG4 | 1.7495 | 0.0036 |
| ILMN_2136089 | MTE | 1.7278 | 0.0000 |
| ILMN_1674376 | ANGPTL4 | 1.6973 | 0.0001 |
| ILMN_2074477 | GPR4 | 1.6824 | 0.0000 |
| ILMN_2189027 | LIPG | 1.6812 | 0.0000 |
| ILMN_1758164 | STC1 | 1.6694 | 0.0019 |
| ILMN_1752932 | MPZL2 | 1.6678 | 0.0000 |
| ILMN_1782938 | SLC16A10 | 1.6468 | 0.0086 |
| ILMN_2305407 | ZBTB16 | 1.6300 | 0.0032 |
| ILMN_2127298 | F2RL3 | 1.6259 | 0.0000 |
| ILMN_1738725 | LIF | 1.6241 | 0.0031 |
| ILMN_1772131 | IL1R2 | 1.6025 | 0.0005 |
| ILMN_1691884 | STC2 | 1.5867 | 0.0000 |
| ILMN_1696048 | C13orf33 | 1.5651 | 0.0027 |
| ILMN_1657435 | MT1M | 1.5415 | 0.0024 |
| ILMN_1709674 | GFPT2 | 1.5399 | 0.0076 |
| ILMN_2071446 | PI15 | 1.5324 | 0.0006 |
| ILMN_1657234 | CCL20 | 1.5317 | 0.0028 |
| ILMN_2331231 | TNFRSF6B | 1.5251 | 0.0002 |
| ILMN_1803824 | ZDHHC9 | 1.5093 | 0.0000 |
Table 4.
Differentially Expressed Downregulated Transcripts (log2FC <−1.5 and Adjusted P<0.05) by Comparison of Samples Taken From the Aneurysmatic Wall During Open Repair From Patients With Stable/Elective Surgery Versus From Patients With Ruptured/Emergency Repair
| Illumina Number | Symbol | log2FC | Adjusted P Value |
|---|---|---|---|
| ILMN_1801307 | TNFSF10 | −1.5078 | 0.0005 |
| ILMN_1808590 | GUCY1A3 | −1.5107 | 0.0053 |
| ILMN_1761833 | SLC40A1 | −1.5231 | 0.0019 |
| ILMN_1771688 | RAB7B | −1.5508 | 0.0002 |
| ILMN_2175317 | CYP4X1 | −1.5595 | 0.0016 |
| ILMN_2347798 | IFI6 | −1.5607 | 0.0003 |
| ILMN_1743199 | EGR2 | −1.5952 | 0.0007 |
| ILMN_1799467 | SAMD9L | −1.6022 | 0.0000 |
| ILMN_3235832 | LOC728835 | −1.6131 | 0.0023 |
| ILMN_2218856 | CCL3L1 | −1.6166 | 0.0029 |
| ILMN_1693452 | GAL3ST4 | −1.6258 | 0.0001 |
| ILMN_1716276 | CCL4L2 | −1.6633 | 0.0012 |
| ILMN_1655821 | CAPG | −1.6853 | 0.0051 |
| ILMN_1739393 | SELE | −1.7106 | 0.0045 |
| ILMN_1796316 | MMP9 | −1.7138 | 0.0061 |
| ILMN_1718984 | FCGBP | −1.7323 | 0.0040 |
| ILMN_2100209 | CCL4L1 | −1.7473 | 0.0015 |
| ILMN_3243185 | RERGL | −1.7496 | 0.0050 |
| ILMN_2374449 | SPP1 | −1.7563 | 0.0075 |
| ILMN_2053103 | SLC40A1 | −1.7820 | 0.0004 |
| ILMN_2105573 | CCL3L3 | −1.8140 | 0.0002 |
| ILMN_1739428 | IFIT2 | −1.8652 | 0.0001 |
| ILMN_1815205 | LYZ | −1.8863 | 0.0031 |
| ILMN_2165753 | HLA‐A29.1 | −1.8869 | 0.0344 |
| ILMN_2073758 | MMP12 | −1.9865 | 0.0185 |
| ILMN_1671509 | CCL3 | −2.0419 | 0.0002 |
| ILMN_1723912 | IFI44L | −2.0946 | 0.0000 |
| ILMN_2302757 | FCGBP | −2.0977 | 0.0042 |
| ILMN_1775501 | IL1B | −2.1044 | 0.0001 |
| ILMN_1747355 | CCL3L1 | −2.1117 | 0.0002 |
| ILMN_1707695 | IFIT1 | −2.1544 | 0.0000 |
| ILMN_1772964 | CCL8 | −2.1997 | 0.0000 |
Table 5.
Differentially Expressed Upregulated Transcripts (log2FC >1.5 and Adjusted P<0.05) by Comparison of Samples Taken From the Aneurysmatic Wall During Open Repair From Patients With Intermediate Sized AAA Versus From Patients With Large AAA
| Illumina Number | Symbol | log2FC | Adjusted P Value |
|---|---|---|---|
| ILMN_1659990 | HILPDA | 2.1272 | 0.0034 |
| ILMN_2386444 | ANGPTL4 | 1.9538 | 0.0057 |
| ILMN_2206722 | FER1L4 | 1.9440 | 0.0054 |
| ILMN_1695880 | LOX | 1.9348 | 0.0078 |
| ILMN_2139970 | ALDH1A3 | 1.8483 | 0.0079 |
| ILMN_1754716 | HAS1 | 1.7569 | 0.0076 |
| ILMN_2193233 | MGC29506 | 1.7282 | 0.0438 |
| ILMN_1805543 | ADAMTS9 | 1.6960 | 0.0114 |
| ILMN_1709674 | GFPT2 | 1.6569 | 0.0183 |
| ILMN_1797009 | F3 | 1.5984 | 0.0003 |
| ILMN_1758164 | STC1 | 1.5849 | 0.0093 |
| ILMN_1676213 | SRPX2 | 1.5808 | 0.0083 |
| ILMN_1776967 | LRRC50 | 1.5796 | 0.0081 |
| ILMN_1720373 | SLC7A5 | 1.5527 | 0.0250 |
| ILMN_1807439 | ALDH1A3 | 1.5430 | 0.0477 |
| ILMN_1764629 | SLC39A14 | 1.5400 | 0.0018 |
| ILMN_1787345 | FKBP11 | 1.5327 | 0.0004 |
| ILMN_2129572 | F3 | 1.5145 | 0.0087 |
Intermediate size is ≤55 mm; large is >70 mm. AAA indicates abdominal aortic aneurysm.
Table 6.
Differentially Expressed Downregulated Transcripts (log2FC <−1.5 and Adjusted P<0.05) by Comparison of Samples Taken From the Aneurysmatic Wall During Open Repair From Patients With Intermediate Sized AAA Versus From Patients With Large AAA
| Illumina Number | Symbol | log2FC | Adjusted P Value |
|---|---|---|---|
| ILMN_1771688 | RAB7B | −1.5108 | 0.0067 |
| ILMN_1774874 | IL1RN | −1.5184 | 0.0320 |
| ILMN_1693452 | GAL3ST4 | −1.5337 | 0.0039 |
| ILMN_1744968 | KCNAB1 | −1.5365 | 0.0402 |
| ILMN_3235832 | LOC728835 | −1.5392 | 0.0372 |
| ILMN_2088437 | CX3CR1 | −1.5744 | 0.0019 |
| ILMN_2100209 | CCL4L1 | −1.5949 | 0.0305 |
| ILMN_1688423 | FCER1A | −1.7426 | 0.0000 |
| ILMN_1789007 | APOC1 | −1.7483 | 0.0261 |
| ILMN_1746888 | PCOLCE2 | −1.7866 | 0.0005 |
| ILMN_1712475 | HS3ST2 | −1.8449 | 0.0157 |
| ILMN_1718984 | FCGBP | −2.3486 | 0.0009 |
| ILMN_2302757 | FCGBP | −2.4189 | 0.0054 |
| ILMN_1715169 | HLA‐DRB1 | −2.8815 | 0.0317 |
Intermediate size is ≤55 mm; large is >70 mm. AAA indicates abdominal aortic aneurysm.
Table 7.
Identified Candidate Genes and Their Change in Expression Levels
| Gene | Study Cohort (Array) | Validation Cohort (qPCR Replication) | ||||||
|---|---|---|---|---|---|---|---|---|
| eAAA vs rAAA | iAAA vs lAAA | eAAA vs rAAA | Correlation Diameter | |||||
| (n=31) | (n=17) | (n=16) | (n=15) | (n=46) | (n=18) | (n=64) | ||
| log2FC | P Value | log2FC | P Value | log2FC | P Value | Spearman r | P Value | |
| HILPDA | 2.615 | <0.0001 | 2.128 | 0.0034 | 2.025 | <0.0001 | 0.3753 | 0.0019 |
| ANGPTL4 | 2.355 | <0.0001 | 1.954 | 0.0057 | 1.765 | <0.0001 | 0.3176 | 0.0094 |
| ADAMTS9 | 2.100 | <0.0001 | 1.696 | 0.0114 | 1.143 | 0.0006 | 0.1799 | ns |
| SLC39A14 | 2.028 | <0.0001 | 1.54 | 0.0018 | 0.901 | ns | 0.1319 | ns |
| LOX | 2.009 | 0.0002 | 1.935 | 0.0078 | 1.035 | 0.0001 | 0.3336 | 0.0062 |
| SRPX2 | 1.869 | <0.0001 | 1.581 | 0.0083 | 1.306 | 0.0029 | 0.3903 | 0.0012 |
| STC1 | 1.669 | 0.0019 | 1.585 | 0.0093 | 0.640 | 0.0393 | 0.07098 | ns |
| GFPT2 | 1.540 | 0.008 | 1.657 | 0.0183 | 1.085 | 0.0227 | 0.2243 | ns |
| RAB7B | −1.551 | 0.0002 | −1.511 | 0.0067 | −0.439 | ns | −0.0548 | ns |
| GAL3ST | −1.626 | <0.0001 | −1.534 | 0.0039 | −2.403 | 0.0170 | −0.181 | ns |
| FCGBP | −1.732 | 0.0040 | −2.349 | 0.0009 | −0.642 | 0.0033 | −0.2672 | 0.0301 |
| CCL4L1 | −1.747 | 0.0015 | −1.595 | 0.0305 | −0.799 | 0.0490 | −0.1 | ns |
Overlapping genes differentially expressed in the identification cohort (array) with |log2FC| ≥1.5 and adjusted P<0.05. Assessed changes in gene expression levels normalized to β‐actin detected by qPCR and correlation of gene expression levels with AAA diameter in the validation cohort. ns indicates not significant.
AAA indicates abdominal aortic aneurysm; eAAA, stable, elective AAA; iAAA, intermediate sized AAA; lAAA, large AAA; qPCR, quantitative polymerase chain reaction; rAAA, ruptured AAA.
Validation of Candidate Genes and Correlation With AAA Size
We next aimed to replicate our findings in a second, independent cohort consisting of 64 patients undergoing elective (eAAA, n=46) and emergency (rAAA, n=18) open AAA repair. The eAAA and rAAA patients in this cohort were different with regard to age (68.9±7.1 years versus 73.4±11.9 years, P<0.05), sex (96% versus 78% male sex; P<0.05), and AAA diameter (62.7±13.3 mm [eAAA] versus 79.8±16.0 mm [rAAA], P<0.0001). Groups were similar with respect to body mass index, coronary artery disease, hypertension, diabetes mellitus, dyslipidemia, and history of smoking (Table 2). We performed qualitative real‐time PCR analyses for the 12 genes, and absolute copies were normalized to expression of the housekeeping gene β‐actin (Table 7). We confirmed differential expression for 10 genes, but SLC39A14 and RAB7B were not validated, possibly due to technical means (low copy numbers).
Correlation between gene expression levels and diameter was observed for 5 genes (Table 7 & Figure 2), indicating that these genes were associated with terminal AAA progression and AAA rupture (terminal progression‐associated genes). The other 5 candidates (ADAMTS9, STC1, GFPT2, GAL3ST4, CCL4L1) did not show an association with diameter and were therefore considered to be exclusively related to rupture (rupture only–associated genes; Figure 3). From a diagnostic and therapeutic point of view, the changes preceding AAA rupture are obviously of the highest interest. Therefore, we focused on these 5 terminal progression–associated genes (ANGPTL4, HILPDA, LOX, SRPX2, and FCGBP) for subsequent analyses.
Figure 2.

Gene expression levels of 5 genes are associated with AAA rupture and diameter. Normalized gene expression levels (validation cohort) of differentially expressed genes in rAAA, which also showed significant correlation to AAA diameter (terminal progression–associated genes). Gene expression levels were normalized to β‐actin. Data are demonstrated as mean±SEM, and Mann‐Whitney U test was performed to identify differences in expression levels of selected genes between eAAA and rAAA. Spearman rank correlation coefficient (r) was determined to detect associations for gene expression levels and AAA diameter. AAA indicates abdominal aortic aneurysm; eAAA, elective AAA; rAAA, ruptured AAA.
Figure 3.

Results of the validation for candidate genes without correlation to AAA diameter. A, ADAMTS9, GFPT2, and STC1 were validated for higher expression levels in rAAA. B, Decreased gene expression for rAAA was also demonstrated for CCL4L1 and GAL3ST4 in the validation cohort, but their gene expression levels showed no significant correlation with diameter (rupture only–associated genes). Differential gene expression levels for SLC39A14 and RAB7B could not be reproduced. Gene expression levels were normalized to β‐actin. Data are illustrated as mean±SEM, and Mann‐Whitney U test was performed to identify differences in expression levels of selected genes between eAAA and rAAA. Spearman rank correlation coefficient (r) was determined to detect associations for gene expression levels and AAA diameter. AAA indicates abdominal aortic aneurysm; eAAA, elective AAA; rAAA, ruptured AAA.
To further investigate if the selected 5 genes constituted specific markers for abdominal aneurysms but not for aneurysms at other sites of the vasculature or for atherosclerotic vascular disease, we quantified their expression in RNA isolated from degenerative and dissected thoracic, infrarenal aortic, and popliteal aneurysms (Figure 4A) as well as from atherosclerotic plaques. For ANGPTL4, HILPDA, LOX, and SRPX2, which are upregulated during AAA progression and rupture, highest expression was found in AAA but not in degenerative and dissected thoracic or popliteal aneurysms. Low expression was found in atherosclerotic plaques of the carotid and common femoral arteries, indicating that the gene expression signature was specific for AAA but not for other dilative or atherosclerotic lesions. For FCGBP, we observed lower expression in AAA compared to atherosclerotic plaques, which is consistent with the observed downregulation in the gene expression data.
Figure 4.
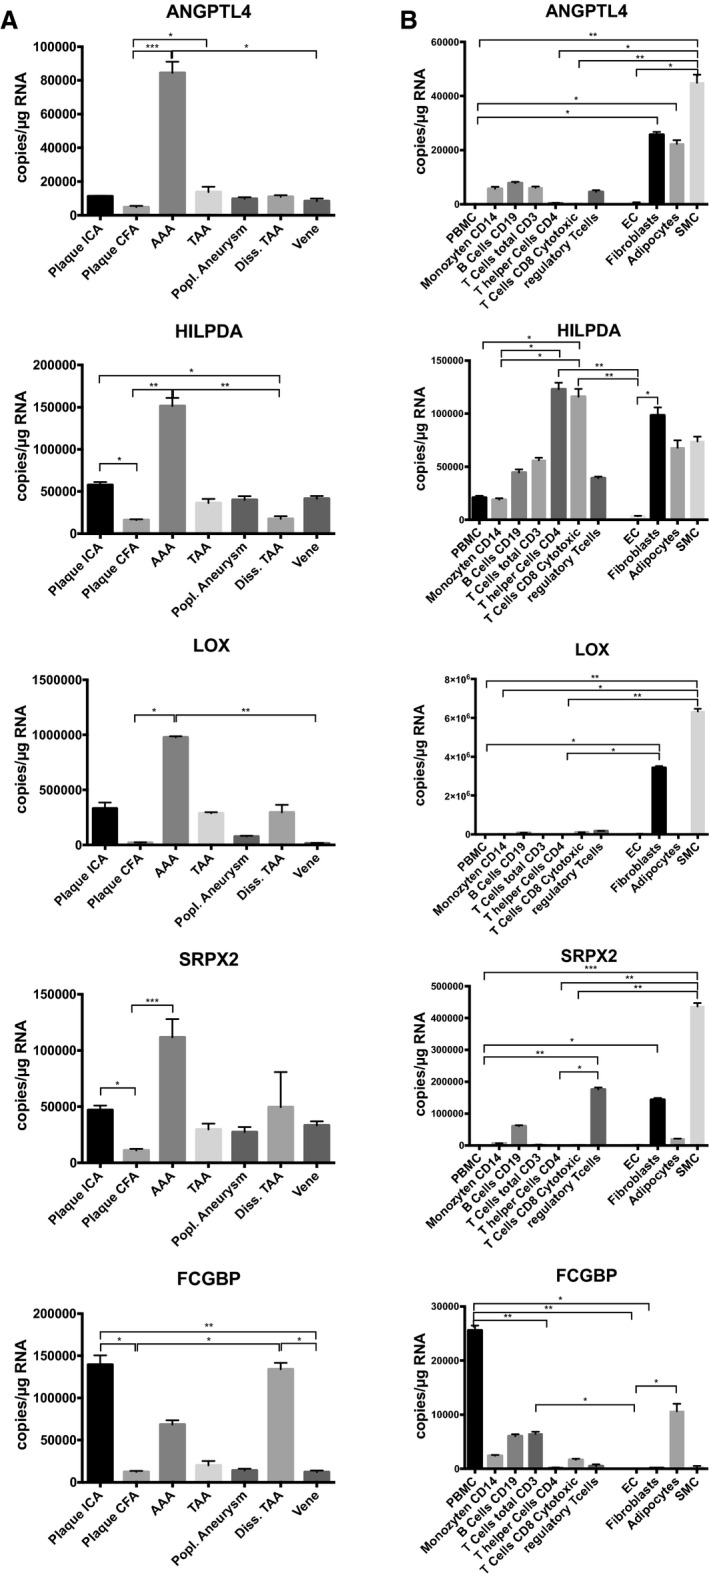
Gene expression signature is unique for AAA disease and originates from mesenchymal cells. A, Identified upregulated candidate genes exclusively associated with AAA, and gene expression is distinct from other dilative vascular disorders (eg, popliteal aneurysm, aortic dissection) as well as atherosclerotic changes. Downregulated genes were expressed at low levels in AAA and showed higher expression levels in other vascular pathologies. B, For almost all upregulated genes (except HILPDA) higher expression levels were detected in mesenchymal cell types (fibroblasts, adipocytes, and smooth muscle cells) than in inflammatory cells. Downregulated candidate genes showed highest expression levels in peripheral blood mononuclear cells (PBMC). Quadruplicate measurements per condition. Data are given as mean±SEM. Kruskal‐Wallis test was performed for multiple comparison analyses. Adjusted P<0.05 was considered significant (*P<0.05; **P<0.01; ***P<0.001). AAA indicates abdominal aortic aneurysm; CFA, common femoral artery; diss. TAA, dissected thoracic aortic aneurysm; EC, endothelial cells; ICA, internal carotid artery; popl., popliteal; SMC, smooth muscle cells; TAA, thoracic aortic aneurysm.
Terminal Progression–Associated Genes Are Highly Expressed in Mesenchymal Cells Within AAA Walls
To dissect which cells within AAA were the main sources of gene expression, we performed a profiling of blood cells (peripheral blood mononuclear cells, CD14‐positive monocytes, B‐cells [CD19], CD3‐, CD4‐, CD8‐positive T‐cells, and regulatory T‐cells) that eventually might invade the vascular periphery and AAA wall and of vascular cells, such as endothelial cells, adventitial fibroblasts, adipocytes, and smooth muscle cells. ANGPTL4, HILPDA, LOX, and SRPX2 revealed high expression in fibroblasts and smooth muscle cells, and only HILPDA was more highly expressed in blood cells (Figure 4B). This cell profiling suggests that upregulated candidate genes are mainly expressed by cells of mesenchymal origin and not inflammatory cells invading from the blood. These findings indicate that terminal AAA weakening is more likely to be characterized by fibrotic changes in tissue composition than inflammatory alterations.
Immunohistochemical analysis of these 5 candidate genes confirmed the presence of the proteins they encode in the aneurysm wall (Figure 5). ANGPTL4, HILPDA, SRPX2, and LOX staining was localized in pericytes of microvessels in the medial‐adventitial border zone. Staining for SRPX2 was diffuse in the media and colocalized to adipocytes in the adventitia. Also, ANGPTL4 staining was observed in adipocytes of the adventitia. For ANGPTL4, SRPX2, and LOX, diffuse staining was witnessed in tertiary lymphoid follicles of the medial layer of tissue cross sections from rAAAs. Sparse FCGBP staining was localized near microvessels in the media of eAAAs and was absent in rAAAs.
Figure 5.

Results of the immunohistochemistry. Staining for protein products of our candidate genes confirmed presence in the aneurysmatic wall. ANGPTL4, HILPDA, SRPX2, and LOX are localized in pericytes of microvessels in the medial‐adventitial border zone. Staining for SRPX2 is diffuse in the media and also observed in adipocytes of the adventitia. Demonstrated are representative sections from a 55‐mm stable abdominal aortic aneurysm.
Molecular Effector Pathways of AAA‐Marker Genes
Literature research revealed that the 5 AAA candidate genes were associated with following processes: angiogenesis (ANGPTL4,10 LOX,11 SRPX2 12), adipogenesis (ANGPTL4,13 HILPDA,14 LOX 15), and epithelial‐mesenchymal transition (FCGBP,16 LOX,17 SRPX2 18). An increase in medial neovascularization and fatty degeneration has already been reported for specimens from end‐stage AAA disease.3, 19 We therefore performed histological quantification of microvascular density in rAAA versus eAAA in a subset (n=5 in each group) of our study cohort. This analysis revealed significantly enhanced microvessel density (P<0.05; Figure 6) likely caused by increased neovascularization. To dissect the underlying molecular mechanism, we next performed an upstream regulator analysis of differentially expressed genes from the eAAA versus rAAA (n=308) and iAAA versus lAAA analyses (n=246) using the Ingenuity Pathway Analysis software (Qiagen, Hilden, Germany). This predicted HIF‐1α signaling to be 1 of the most significantly upregulated networks with an activation z‐score of 4.329 and an overlap P value of 2.74×10⁻²² (Table 8). Exploration of the HIF‐1α network with Ingenuity Pathway Analysis shows clear activation of the HIF‐1α network in rAAA (Figure 7). These observations suggest progressive activation of the HIF‐1α signaling pathway in advanced AAA disease. Immunohistochemical evaluation of HIF‐1α in AAA showed localized, prominent staining in large nucleated cells in the infiltrates surrounding the vasa vasora in the medial‐adventitial border zone and in the adventitial adipocytes. Dual positivity of these cells for HIF‐1α and CD31 as well as vimentin and CD31, suggests that, in infiltrates, HIF‐1α activation associates with cells undergoing endothelial‐to‐mesenchymal transition (EndoMT; Figure 8) and that end‐stage AAA disease involves EndoMT.
Figure 6.

Increased neovascularization in rAAA. A, Results of the determination of microvessel density between (B) stable (eAAA) and (C) ruptured AAA (rAAA) samples (n=5/group); *P<0.05. Arrows indicate microvessels in the media‐adventitia border zone of aneurysmatic walls. Data are demonstrated as mean±SEM, and Mann‐Whitney U test was performed to identify differences of the percentage of vasa vasorum. AAA indicates abdominal aortic aneurysm; eAAA, elective AAA; rAAA, ruptured AAA.
Table 8.
Results of the Ingenuity Upstream Regulator Analysis of Both Array Data Sets
| Upstream Regulators | z‐Score eAAA vs rAAA | z‐Score iAAA vs lAAA |
|---|---|---|
| NUPR1 | 4.278 | 5.815 |
| HIF‐1α | 4.329 | 3.775 |
| TRIM24 | 4.422 | 3.043 |
| VEGF | 3.267 | 4.162 |
| HGF | 3.235 | 3.645 |
| 5‐N‐Ethylcarboxamido adenosine | 2.836 | 3.449 |
| Prostaglandin E2 | 3.093 | 2.765 |
| SOCS1 | 2.881 | 2.711 |
| SCARB1 | 2.630 | 2.770 |
| ACKR2 | 3.051 | 2.333 |
| Mibolerone | 2.435 | 2.795 |
| TGFB1 | 2.352 | 2.862 |
| PTGER4 | 2.856 | 2.152 |
| Deferoxamine | 2.266 | 2.687 |
| Aspirin | 2.642 | 2.303 |
| HDAC4 | 2.563 | 2.360 |
| DNase2 | 2.606 | 2.213 |
| Dexamethasone | 2.235 | 2.555 |
| CTLA4 | 2.414 | 2.191 |
| ERN1 | 2.558 | 2.025 |
| TGFB2 | 2.159 | 2.402 |
| STAR | 2.236 | 2.236 |
| Prednisolone | 2.362 | 2.012 |
| Triamcinolone acetonide | 2.333 | 2.026 |
| 5‐Azacytidine | 2.076 | 2.237 |
| Sodium arsenite | 2.089 | 2.173 |
| FOSB | 2.201 | 2.005 |
| Phosphate | 2.156 | 2.045 |
| Nelfinavir | 2.000 | 2.177 |
| HDL | 2.138 | 2.005 |
Demonstrated are all activated regulators with activation z‐score >2 in both analysis for the identification cohort. Transcripts correlated with rAAA and lAAA (|log2FC| ≥1.0 and adjusted P<0.05; n=308 and n=246, respectively; Ingenuity Pathway Analysis) were included in the analysis. AAA indicates abdominal aortic aneurysm; ACKR2, atypical chemokine receptor 2; CTLA4, cytotoxic T‐lymphocyte associated protein 4; DNase2, deoxyribonuclease 2; ERN1, endoplasmic reticulum to nucleus signaling 1; HDAC4, histone deacetylase 4; HDL, high density lipoprotein; HGF, hepatocyte growth factor; HIF‐1a, hypoxia inducible factor 1 alpha; lAAA, large AAA; NUPR1, nuclear protein 1; PTGER4, prostaglandin E receptor 4; rAAA, ruptured AAA; SCARB1, scavenger receptor class B member 1; SOCS1, suppressor of cytokine signaling 1; STAR, steroidogenic acute regulatory protein; TGFB1, transforming growth factor beta 1; TGFB2, transforming growth factor beta 2; TRIM24, tripartite motif containing 24; VEGF, vascular endothelial growth factor.
Figure 7.

HIF‐1α strongly associates with differentially expressed genes in rAAA. Results from the Ingenuity pathway analysis (stable vs ruptured AAAs) for the activated upstream regulator HIF‐1α (activation z‐score 4.329 and an overlap P value of 2.74×10⁻²²) showing the significantly up‐ (red) and downregulated (green) genes and their localization in the cell. Figure ©2000‐2016 by Qiagen (Hilden, Germany). Reproduced with permission.
Figure 8.

HIF‐1α expression is detected in cells undergoing EndoMT. Results of HIF‐1α and CD31 staining (CD31 [blue], HIF‐1α [red] double staining): (A) overview (scale bar=500 μm). HIF‐1α staining is particularly prominent in the well‐vascularized areas (B) but minimally expressed in the avascular areas (C). D, Perivascular CD‐31/HIF‐1α double‐positive mononuclear cells (arrows) suggest HIF‐1α expression in cells undergoing EndoMT. This finding is supported by a CD31 (blue) and vimentin (red) double staining: (E) overview (scale bar=500 μm). F, Perivascular (vasa vasorum) CD31/vimentin double‐positive mononuclear cells (arrows) are found in the media‐adventitia border (scale bar=50 μm). G, Again, minimal expression is observed in the avascular areas of the intima‐media zone (scale bar=50 μm). EndoMT indicates endothelial‐to‐mesenchymal transition.
All in all the above data show a terminal progression–associated gene signature that appears unique to terminal AAA dilatation and rupture. Both at the regulation of their expression and functionally (hypoxia/angiogenesis), the selected upregulated factors converge at the level of the canonical HIF‐1α signaling pathway.
Discussion
Even though multiple etiological, genetic, and environmental factors contributing to AAA have been identified in the past decade, the mechanisms leading to terminal aorta weakening and ultimate rupture are still incompletely understood. Gene expression array analyses provide a comprehensive, global view of disease‐related genes, as well as of activated or inactivated pathways.
There have been a few earlier investigations with different study designs using gene expression array analyses from AAA patients,20, 21, 22, 23, 24, 25 but this is the first study using whole genome microarrays to compare relative mRNA expression patterns between stable and ruptured AAAs in order to identify processes associated with AAA progression and rupture. With our approach we were able to identified and validate 2 gene sets. The first gene set relates to AAA growth and rupture (terminal progression–associated genes). A second set of 5 candidate genes (STC1, ADAMTS9, GFPT2, GAL3ST4, and CCL4L1) showed no significant correlation of gene expression level and AAA diameter and thus seems to be exclusively associated with rupture (rupture only–associated genes).
It is well known that AAA disease has a very strong chronic inflammatory component. We earlier reported about changes in the lymphocyte subpopulation in small versus large AAAs.22 How far these changes contribute to or associate with AAA rupture is uncertain. Except for CCL4L1, none of the identified top candidate genes has been reported to be a typical inflammatory response gene.26 Functionally both the terminal progression and rupture‐associated candidate genes clustered with adipogenesis and angiogenesis, processes that appear prominently involved in AAA disease.3, 27
With respect to adipogenesis, we observed an adipogenic signature in the terminal progression–associated AAA candidate set (HILPDA,14 ANGPTL4, 13 and LOX 15), and in the rupture only–associated candidate set (ADAMTS9 28). This observation coincides with the findings from a histological reevaluation of AAA disease that attempted to identify culprit mechanisms beyond inflammation and proteases.19 Results from this evaluation identified fatty degeneration as a so far overlooked process in AAA disease.
More specifically, 3 of the 5 terminal progression– and 2 of the rupture only–associated candidate genes relate to the process of angiogenesis. ANGPTL4, a matricellular protein, has been shown to promote angiogenesis through integrin binding and STAT3 signaling.10, 29 The chondroitin sulfate proteoglycan SRPX2 binds to urokinase plasminogen activator receptor in a ligand‐receptor interaction and is involved in the early phase of endothelial remodeling during angiogenesis.12 It has been demonstrated that SRPX2 regulates endothelial cell migration and tube formation in vascular endothelial cells.30 LOX, a copper‐containing monoamine oxidase, has been shown to be critically involved in tumor angiogenesis by promoting cell migration and tube formation.11 STC1 has been shown to promote angiogenic sprouting in human umbilical vein endothelial cells via vascular endothelial growth factor/vascular endothelial growth factor receptor 2 and angiopoietin signaling pathways.31 ADAMTS9 acts as an antiangiogenic metalloprotease and is expressed by microvascular endothelial cells.32 The increased neovascularization that we observed in the medial layer of large and ruptured AAA samples suggested that the observed proangiogenic signature is functional. Yet, whether increased angiogenesis promotes rupture (transversing microvessels may weaken the wall strength) or whether the signature is secondary to physical (hypoxia) and/or molecular changes (inflammation) forestalling rupture is unclear and cannot be addressed in this observational study.
Both processes and almost all candidate genes converge at the master regulator HIF‐1α, which was identified through Ingenuity upstream regulator analysis, suggesting that HIF‐1α may drive the molecular (and functional) fingerprint of terminal aneurysm weakening. HIF‐1α is centrally involved in the cellular responses to oxygen tension. Under normal circumstances, the HIF‐1α gene is constitutively expressed in low levels and in normoxic circumstances is rapidly cleared through ubiquination. Hypoxia stabilizes HIF‐1α, thus inhibiting protein degradation and resulting in HIF‐1α accumulation. Alternative (normoxic) HIF‐1α accumulation and signaling have been described to merely reflect upregulation of HIF‐1α gene expression.33
In the aneurysm wall, conditions such as mural thrombus, aortic wall thickening, and massive inflammation may create a hypoxic milieu. Yet, AAA is also characterized by excess angiogenesis and an increased vessel density theoretically compensating for the impaired oxygen delivery and demand, and consequently, increased HIF‐1α signaling presumably reflects nonclassical activation through oxygen‐independent regulators of HIF‐1α activity. In nonhypoxic conditions, growth factors, cytokines, and other signaling molecules are able to accumulate HIF‐1α protein in cells.33 One possible mechanism perpetuating HIF‐1α in AAA is a positive feedback loop between HIF‐1α activation and the candidate gene LOX. Classically LOX catalyzes cross‐linking of collagens and elastin in the extracellular matrix, thereby regulating tissue tensile strength. Yet, LOX has also been shown to activate the PI3K‐Akt signaling pathway, thereby upregulating HIF‐1α protein synthesis. In fact, there is compelling evidence that LOX and HIF‐1α act in synergy and that HIF‐1α and LOX are mutually involved in the cellular adaptation to stress.34
In our study histological analysis of the aneurysm wall showed abundant HIF‐1α expression in multiple cell types of the aneurysm wall. A remarkable observation was the abundant expression of HIF‐1α in clusters of cells in the tertiary follicles of the aneurysm wall. Double staining experiments indicated that these HIF‐1α–positive clusters of cells stain positive for CD31. Although CD31 is a classical endothelial cell marker, it also identifies cells undergoing EndoMT.35 EndoMT is a process in which epithelial and endothelial cells lose polarity, detach from their neighboring cells, and gain migratory and invasive properties in order to become mesenchymal stem cells.36, 37 EndoMT has been implicated as major driver of tissue fibrosis,38, 39 and for the vascular system EndoMT is believed to be the primary contributor to cardiac fibrosis after myocardial infarction.40 Thus, it can not be excluded that a parallel mechanism is involved in AAA disease.
Notably, there is compelling evidence that HIF‐1α drives the epithelial‐mesenchymal transition (EMT).41 Again, 3 of the 5 terminal progression– and 2 of the rupture only–associated candidate genes relate to EMT. It has recently been shown that FCGBP expression is decreased in gallbladder carcinoma and is an independent marker for disease progression and prognosis.16 The pathophysiological role of LOX during EMT has been studied in aggressive thyroid, colon, and breast tumors.17 SRPX2 has also been linked to EMT. In glioblastoma SRPX2 facilitates metastasis by enhancing the EMT process via the MAPK signaling pathway.18 Reportedly the candidate genes STC‐1 and CCL4 may also mediate EMT, yet mechanistic insight is missing.42, 43
Together, using a very conservative approach to identify genes with rigorous correction for multiple testing, we identified 2 sets of genes that all fall within a theoretical framework of (impaired) tissue remodeling including angiogenesis, adipogenesis, HIF‐1 activation, and possibly EndoMT. Remarkably, candidate genes do not explicitly associate with presumed culprit processes such as inflammation and proteases, which may, rather, be important in the initiation phase of AAA disease. On the contrary, our data suggest that in the terminal phase of the disease preceding the rupture of AAA expressed genes associate with impaired healing responses. It came to our attention that this may explain failure of medical strategies.44
Overall, the identified genes and processes may provide opportunities for improved risk stratification, and our results could be helpful in the search for novel and more effective PET tracers to improve AAA rupture risk stratification. Recently, Shi et al showed increased angiogenesis in calcium phosphate–induced AAAs in mice by PET scanning with 64Cu‐labeled anti‐CD105 antibody Fab fragment.45 With regard to our results, this seems a very promising approach to determine rupture risk in AAA patients in the future.
Because we present results from an observational study, conclusions are based on a bioinformatics approach and histological validation. An in vivo model mimicking end‐stage AAA disease is urgently missing, and as a result we are currently unable to test whether the identified candidates are modulators or merely bystanders of AAA disease and rupture.
Conclusions
In conclusion, this study examined the global gene expression profile of different sized AAAs as well as stable and ruptured AAAs. We were able to identify gene expression profiles unique for end‐stage AAA disease and identified candidate genes related to processes involved in fibrosis. AAA progression toward rupture is associated with increased angiogenesis in the media and adventitia of the aortic wall. Several genes related to angiogenesis, adipogenesis, and EMT are overexpressed in large and ruptured AAAs. Some of these genes are directly related to HIF‐1α, which seems to be pivotal for AAA progression toward rupture. The exact mechanisms behind HIF‐1α–driven AAA weakening still remain to be further explored, but we recognized an increase in EndoMT and positive HIF‐1α and vimentin staining in CD31+ myofibroblasts. Novel PET tracers for imaging processes characteristic of end‐stage AAA disease, such as angiogenesis, are promising tools for a better AAA rupture risk stratification and should be further investigated. Considering our findings and recent results from AAA models in mice,46, 47 we believe that pharmacological HIF‐1α inhibition seems a promising medical therapy for patients with stable AAAs.
Author Contributions
Gäbel, Lindeman, and Holdt conceived and designed the experimental approach, performed experiments, and prepared the article. Gäbel, Bergert, Holdt, and Lindeman provided resources. Gäbel, Weinzierl, Ludwig, Hinterseher, and Bergert collected patient samples and data. Gäbel, Wilfert, Northoff, Lindeman, and Holdt performed experiments. Northoff and Holdt contributed to the computational analysis for the gene signature and the statistical analysis. Gäbel, Doderer, and Lindeman analyzed histological data. Teupser and Schönleben provided valuable input on the article. All authors critically reviewed and approved the article.
Sources of Funding
This work was supported by research grants (to Gäbel and Bergert) from VASCUTEK Germany GmbH and W. L. Gore & Associates GmbH, Germany.
Disclosures
The authors declare that they have no competing interests or interests that might be perceived to influence the results and discussion reported in this article.
Acknowledgments
This work is dedicated to Daniel Weinzierl, who helped by acquiring aortic samples and who unexpectedly passed away of unknown cause during the preparation of this article. We thank Knut Krohn and the staff at the Core Unit DNA technologies of the University Leipzig for carrying out the microarray experiments. We thank Anika Stahringer, Magdalena Mock, and Connie Janssen‐van Rhijn for technical support.
(J Am Heart Assoc. 2017;6:e006798 DOI: 10.1161/JAHA.117.006798.)29191809
References
- 1. Thompson MM. Controlling the expansion of abdominal aortic aneurysms. Br J Surg. 2003;90:897–898. [DOI] [PubMed] [Google Scholar]
- 2. Powell JT, Brown LC, Forbes JF, Fowkes FG, Greenhalgh RM, Ruckley CV, Thompson SG. Final 12‐year follow‐up of surgery versus surveillance in the UK Small Aneurysm Trial. Br J Surg. 2007;94:702–708. [DOI] [PubMed] [Google Scholar]
- 3. Choke E, Thompson MM, Dawson J, Wilson WR, Sayed S, Loftus IM, Cockerill GW. Abdominal aortic aneurysm rupture is associated with increased medial neovascularization and overexpression of proangiogenic cytokines. Arterioscler Thromb Vasc Biol. 2006;26:2077–2082. [DOI] [PubMed] [Google Scholar]
- 4. Reeps C, Essler M, Pelisek J, Seidl S, Eckstein HH, Krause BJ. Increased 18F‐fluorodeoxyglucose uptake in abdominal aortic aneurysms in positron emission/computed tomography is associated with inflammation, aortic wall instability, and acute symptoms. J Vasc Surg. 2008;48:417–423; discussion 424 [DOI] [PubMed] [Google Scholar]
- 5. Jalalzadeh H, Indrakusuma R, Planken RN, Legemate DA, Koelemay MJ, Balm R. Inflammation as a predictor of abdominal aortic aneurysm growth and rupture: a systematic review of imaging biomarkers. Eur J Vasc Endovasc Surg. 2016;52:333–342. [DOI] [PubMed] [Google Scholar]
- 6. Thasler WE, Weiss TS, Schillhorn K, Stoll PT, Irrgang B, Jauch KW. Charitable state‐controlled foundation human tissue and cell research: ethic and legal aspects in the supply of surgically removed human tissue for research in the academic and commercial sector in Germany. Cell Tissue Bank. 2003;4:49–56. [DOI] [PubMed] [Google Scholar]
- 7. Holdt LM, Stahringer A, Sass K, Pichler G, Kulak NA, Wilfert W, Kohlmaier A, Herbst A, Northoff BH, Nicolaou A, Gabel G, Beutner F, Scholz M, Thiery J, Musunuru K, Krohn K, Mann M, Teupser D. Circular non‐coding RNA ANRIL modulates ribosomal RNA maturation and atherosclerosis in humans. Nat Commun. 2016;7:12429. [DOI] [PMC free article] [PubMed] [Google Scholar]
- 8. Holdt LM, Hoffmann S, Sass K, Langenberger D, Scholz M, Krohn K, Finstermeier K, Stahringer A, Wilfert W, Beutner F, Gielen S, Schuler G, Gabel G, Bergert H, Bechmann I, Stadler PF, Thiery J, Teupser D. Alu elements in ANRIL non‐coding RNA at chromosome 9p21 modulate atherogenic cell functions through trans‐regulation of gene networks. PLoS Genet. 2013;9:e1003588. [DOI] [PMC free article] [PubMed] [Google Scholar]
- 9. Ritchie ME, Phipson B, Wu D, Hu Y, Law CW, Shi W, Smyth GK. Limma powers differential expression analyses for RNA‐sequencing and microarray studies. Nucleic Acids Res. 2015;43:e47. [DOI] [PMC free article] [PubMed] [Google Scholar]
- 10. Chong HC, Chan JS, Goh CQ, Gounko NV, Luo B, Wang X, Foo S, Wong MT, Choong C, Kersten S, Tan NS. Angiopoietin‐like 4 stimulates STAT3‐mediated iNOS expression and enhances angiogenesis to accelerate wound healing in diabetic mice. Mol Ther. 2014;22:1593–1604. [DOI] [PMC free article] [PubMed] [Google Scholar]
- 11. Osawa T, Ohga N, Akiyama K, Hida Y, Kitayama K, Kawamoto T, Yamamoto K, Maishi N, Kondoh M, Onodera Y, Fujie M, Shinohara N, Nonomura K, Shindoh M, Hida K. Lysyl oxidase secreted by tumour endothelial cells promotes angiogenesis and metastasis. Br J Cancer. 2013;109:2237–2247. [DOI] [PMC free article] [PubMed] [Google Scholar]
- 12. Miljkovic‐Licina M, Hammel P, Garrido‐Urbani S, Bradfield PF, Szepetowski P, Imhof BA. Sushi repeat protein X‐linked 2, a novel mediator of angiogenesis. FASEB J. 2009;23:4105–4116. [DOI] [PubMed] [Google Scholar]
- 13. Yin C, Xiao Y, Zhang W, Xu E, Liu W, Yi X, Chang M. DNA microarray analysis of genes differentially expressed in adipocyte differentiation. J Biosci. 2014;39:415–423. [DOI] [PubMed] [Google Scholar]
- 14. Jiang C, Sun J, Dai Y, Cao P, Zhang L, Peng S, Zhou Y, Li G, Tang J, Xiang J. HIF‐1A and C/EBPs transcriptionally regulate adipogenic differentiation of bone marrow‐derived MSCs in hypoxia. Stem Cell Res Ther. 2015;6:21. [DOI] [PMC free article] [PubMed] [Google Scholar]
- 15. Chen SZ, Xu X, Ning LF, Jiang WY, Xing C, Tang QQ, Huang HY. miR‐27 impairs the adipogenic lineage commitment via targeting lysyl oxidase. Obesity (Silver Spring). 2015;23:2445–2453. [DOI] [PubMed] [Google Scholar]
- 16. Xiong L, Wen Y, Miao X, Yang Z. NT5E and FcGBP as key regulators of TGF‐1‐induced epithelial‐mesenchymal transition (EMT) are associated with tumor progression and survival of patients with gallbladder cancer. Cell Tissue Res. 2014;355:365–374. [DOI] [PMC free article] [PubMed] [Google Scholar]
- 17. Boufraqech M, Zhang L, Nilubol N, Sadowski SM, Kotian S, Quezado M, Kebebew E. Lysyl oxidase (LOX) transcriptionally regulates SNAI2 expression and TIMP4 secretion in human cancers. Clin Cancer Res. 2016;22:4491–4504. [DOI] [PMC free article] [PubMed] [Google Scholar]
- 18. Tang H, Zhao J, Zhang L, Zhuang Y, Liang P. SRPX2 enhances the epithelial‐mesenchymal transition and temozolomide resistance in glioblastoma cells. Cell Mol Neurobiol. 2016;36:1067–1076. [DOI] [PMC free article] [PubMed] [Google Scholar]
- 19. Doderer SA, Gäbel G, Kokje VBC, Northoff BH, Holdt LM, Hamming JF, Lindeman JHN. Adventitial adipogenic degeneration is an unidentified contributor to aortic wall weakening in the abdominal aortic aneurysm. J Vasc Surg. 2017. Availabe at: http://www.jvascsurg.org/article/S0741-5214(17)31601-4/fulltext. Accessed November 10, 2017. [DOI] [PubMed] [Google Scholar]
- 20. Choke E, Cockerill GW, Laing K, Dawson J, Wilson WR, Loftus IM, Thompson MM. Whole genome‐expression profiling reveals a role for immune and inflammatory response in abdominal aortic aneurysm rupture. Eur J Vasc Endovasc Surg. 2009;37:305–310. [DOI] [PubMed] [Google Scholar]
- 21. Lenk GM, Tromp G, Skunca M, Gatalica Z, Berguer R, Kuivaniemi H. Global expression profiles in human normal and aneurysmal abdominal aorta based on two distinct whole genome microarray platforms. Ann N Y Acad Sci. 2006;1085:360–362. [DOI] [PubMed] [Google Scholar]
- 22. Biros E, Gabel G, Moran CS, Schreurs C, Lindeman JH, Walker PJ, Nataatmadja M, West M, Holdt LM, Hinterseher I, Pilarsky C, Golledge J. Differential gene expression in human abdominal aortic aneurysm and aortic occlusive disease. Oncotarget. 2015;6:12984–12996. [DOI] [PMC free article] [PubMed] [Google Scholar]
- 23. Butt HZ, Sylvius N, Salem MK, Wild JB, Dattani N, Sayers RD, Bown MJ. Microarray‐based gene expression profiling of abdominal aortic aneurysm. Eur J Vasc Endovasc Surg. 2016;52:47–55. [DOI] [PubMed] [Google Scholar]
- 24. Giusti B, Rossi L, Lapini I, Magi A, Pratesi G, Lavitrano M, Biasi GM, Pulli R, Pratesi C, Abbate R. Gene expression profiling of peripheral blood in patients with abdominal aortic aneurysm. Eur J Vasc Endovasc Surg. 2009;38:104–112. [DOI] [PubMed] [Google Scholar]
- 25. Courtois A, Nusgens BV, Hustinx R, Namur G, Gomez P, Kuivaniemi H, Defraigne JO, Colige AC, Sakalihasan N. Gene expression study in positron emission tomography‐positive abdominal aortic aneurysms identifies CCL18 as a potential biomarker for rupture risk. Mol Med. 2015;20:697–706. [DOI] [PMC free article] [PubMed] [Google Scholar]
- 26. Suviolahti E, Ge S, Nast CC, Mirocha J, Karasyov A, White M, Jordan SC, Toyoda M. Genes associated with antibody‐dependent cell activation are overexpressed in renal biopsies from patients with antibody‐mediated rejection. Transplant Immunol. 2015;32:9–17. [DOI] [PubMed] [Google Scholar]
- 27. Kugo H, Zaima N, Tanaka H, Mouri Y, Yanagimoto K, Hayamizu K, Hashimoto K, Sasaki T, Sano M, Yata T, Urano T, Setou M, Unno N, Moriyama T. Adipocyte in vascular wall can induce the rupture of abdominal aortic aneurysm. Sci Rep. 2016;6:31268. [DOI] [PMC free article] [PubMed] [Google Scholar]
- 28. Regassa A, Kim WK. Transcriptome analysis of hen preadipocytes treated with an adipogenic cocktail (DMIOA) with or without 20(S)‐hydroxylcholesterol. BMC Genomics. 2015;16:91. [DOI] [PMC free article] [PubMed] [Google Scholar]
- 29. Huang RL, Teo Z, Chong HC, Zhu P, Tan MJ, Tan CK, Lam CR, Sng MK, Leong DT, Tan SM, Kersten S, Ding JL, Li HY, Tan NS. ANGPTL4 modulates vascular junction integrity by integrin signaling and disruption of intercellular VE‐cadherin and claudin‐5 clusters. Blood. 2011;118:3990–4002. [DOI] [PubMed] [Google Scholar]
- 30. Royer‐Zemmour B, Ponsole‐Lenfant M, Gara H, Roll P, Leveque C, Massacrier A, Ferracci G, Cillario J, Robaglia‐Schlupp A, Vincentelli R, Cau P, Szepetowski P. Epileptic and developmental disorders of the speech cortex: ligand/receptor interaction of wild‐type and mutant SRPX2 with the plasminogen activator receptor uPAR. Hum Mol Genet. 2008;17:3617–3630. [DOI] [PubMed] [Google Scholar]
- 31. Law AY, Wong CK. Stanniocalcin‐1 and ‐2 promote angiogenic sprouting in HUVECs via VEGF/VEGFR2 and angiopoietin signaling pathways. Mol Cell Endocrinol. 2013;374:73–81. [DOI] [PubMed] [Google Scholar]
- 32. Koo BH, Coe DM, Dixon LJ, Somerville RP, Nelson CM, Wang LW, Young ME, Lindner DJ, Apte SS. ADAMTS9 is a cell‐autonomously acting, anti‐angiogenic metalloprotease expressed by microvascular endothelial cells. Am J Pathol. 2010;176:1494–1504. [DOI] [PMC free article] [PubMed] [Google Scholar]
- 33. Masoud GN, Li W. HIF‐1α pathway: role, regulation and intervention for cancer therapy. Acta Pharm Sin B. 2015;5:378–389. [DOI] [PMC free article] [PubMed] [Google Scholar]
- 34. Pez F, Dayan F, Durivault J, Kaniewski B, Aimond G, Le Provost GS, Deux B, Clezardin P, Sommer P, Pouyssegur J, Reynaud C. The HIF‐1‐inducible lysyl oxidase activates HIF‐1 via the Akt pathway in a positive regulation loop and synergizes with HIF‐1 in promoting tumor cell growth. Cancer Res. 2011;71:1647–1657. [DOI] [PubMed] [Google Scholar]
- 35. Welch‐Reardon KM, Wu N, Hughes CC. A role for partial endothelial‐mesenchymal transitions in angiogenesis? Arterioscler Thromb Vasc Biol. 2015;35:303–308. [DOI] [PMC free article] [PubMed] [Google Scholar]
- 36. Hinz B, Phan SH, Thannickal VJ, Prunotto M, Desmouliere A, Varga J, De Wever O, Mareel M, Gabbiani G. Recent developments in myofibroblast biology: paradigms for connective tissue remodeling. Am J Pathol. 2012;180:1340–1355. [DOI] [PMC free article] [PubMed] [Google Scholar]
- 37. Hu B, Phan SH. Myofibroblasts. Curr Opin Rheumatol. 2013;25:71–77. [DOI] [PMC free article] [PubMed] [Google Scholar]
- 38. Kalluri R, Weinberg RA. The basics of epithelial‐mesenchymal transition. J Clin Invest. 2009;119:1420–1428. [DOI] [PMC free article] [PubMed] [Google Scholar]
- 39. Zeisberg EM, Potenta SE, Sugimoto H, Zeisberg M, Kalluri R. Fibroblasts in kidney fibrosis emerge via endothelial‐to‐mesenchymal transition. J Am Soc Nephrol. 2008;19:2282–2287. [DOI] [PMC free article] [PubMed] [Google Scholar]
- 40. Xu X, Tan X, Tampe B, Sanchez E, Zeisberg M, Zeisberg EM. Snail is a direct target of hypoxia‐inducible factor 1α (HIF1α) in hypoxia‐induced endothelial to mesenchymal transition of human coronary endothelial cells. J Biol Chem. 2015;290:16653–16664. [DOI] [PMC free article] [PubMed] [Google Scholar]
- 41. Higgins DF, Kimura K, Bernhardt WM, Shrimanker N, Akai Y, Hohenstein B, Saito Y, Johnson RS, Kretzler M, Cohen CD, Eckardt KU, Iwano M, Haase VH. Hypoxia promotes fibrogenesis in vivo via HIF‐1 stimulation of epithelial‐to‐mesenchymal transition. J Clin Invest. 2007;117:3810–3820. [DOI] [PMC free article] [PubMed] [Google Scholar]
- 42. Ma X, Gu L, Li H, Gao Y, Li X, Shen D, Gong H, Li S, Niu S, Zhang Y, Fan Y, Huang Q, Lyu X, Zhang X. Hypoxia‐induced overexpression of stanniocalcin‐1 is associated with the metastasis of early stage clear cell renal cell carcinoma. J Transl Med. 2015;13:56. [DOI] [PMC free article] [PubMed] [Google Scholar]
- 43. Shrestha N, Chand L, Han MK, Lee SO, Kim CY, Jeong YJ. Glutamine inhibits CCL4 induced liver fibrosis in mice and TGF‐β1 mediated epithelial‐mesenchymal transition in mouse hepatocytes. Food Chem Toxicol. 2016;93:129–137. [DOI] [PubMed] [Google Scholar]
- 44. Kokje VB, Hamming JF, Lindeman JH. Editor's choice—pharmaceutical management of small abdominal aortic aneurysms: a systematic review of the clinical evidence. Eur J Vasc Endovasc Surg. 2015;50:702–713. [DOI] [PubMed] [Google Scholar]
- 45. Shi S, Orbay H, Yang Y, Graves SA, Nayak TR, Hong H, Hernandez R, Luo H, Goel S, Theuer CP, Nickles RJ, Cai W. PET imaging of abdominal aortic aneurysm with 64Cu‐labeled anti‐CD105 antibody Fab fragment. J Nucl Med. 2015;56:927–932. [DOI] [PMC free article] [PubMed] [Google Scholar]
- 46. Qi J, Yang P, Yi B, Huo Y, Chen M, Zhang J, Sun J. Heat shock protein 90 inhibition by 17‐DMAG attenuates abdominal aortic aneurysm formation in mice. Am J Physiol Heart Circ Physiol. 2015;308:H841–H852. [DOI] [PMC free article] [PubMed] [Google Scholar]
- 47. Tsai SH, Huang PH, Hsu YJ, Peng YJ, Lee CH, Wang JC, Chen JW, Lin SJ. Inhibition of hypoxia inducible factor‐1α attenuates abdominal aortic aneurysm progression through the down‐regulation of matrix metalloproteinases. Sci Rep. 2016;6:28612. [DOI] [PMC free article] [PubMed] [Google Scholar]