

Abstract
Background
In ST‐segment–elevation myocardial infarction (STEMI), troponins are not needed for diagnosis: symptoms and ECG data are sufficient to activate percutaneous coronary intervention. This study explored the prognostic value of new‐generation troponins in a real‐life cohort contemporarily treated for STEMI.
Methods and Results
We studied 1260 consecutive patients with primary STEMI treated with percutaneous coronary intervention between February 22, 2011, and August 31, 2015. We collected data on clinical characteristics and major adverse cardiovascular and cerebrovascular events (MACCEs) at 30 days and 1 year. Peak high‐sensitivity troponin T and sensitive‐contemporary troponin I levels were recorded. MACCEs occurred in 75 patients (6.1%) by day 30 and in 124 patients (10.8%) between day 31 and 1 year. A short‐term (0–30 days) multivariable Cox regression analysis revealed that age, Killip‐Kimball class, and left ventricular ejection fraction were independent predictors of MACCEs. In adjusted analysis, peak high‐sensitivity troponin T and sensitive‐contemporary troponin I were not significant (hazard ratio, 1.23 [95% confidence interval, 0.98–1.54] [P=0.071]; and hazard ratio, 1.15 [95% confidence interval, 0.93–1.43] [P=0.200], respectively). A long‐term (31 days–1 year) multivariable Cox regression analysis revealed that age, female sex, diabetes mellitus, prior coronary artery disease, Killip‐Kimball class, and left ventricular ejection fraction were statistically significantly associated with MACCEs. However, peak high‐sensitivity troponin T and peak sensitive‐contemporary troponin I were not significantly associated with MACCEs (hazard ratio, 1.03 [95% confidence interval, 0.88–1.20] [P=0.715]; and hazard ratio, 0.99 [95% confidence interval, 0.85–1.15] [P=0.856], respectively).
Conclusions
In the modern era, new‐generation troponins do not provide significant prognostic information for predicting clinical events in STEMI. We should reconsider the value of serial troponin measurements for risk stratification in STEMI.
Keywords: myocardial infarction, prognosis, ST‐segment–elevation myocardial infarction, troponin
Subject Categories: Ischemia, Mortality/Survival, Cardiovascular Disease, Biomarkers, Prognosis
Clinical Perspective
What Is New?
Peak concentrations of 2 different new‐generation cardiac troponin assays (high‐sensitivity troponin T and sensitive‐contemporary troponin I) were not statistically significantly associated with the incidence of major adverse cardiovascular and cerebrovascular events during follow‐up in a cohort of unselected patients with ST‐segment–elevation myocardial infarction.
What Are the Clinical Implications?
Serial troponin measurements using either troponin T or I (irrespective of the generation of the assay used) in ST‐segment–elevation myocardial infarction might not be beneficial for patient risk stratification in the modern era.
The high clinical sensitivity and myocardial tissue specificity of troponins have positioned them as the quintessential biomarker for myocardial damage and the preferred biomarker for diagnosing myocardial infarction (MI).1 However, in the setting of ST‐segment–elevation MI (STEMI), diagnosis does not require troponin measurement: symptoms and ECG data are sufficient to activate a percutaneous coronary intervention (PCI).
It is well known that, after an STEMI, cardiac troponins correlate with infarct size in the short‐term phase2, 3 and with left ventricular remodeling during the long‐term.4 Nevertheless, it is uncertain whether serial troponin measurements provide true value in clinical predictions of STEMI in the era of primary PCI. Accordingly, this study aimed to evaluate the prognostic value of peak troponin levels in patients with STEMI over standard prognosticators. We measured troponins with a sensitive‐contemporary troponin I (sc‐TnI) assay and a high‐sensitivity cardiac troponin T (hs‐TnT) assay.
Methods
The data that support the findings of this study are available from the corresponding author on reasonable request.
Study Population
The RUTI‐STEMI Study was a prospective observational study that included consecutive patients with STEMI admitted to a single center (affiliated with the “Catalan Codi Infart’) who were treated with primary PCI between February 22, 2011, and August 31, 2015. The center served a population of 817 000 inhabitants, mainly distributed among 4 urban areas. Each area had a hospital that lacked primary PCI services, located 2, 7, 20, or 45 km from the center. The diagnosis of STEMI was established when patients presented with chest pain and an ECG showed ST‐segment elevation in 2 or more contiguous leads (elevation was defined as a minimum of 0.1 mV in the frontal leads and 0.2 mV in the precordial leads) or with a left bundle branch block (new onset or indeterminate chronology) that evolved within 12 hours.5, 6
Baseline demographics and clinical data were recorded during hospital admission. At 3 specified time points (primary PCI, at 12 hours, and at 24 hours), blood samples were obtained and processed for central laboratory estimations of cardiac troponins; peak troponin levels were determined. The left ventricular ejection fraction (LVEF) was assessed within the first 24 hours of admission with echocardiography (Agilent Sonos 5500‐Philips and ie33‐Philips) using the Simpson method. The local Ethics Committee approved the study, and participants provided informed consent.
sc‐TnI Assay
sc‐TnI levels were measured with a sandwich chemiluminescence immunoassay based on LOCI technology (Troponin I LOCI Siemens, RF621) on the automatic analyzer Dimension EXL Integrated Chemistry System (Siemens Diagnostics). As described by the manufacturer (RF 621, 2009‐04‐22 Siemens Healthcare Diagnostics Inc), the 99th percentile for normal was 0 to 56 ng/L, and the functional sensitivity (limit of quantification with a coefficient of variation of <10%) was 50 ng/L. The analytic measurement range for LOCI Troponin I measured in Dimension EXL was 17 to 40 000 ng/L, without any dilution or pretreatment. The manufacturer claimed that this assay was considered high sensitivity, on the basis of imprecision and other performance characteristics. However, in a recent population study,7 it was classified as a sensitive‐contemporary assay (sc‐TnI), and the 99th percentile for normal was 34 ng/L (39 ng/L for men and 22 ng/L for women).
hs‐TnT Assay
hs‐TnT levels were measured with an electrochemiluminescence immunoassay (ultrasensitive troponin T method, ref 05092744 190; Roche Diagnostics) performed on a cobas e601 analyzer (Roche Diagnostics). The analytic performance of this assay has been validated.8 As described by the manufacturer (ref 05092744 190; Roche Diagnostics), the 99th percentile for normal was 14 ng/L and the functional sensitivity (limit of quantification with a coefficient of variation of <10%) was 13 ng/L. The hs‐TnT assay analytic range was from 3 to 10 000 ng/L. According to a recent population study,9 it was classified as a high‐sensitivity assay (hs‐TnT), and the 99th percentile for normal was 15 ng/L (20 ng/L for men and 13 ng/L for women).
Outcomes
The primary outcome of this study was the composite of major adverse cardiovascular and cerebrovascular events (MACCEs), which were identified as all‐cause death, nonfatal acute coronary syndrome, readmission for angina, heart failure, and stroke, by day 30, and from day 31 to the 1‐year follow‐up. For patients with recurrent events, the time to the first event was recorded. Hospital readmissions and deaths were identified by telephone contacts and from electronic patient records.
Statistical Analysis
Categorical variables are expressed as a number and percentage; continuous variables are expressed as the median and interquartile range (IQR). Comparisons of categorical variables were performed with the χ2 test. Comparisons of continuous variables were performed with the Wilcoxon rank sum test. Univariable and multivariable Cox regression models were performed with the backward stepwise procedure to determine whether sc‐TnI and hs‐TnT variables (logarithm transformed) were independent predictors of MACCEs. Hazard ratios (HRs) with 95% confidence intervals (CIs) are reported. The following variables were incorporated into the regression models (one model for each troponin assay): age, sex, history of hypertension, diabetes mellitus, cerebrovascular disease, heart failure, MI, previous coronary artery disease, Killip‐Kimball class category, LVEF, anterior infarct location, multivessel disease, and time from symptom onset to revascularization. The proportional hazards assumption was evaluated by assessing Schoenfeld residuals. Adjusted Kaplan‐Meier curves were performed to determine MACCE occurrence over time for patients in different tertiles of the distribution of peak hs‐TnT and sc‐TnI levels. Both hs‐TnT and sc‐TnI showed linearity of risk. Receiver operating characteristic curve analyses were performed to evaluate whether hs‐TnT or sc‐TnI peak levels could predict MACCEs at 30‐days and between 31 days and 1 year. To assess whether there were any improvements in discrimination, calibration, and net reclassification by adding peak hs‐TnT and sc‐TnI levels to a clinical model, we performed receiver operating characteristic curve analyses and the Hosmer‐Lemeshow (HL) test and obtained the risk category net reclassification improvement (NRI). Differences were considered statistically significant at P<0.05. All analyses were performed with STATA V.13.0 (StataCorp, College Station, TX).
Results
Baseline Characteristics
Of 1260 consecutive patients admitted from February 22, 2011, to August 31, 2015, with STEMI, 1224 (97.1%) had available hs‐TnT and sc‐TnI measurements and were included in the final analysis. Overall, 199 patients (16.3%) had an MACCE during the follow‐up. Baseline characteristics of patients are shown in Table 1. The median age was 62 (IQR, 52–72) years; 263 patients (21.5%) were women. Compared with the no‐MACCE group, patients in the MACCE group were more likely to be women and older; moreover, patients with MACCEs had significantly higher rates of baseline risk factors, including hypertension, diabetes mellitus, heart failure, and a history of MI (Table 1). Compared with the no‐MACCE group, the MACCE group exhibited a longer interval between symptom onset‐to‐device (240 versus 187 minutes; P<0.001), greater disease severity (Killip‐Kimball class III or IV, 23.6% versus 3.1%; P<0.001), greater frequency of anterior infarct location (50.7% versus 40.7%; P=0.009), and a worse LVEF (47% versus 53%; P<0.001). Finally, extensive coronary artery disease (3‐vessel disease) was more prevalent among patients with MACCEs than among those without MACCEs (30.6% versus 18.0%; P<0.001). At discharge, patients were treated according to current guidelines; indeed, 95.3% received aspirin, 92.8% received a P2Y12 blocker, 92.6% received double antiplatelet therapy, 86.4% received a β blocker, 65.2% received an angiotensin‐converting enzyme inhibitor or an angiotensin receptor blocker, and 91.8% received statins.
Table 1.
Baseline Characteristics of the Whole Cohort and Association With MACCEs at the 1‐Year Follow‐Up
| Variable | All Patients (N=1224) | No MACCEs (n=1025) | MACCEs (n=199) | P Value |
|---|---|---|---|---|
| Demographics | ||||
| Age, y | 62 (52–72) | 60 (51–70) | 72 (60–81) | <0.001 |
| Female sex | 263 (21.5) | 198 (19.3) | 65 (32.7) | <0.001 |
| History | ||||
| Smoking | 923 (75.4) | 795 (77.6) | 128 (64.3) | <0.001 |
| Hypertension | 672 (54.9) | 541 (52.8) | 131 (65.8) | 0.001 |
| Diabetes mellitus | 301 (24.6) | 225 (22.0) | 76 (38.2) | <0.001 |
| Dyslipidemia | 731 (59.7) | 615 (60.0) | 116 (58.3) | 0.653 |
| Cerebrovascular disease | 65 (5.3) | 47 (4.6) | 18 (9.1) | 0.010 |
| Peripheral arterial disease | 78 (6.4) | 59 (5.8) | 19 (9.5) | 0.045 |
| Heart failure | 17 (1.4) | 9 (0.9) | 8 (4.0) | 0.003 |
| Coronary artery disease | 266 (21.7) | 202 (19.7) | 64 (32.2) | <0.001 |
| Myocardial infarction | 108 (8.8) | 80 (7.8) | 28 (14.1) | 0.004 |
| PCI | 95 (7.8) | 69 (6.7) | 26 (13.1) | 0.002 |
| CABG | 13 (1.1) | 10 (1.0) | 3 (1.5) | 0.454 |
| Physical examination finding | ||||
| Killip class I | 987 (80.6) | 875 (85.4) | 112 (56.3) | <0.001 |
| Killip class II | 158 (12.9) | 118 (11.5) | 40 (20.1) | 0.001 |
| Killip class III–IV | 79 (6.5) | 32 (3.1) | 47 (23.6) | <0.001 |
| BMI, kg/m2 | 27.2 (24.7–30.0) | 27.2 (24.7–30.0) | 27.0 (24.9–30.0) | 0.998 |
| Infarct location | ||||
| Anterior | 518 (42.3) | 417 (40.7) | 101 (50.7) | 0.009 |
| symptom onset‐to‐device, min | 194 (133–324) | 187 (131–301) | 240 (154–401) | <0.001 |
| Cardiac biomarkers | ||||
| hs‐TnT, peak, ng/L | 3052 (1142–6392) | 2792 (1119–5990) | 4975 (1455–11 196) | <0.001 |
| sc‐TnI, peak, ng/L | 24.16 (9.89–55.11) | 22.85 (9.58–47.62) | 45.31 (15.98–99.93) | <0.001 |
| LVEF at discharge, % | 52 (45–58) | 53 (47–59) | 47 (39–55) | <0.001 |
| Coronary angiography | ||||
| Main epicardial coronary arteries >70% stenosis | ||||
| 1 | 639 (52.2) | 560 (54.7) | 79 (39.7) | <0.001 |
| 2 | 339 (27.7) | 280 (27.3) | 59 (29.7) | 0.501 |
| 3 | 245 (20.0) | 184 (18.0) | 61 (30.6) | <0.001 |
| Left main artery ≥50% stenosis | 45 (3.7) | 26 (2.5) | 19 (9.6) | <0.001 |
| PCI, vessels treated | ||||
| 1 | 1186 (97.1) | 1004 (97.9) | 182 (91.5) | <0.001 |
| 2 | 30 (2.5) | 19 (1.9) | 11 (5.5) | 0.005 |
| 3 | 1 (0.1) | 0 | 1 (0.5) | 0.163 |
Data represent the number (percentage) or median (interquartile range). Wilcoxon rank‐sum test was used for comparisons of continuous variables. BMI indicates body mass index; CABG, coronary artery bypass graft; hs‐TnT, high‐sensitivity troponin T; LVEF, left ventricular ejection fraction; MACCE, major adverse cardiovascular and cerebrovascular event; PCI, percutaneous coronary intervention; and sc‐TnI, sensitive‐contemporary troponin I.
Cardiac Troponin Levels and MACCEs
Among all patients, the median hs‐TnT peak was 3052.6 ng/L, and the median sc‐TnI peak was 24.16 ng/L. At the 30‐day follow‐up, 49 patients (4.0%) died and 26 patients (2.1%) experienced hospital readmission for cardiovascular disease. From day 31 to the 1‐year follow‐up, 32 patients (2.7%) died and 103 patients (8.6%) experienced hospital readmission for cardiovascular disease. When these events were considered mutually exclusive, the clinical composite end point occurred in 75 patients (6.1%) by day 30 and in 124 patients (10.8%) between day 31 and the 1‐year follow‐up (Table 2).
Table 2.
Mortality, Hospital Readmissions for Cardiovascular Disease, and MACCEs in All Patients
| Variable | No. (%) of Patients |
|---|---|
| Mortality | |
| Day 0–30 | 49 (4.0) |
| Day 31–1 y | 32 (2.7) |
| Hospital readmissions for cardiovascular disease | |
| Day 0–30 | 26 (2.1) |
| AMI | 5 |
| Angina | 11 |
| Heart failure | 8 |
| Stroke | 2 |
| Day 31–1 y | 103 (8.6) |
| AMI | 22 |
| Angina | 37 |
| Heart failure | 38 |
| Stroke | 6 |
| Major adverse cardiovascular and cerebrovascular events | |
| Day 0–30 | 75 (6.1) |
| Day 31–1 y | 124 (10.8) |
Data represent the number (percentage) of patients in each group. MACCE was defined as mortality or readmission for AMI, angina, heart failure, or stroke. AMI indicates acute myocardial infarction; and MACCE, major adverse cardiovascular and cerebrovascular event.
An unadjusted analysis (logarithm‐transformed variables) of data on day 30 showed that patients with MACCEs had a significantly higher median (IQR) hs‐TnT peak level (8.75 [7.81–9.45] versus 7.97 [7.02–8.72] ng/L; P<0.001) and sc‐TnI peak level (4.11 [3.24–4.84] versus 3.15 [2.28–3.95] ng/L; P<0.001) compared with patients without MACCEs. Likewise, an unadjusted analysis of data from day 31 to the 1‐year follow‐up showed that hs‐TnT peak levels (median, 8.35 [IQR, 7.10–9.11] versus 7.93 [IQR, 7.02–8.70] ng/L; P=0.004) and sc‐TnI peak levels (median, 3.56 [IQR, 2.41–4.55] versus 3.13 [IQR, 2.26–3.86] ng/L; P=0.002) were significantly higher in patients with MACCEs compared with those without MACCEs (Figure 1).
Figure 1.

High‐sensitivity troponin T (hs‐TnT) and sensitive‐contemporary troponin I (sc‐TnI) levels in groups stratified by major adverse cardiovascular and cerebrovascular events (MACCEs). Troponin values are logarithm transformed, and plots show the median and interquartile ranges. P values were calculated on the basis of the Wilcoxon rank‐sum test.
As shown in Table 3, a multivariate Cox regression model analysis demonstrated that age (HR, 1.07; 95% CI, 1.05–1.09; P<0.001), Killip‐Kimball class III or IV (HR, 5.81; 95% CI, 3.23–10.43; P<0.001), and LVEF (HR, 0.96; 95% CI, 0.94–0.98; P=0.001) were independent predictors of the occurrence of MACCEs by the 30‐day follow‐up. In contrast, after adjustment, the multivariate Cox regression showed no significant association between hs‐TnT (HR, 1.23; 95% CI, 0.98–1.54; P=0.071) or sc‐TnI peak levels (HR, 1.15; 95% CI, 0.93–1.43; P=0.200) and MACCEs. A multivariable analysis of the 31‐day to 1‐year period showed that age (HR, 1.03; 95% CI, 1.01–1.04; P<0.001), female sex (HR, 1.72; 95% CI, 1.17–2.53; P=0.006), diabetes mellitus (HR, 1.87; 95% CI, 1.30–2.69; P=0.001), prior coronary artery disease (HR, 1.64; 95% CI, 1.12–2.39; P=0.011), Killip‐Kimball class III or IV (HR, 2.87; 95% CI, 1.64–5.02; P<0.001), and LVEF (HR, 0.97; 95% CI, 0.96–0.99; P=0.004) were associated independently with MACCEs (Table 4). There was no significant association between the hs‐TnT (HR, 1.03; 95% CI, 0.88–1.20; P=0.715) or sc‐TnI (HR, 0.99; 95% CI, 0.85–1.15; P=0.856) peak levels and the composite end point. Figure 2 shows the adjusted Kaplan‐Meier curves for the occurrence of MACCEs in the tertiles of hs‐TnT and sc‐TnI levels.
Table 3.
HRs of Variables Associated With 30‐Day MACCEs in Univariate and Multivariate Cox Regression Analyses
| Variables | Univariate Cox Regression | Multivariate Cox Regression | ||
|---|---|---|---|---|
| HR (95% CI) | P Value | HR (95% CI) | P Value | |
| Age | 1.08 (1.06–1.10) | <0.001 | 1.07 (1.05–1.09) | <0.001 |
| Female sex | 1.73 (1.06–1.84) | 0.029 | … | … |
| Hypertension | 1.60 (0.98–2.59) | 0.058 | … | … |
| Diabetes mellitus | 1.39 (0.86–2.25) | 0.181 | … | … |
| Cerebrovascular disease | 2.59 (1.29–5.20) | 0.008 | … | … |
| Heart failure | 7.70 (3.34–17.75) | <0.001 | … | … |
| Myocardial infarction | 1.56 (0.80–3.04) | 0.187 | … | … |
| Coronary artery disease | 1.69 (1.03–2.77) | 0.037 | … | … |
| Killip‐Kimball class III–IV | 11.88 (7.43–19.00) | <0.001 | 5.81 (3.23–10.43) | <0.001 |
| LVEF at discharge, %a | 0.92 (0.90–0.94) | <0.001 | 0.96 (0.94–0.98) | 0.001 |
| Nonanterior MI | 0.67 (0.42–1.06) | 0.086 | … | … |
| Multivessel disease | 1.52 (0.96–2.42) | 0.075 | … | … |
| Symptom onset‐to‐device, min | 1.46 (1.06–1.99) | 0.020 | … | … |
| Logarithm of hs‐TnT, peak | 1.82 (1.46–2.27) | <0.001 | … | … |
| Logarithm of sc‐TnI, peak | 1.71 (1.43–2.06) | <0.001 | … | … |
CI indicates confidence interval; HR, hazard ratio; hs‐TnT, high‐sensitivity troponin T; LVEF, left ventricular ejection fraction; MACCE, major adverse cardiovascular and cerebrovascular event; MI, myocardial infarction; and sc‐TnI, sensitive‐contemporary troponin I.
The HR value corresponds to each incremental point in the ejection fraction.
Table 4.
HRs of Variables Associated With 31‐Day to 1‐Year MACCEs in Univariate and Multivariate Cox Regression Analyses
| Variables | Univariate Cox Regression | Multivariate Cox Regression | ||
|---|---|---|---|---|
| HR (95% CI) | P Value | HR (95% CI) | P Value | |
| Age | 1.04 (1.03–1.06) | <0.001 | 1.03 (1.01–1.04) | <0.001 |
| Female sex | 2.08 (1.43–3.01) | <0.001 | 1.72 (1.17–2.53) | 0.006 |
| Hypertension | 1.64 (1.13–2.37) | 0.009 | … | … |
| Diabetes mellitus | 2.47 (1.73–3.52) | <0.001 | 1.87 (1.30–2.69) | 0.001 |
| Cerebrovascular disease | 1.38 (0.67–2.83) | 0.378 | … | … |
| Heart failure | 1.80 (0.45–7.28) | 0.410 | … | … |
| Myocardial infarction | 1.92 (1.17–3.17) | 0.010 | … | … |
| Coronary artery disease | 1.97 (1.35–2.86) | <0.001 | 1.64 (1.12–2.39) | 0.011 |
| Killip‐Kimball class III–IV | 4.97 (3.02–8.20) | <0.001 | 2.87 (1.64–5.02) | <0.001 |
| LVEF at discharge, %a | 0.96 (0.94–0.98) | <0.001 | 0.97 (0.96–0.99) | 0.004 |
| Nonanterior MI | 0.71 (0.50–1.01) | 0.055 | … | … |
| Multivessel disease | 1.89 (1.32–2.72) | 0.001 | … | … |
| Symptom onset‐to‐device, min | 1.43 (1.12–1.82) | 0.004 | … | … |
| Logarithm of hs‐TnT, peak | 1.23 (1.06–1.43) | 0.006 | … | … |
| Logarithm of sc‐TnI, peak | 1.23 (1.07–1.41) | 0.004 | … | … |
CI indicates confidence interval; HR, hazard ratio; hs‐TnT, high‐sensitivity troponin T; LVEF, left ventricular ejection fraction; MACCE, major adverse cardiovascular and cerebrovascular event; MI, myocardial infarction; and sc‐TnI, sensitive‐contemporary troponin I.
The HR value corresponds to each incremental point in the ejection fraction.
Figure 2.
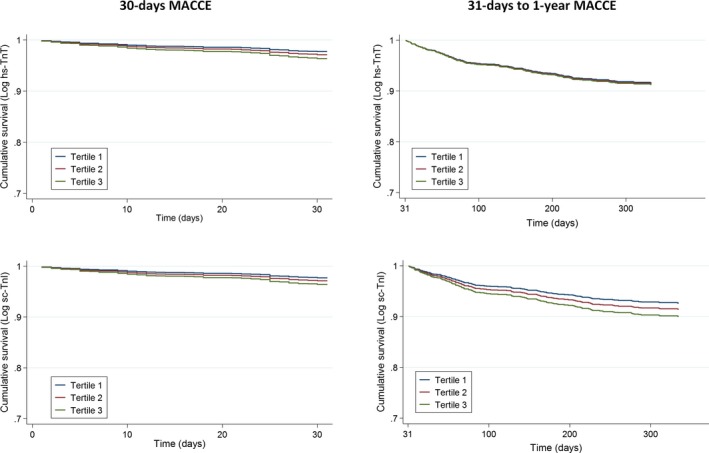
Adjusted Kaplan‐Meier curves show major adverse cardiovascular and cerebrovascular events (MACCEs) in groups with different peak levels of high‐sensitivity troponin T (hs‐TnT) and sensitive‐contemporary troponin I (sc‐TnI). The cohort was divided into tertiles of peak troponin levels. Left: MACCEs during the 30‐day follow‐up. Right: MACCEs from 31 days to the 1‐year follow‐up.
Receiver operating characteristic curves were evaluated with C‐statistics to determine whether hs‐TnT or sc‐TnI could predict MACCEs at 30 days and between 31 days and 1 year. C‐statistics were 0.668 (95% CI, 0.596–0.738) and 0.578 (95% CI, 0.518–0.635), respectively, for hs‐TnT, and 0.685 (95% CI, 0.617–0.757) and 0.587 (95% CI, 0.531–0.643), respectively, for sc‐TnI. C‐statistics analysis showed no significant differences in the predictive ability for 30‐day MACCEs of the clinical model alone relative to the clinical model with sc‐TnI or hs‐TnT (P=0.836 and P=0.833, respectively). Likewise, the predictive ability for MACCEs between 31 days and 1 year of the clinical model with sc‐TnI or hs‐TnT was similar to that of the clinical model alone (P=0.797 and P=0.959, respectively). Also, calibration and net reclassification improvement were similar between the clinical model alone relative to the clinical model with sc‐TnI (HL, 7.49 [P=0.485]; NRI, 0.000 [95% CI, −0.047 to 0.062] for 30‐day MACCEs; and HL, 6.93 [P=0.545]; NRI, −0.008 [95% CI, −0.022 to 0.034] for MACCEs between 31 days and 1 year) or hs‐TnT (HL, 9.56 [P=0.297]; NRI, −0.001 [95% CI, −0.049 to 0.072] for 30‐day MACCEs; and HL, 4.25 [P=0.834]; NRI, −0.005 [95% CI, −0.021 to 0.037] for MACCEs between 31 days and 1 year) (Figure 3).
Figure 3.

Discriminating ability, calibration, and risk category net reclassification improvement (NRI) of the clinical model for predicting major adverse cardiovascular and cerebrovascular events (MACCEs) alone and with sensitive‐contemporary troponin I (sc‐TnI) or high‐sensitivity troponin T (hs‐TnT). A, MACCEs at 30 days. B, MACCEs at 31 days to 1 year. Clinical model in A includes age, Killip‐Kimball class, and left ventricular ejection fraction. Clinical model in B includes age, female sex, diabetes mellitus, prior coronary artery disease, Killip‐Kimball class, and left ventricular ejection fraction. AUC indicates area under the curve; CI, confidence interval; and HL, Hosmer‐Lemeshow.
Discussion
This study comprehensively investigated the value of 2 different new‐generation cardiac troponin assays (hs‐TnT and sc‐TnI) for predicting MACCEs in a cohort of unselected patients with STEMI who were followed up for 1 year. After adjusting for clinical predictors, peak concentrations of cardiac troponins were not statistically significantly associated with the MACCE incidence during follow‐up. This finding suggests that serial measurements of troponin levels in STEMI did not provide additional information for patient risk stratification.
In this RUTI‐STEMI study, the overall incidence of MACCEs was broadly consistent with rates reported in previous studies on patients with STEMI.10, 11 Significant STEMI‐driven morbidity and mortality emphasize the need for early risk stratification, which might identify high‐risk subjects who could benefit from monitoring and more aggressive treatment after the index event. Biomarkers have emerged as accessible and reproducible tools that can aid clinicians by facilitating the identification of patients at risk.
Previous investigations have established that cardiac troponins provided added value to the risk assessment of patients with STEMI. Associations between peak levels of cardiac troponins and long‐term outcomes in STEMI have been previously reported. Boden et al12 reported that, in addition to the peak value, all other fixed‐time hs‐TnT values were associated with adverse outcomes 1 year after STEMI. Hall et al13 performed a post hoc analysis of data from the PROTECTION AMI (The Inhibition of Delta‐Protein Kinase C for the Reduction of Infarct Size in Acute Myocardial Infarction) trial with the Acces AccuTnI assay. They determined that troponin I measured after a primary PCI was statistically significantly associated with clinical outcomes and cardiac function during a 3‐month follow‐up. Buber et al14 also used the Acces AccuTnI assay and found that higher and later peak contemporary troponin I levels were associated with a more complicated hospital course. These results, which clearly differ from those found in our study, should be analyzed with caution, because of the small sample size or the strict inclusion and exclusion criteria, which results in the analysis of patients with fewer comorbidities that do not reflect routine clinical practice.
In contrast to the studies previously mentioned, our results did not show significant associations between the hs‐TnT or sc‐TnI peak levels and the composite end point at follow‐up. A reasonable explanation for this discrepancy was that we included the LVEF during admission into the multivariate Cox regression model. Including the LVEF in the regression analyses attenuated the HR of troponin to the point of nonsignificance. This covariate was systematically excluded from the previously mentioned studies, despite the fact that it is performed routinely in this population. Moreover, LVEF was shown to be an independent predictor of 1‐year survival in patients with STEMI, and it strongly determined left ventricular function convalescence and myocardial recovery, even in the era of primary angioplasty.15, 16
Some studies have investigated the prognostic impact of troponin levels measured at admission, before a primary PCI, but the results have been controversial. Wang et al17 evaluated hs‐TnT in a small cohort of patients and demonstrated that admission troponin measured before primary angioplasty was strongly prognostic of MACCEs at 30 days and 1 year. Giannitsis et al18 evaluated a qualitative and quantitative rapid bedside contemporary troponin T assay in another relatively small population. They found that the rates of all‐cause mortality at 30 days and at 9 months after STEMI were significantly higher in patients positive for contemporary troponin T than in those negative for contemporary troponin T, but these groups showed no differences in the combined end point. Finally, Björklund et al19 performed a substudy of the ASSENT‐2 (Assessment of the Safety and Efficacy of a New Thrombolytic) trial, with a selected population and with a third‐generation contemporary troponin T assay. They found that a positive troponin at admission tended to be independently related to 30‐day and 1‐year mortality, but the relationships were not statistically significant. Our study was not strictly comparable with those studies, because we did not perform a separate analysis of troponin measured at admission; thus, our results did not resolve that controversy. Nevertheless, in the modern era, those results cannot be translated into routine clinical practice, because of the irrelevance of troponins in the diagnosis process and the urgency of revascularization in these patients, which does not permit unnecessary delays; for these reasons, pre‐PCI measurements are not available for all patients, and they are not performed routinely in some hospitals.
Our results require validation in other cohorts of patients with STEMI. However, they suggested that the current practice of performing serial cardiac troponin measurements to establish a peak level has questionable predictive value. Likewise, the use of high‐sensitivity troponin measurements in this context is unnecessary, because values are very high and high sensitivity is unnecessary for these samples. Alternatively, in the context of personalized medicine, recent studies have demonstrated that, in combining multiple biomarkers, each biomarker had incremental value, because it reflected a complementary pathway in cardiovascular disease among patients with STEMI. In that type of multimarker risk stratification approach, cardiac troponins should be considered valid surrogates of cardiac injury.20, 21
Our results also consistently showed that age and the Killip‐Kimball classification were important predictors of the occurrence of MACCEs in patients with STEMI. These findings were consistent with previous research. Indeed, these predictors have been included in risk scores that are widely applied in this population.22, 23, 24, 25
Some limitations of the current study deserve mention. The study had a single‐center prospective study design, and the results must be interpreted in that light. Despite this limitation, our findings were representative of a broad range of unselected patients with STEMI, which reflected a real‐life clinical scenario in our daily practice. However, we used 2 specific troponin assays; thus, generalizations to other troponin assays might be limited. Comparisons among different troponin assays has been difficult, because of the lack of standardization among assays. Event rate for death was low (5 deaths within 30 days and 22 deaths within 1 year), precluding any conclusions on the prognostic information on mortality associated with hs‐TnT or sc‐TnI. Measurements of hs‐TnT and sc‐TnI were limited to the initial 24 hours, with no measurement beyond. During this time, troponin values are dominated by reperfusion and are not helpful to estimate infarct size.
Conclusions
This RUTI‐STEMI study indicated that serial troponin measurements using either troponin T or I (irrespective of the generation of the assay used) in STEMI might not be beneficial for patient risk stratification in the modern era. Because measuring peak troponin levels requires serial sampling with considerable accompanying costs, our data suggest that the value and cost‐effectiveness of routine troponin measurements in STEMI should be reevaluated.
Sources of Funding
Bayes‐Genis was supported by grants from the Ministerio de Educación y Ciencia (SAF2014‐59892), Fundació La MARATÓ de TV3 (201502 and 201516), CIBER Cardiovascular (CB16/11/00403), and AdvanceCat 2014‐2020. Núñez was supported by grants from CIBER Cardiovascular (16/11/00420), FEDER, and PIE (15/00013).
Disclosures
None.
Acknowledgments
We acknowledge the nurse team who actively participated in the collection of the biobank for the RUTI‐STEMI Study.
(J Am Heart Assoc. 2017;6:e007252 DOI: 10.1161/JAHA.117.007252.)29275366
References
- 1. Thygesen K, Alpert JS, Jaffe AS, Simoons ML, Chaitman BR, White HD; Joint ESC/ACCF/AHA/WHF Task Force for Universal Definition of Myocardial Infarction; Authors/Task Force Members Chairpersons , Thygesen K, Alpert JS, White HD; Biomarker Subcommittee , Jaffe AS, Katus HA, Apple FS, Lindahl B, Morrow DA; ECG Subcommittee , Chaitman BR, Clemmensen PM, Johanson P, Hod H; Imaging Subcommittee , Underwood R, Bax JJ, Bonow JJ, Pinto F, Gibbons RJ; Classification Subcommittee , Fox KA, Atar D, Newby LK, Galvani M, Hamm CW; Intervention Subcommittee , Uretsky BF, Steg PG, Wijns W, Bassand JP, Menasche P, Ravkilde J; Trials and Registries Subcommittee , Ohman EM, Antman EM, Wallentin LC, Armstrong PW, Simoons ML; Trials and Registries Subcommittee , Januzzi JL, Nieminen MS, Gheorghiade M, Filippatos G; Trials and Registries Subcommittee , Luepker RV, Fortmann SP, Rosamond WD, Levy D, Wood D; Trials and Registries Subcommittee , Smith SC, Hu D, Lopez‐Sendon JL, Robertson RM, Weaver D, Tendera M, Bove AA, Parkhomenko AN, Vasilieva EJ, Mendis S; ESC Committee for Practice Guidelines (CPG) , Bax JJ, Baumgartner H, Ceconi C, Dean V, Deaton C, Fagard R, Funck‐Brentano C, Hasdai D, Hoes A, Kirchhof P, Knuuti J, Kolh P, McDonagh T, Moulin C, Popescu BA, Reiner Z, Sechtem U, Sirnes PA, Tendera M, Torbicki A, Vahanian A, Windecker S; Document Reviewers , Morais J, Aguiar C, Almahmeed W, Arnar DO, Barili F, Bloch KD, Bolger AF, Botker HE, Bozkurt B, Bugiardini R, Cannon C, de Lemos J, Eberli FR, Escobar E, Hlatky M, James S, Kern KB, Moliterno DJ, Mueller C, Neskovic AN, Pieske BM, Schulman SP, Storey RF, Taubert KA, Vranckx P, Wagner DR. Third universal definition of myocardial infarction. J Am Coll Cardiol. 2012;60:1581–1598.22958960 [Google Scholar]
- 2. Hallen J, Buser P, Schwitter J, Petzelbauer P, Geudelin B, Fagerland MW, Jaffe AS, Atar D. Relation of cardiac troponin I measurements at 24 and 48 hours to magnetic resonance‐determined infarct size in patients with ST‐elevation myocardial infarction. Am J Cardiol. 2009;104:1472–1477. [DOI] [PubMed] [Google Scholar]
- 3. Steen H, Giannitsis E, Futterer S, Merten C, Juenger C, Katus HA. Cardiac troponin T at 96 hours after acute myocardial infarction correlates with infarct size and cardiac function. J Am Coll Cardiol. 2006;48:2192–2194. [DOI] [PubMed] [Google Scholar]
- 4. Reinstadler SJ, Feistritzer HJ, Reindl M, Klug G, Mayr A, Mair J, Jaschke W, Metzler B. Combined biomarker testing for the prediction of left ventricular remodelling in ST‐elevation myocardial infarction. Open Heart. 2016;3:e000485. [DOI] [PMC free article] [PubMed] [Google Scholar]
- 5. Steg PG, James SK, Atar D, Badano LP, Blömstrom‐Lundqvist C, Borger MA, Di Mario C, Dickstein K, Ducrocq G, Fernandez‐Aviles F, Gershlick AH, Giannuzzi P, Halvorsen S, Huber K, Juni P, Kastrati A, Knuuti J, Lenzen MJ, Mahaffey KW, Valgimigli M, van ‘t Hof A, Widimsky P, Zahger D. ESC guidelines for the management of acute myocardial infarction in patients presenting with ST‐segment elevation: the Task Force on the management of ST‐segment elevation acute myocardial infarction of the European Society of Cardiology. Eur Heart J. 2012;33:2569–2619. [DOI] [PubMed] [Google Scholar]
- 6. O'Gara PT, Kushner FG, Ascheim DD, Casey DE Jr, Chung MK, de Lemos JA, Ettinger SM, Fang JC, Fesmire FM, Franklin BA, Granger CB, Krumholz HM, Linderbaum JA, Morrow DA, Newby LK, Ornato JP, Ou N, Radford MJ, Tamis‐Holland JE, Tommaso CL, Tracy CM, Woo YJ, Zhao DX, Anderson JL, Jacobs AK, Halperin JL, Albert NM, Brindis RG, Creager MA, DeMets D, Guyton RA, Hochman JS, Kovacs RJ, Kushner FG, Ohman EM, Stevenson WG, Yancy CW. 2013 ACCF/AHA guideline for the management of ST‐elevation myocardial infarction: a report of the American College of Cardiology Foundation/American Heart Association Task Force on Practice Guidelines. J Am Coll Cardiol. 2013;61:e78–e140. [DOI] [PubMed] [Google Scholar]
- 7. Apple FS, Ler R, Murakami M. Determination of 19 cardiac troponin I and T assay 99th percentile values from a common presumably healthy population. Clin Chem. 2012;58:1574–1581. [DOI] [PubMed] [Google Scholar]
- 8. Giannitsis E, Kurz K, Hallermayer K, Jarausch J, Jaffe AS, Katus HA. Analytical validation of a high‐sensitivity cardiac troponin T assay. Clin Chem. 2010;56:254–261. [DOI] [PubMed] [Google Scholar]
- 9. Saenger AK, Beyrau R, Braun S, Cooray R, Dolci A, Freidank H, Giannitsis E, Gustafson S, Handy B, Katus H, Melanson SE, Panteghini M, Venge P, Zorn M, Jarolim P, Bruton D, Jarausch J, Jaffe AS. Multicenter analytical evaluation of a high‐sensitivity troponin T assay. Clin Chim Acta. 2011;412:748–754. [DOI] [PubMed] [Google Scholar]
- 10. Abu‐Assi E, López‐López A, González‐Salvado V, Redondo‐Diéguez A, Peña‐Gil C, Bouzas‐Cruz N, Raposeiras‐Roubín S, Riziq‐Yousef Abumuaileq R, García‐Acuña JM, González‐Juanatey JR. The risk of cardiovascular events after an acute coronary event remains high, especially during the first year, despite revascularization. Rev Esp Cardiol (Engl Ed). 2016;69:11–18. [DOI] [PubMed] [Google Scholar]
- 11. Jernberg T, Hasvold P, Henriksson M, Hjelm H, Thuresson M, Janzon M. Cardiovascular risk in post‐myocardial infarction patients: nationwide real‐world data demonstrate the importance of a long‐term perspective. Eur Heart J. 2015;36:1163–1170. [DOI] [PubMed] [Google Scholar]
- 12. Boden H, Ahmed TA, Velders MA, van der Hoeven BL, Hoogslag GE, Bootsma M, le Cessie S, Cobbaert CM, Delgado V, van der Laarse A, Schalij MJ. Peak and fixed‐time high‐sensitive troponin for prediction of infarct size, impaired left ventricular function, and adverse outcomes in patients with first ST‐segment elevation myocardial infarction receiving percutaneous coronary intervention. Am J Cardiol. 2013;111:1387–1393. [DOI] [PubMed] [Google Scholar]
- 13. Hall TS, Hallén J, Krucoff MW, Roe MT, Brennan DM, Agewall S, Atar D, Lincoff AM. Cardiac troponin I for prediction of clinical outcomes and cardiac function through 3‐month follow‐up after primary percutaneous coronary intervention for ST‐segment elevation myocardial infarction. Am Heart J. 2015;169:257–265. [DOI] [PubMed] [Google Scholar]
- 14. Buber J, Laish‐Farkash A, Koren‐Morag N, Fefer P, Segev A, Hod H, Matetzky S. Cardiac troponin elevation pattern in patients undergoing a primary percutaneous coronary intervention for ST‐segment elevation myocardial infarction: characterization and relationship with cardiovascular events during hospitalization. Coron Artery Dis. 2015;26:503–509. [DOI] [PubMed] [Google Scholar]
- 15. Halkin A, Stone GW, Dixon SR, Grines CL, Tcheng JE, Cox DA, Garcia E, Brodie B, Stuckey TD, Mehran R, Lansky AJ. Impact and determinants of left ventricular function in patients undergoing primary percutaneous coronary intervention in acute myocardial infarction. Am J Cardiol. 2005;96:325–331. [DOI] [PubMed] [Google Scholar]
- 16. Ng VG, Lansky AJ, Meller S, Witzenbichler B, Guagliumi G, Peruga JZ, Brodie B, Shah R, Mehran R, Stone GW. The prognostic importance of left ventricular function in patients with ST‐segment elevation myocardial infarction: the HORIZONS‐AMI trial. Eur Heart J Acute Cardiovasc Care. 2014;3:67–77. [DOI] [PMC free article] [PubMed] [Google Scholar]
- 17. Wang TK, Snow TA, Chen Y, Rostom H, White JM, Stewart JT, Webster MW, Ruygrok PN, Watson T, White HD. High‐sensitivity troponin level pre‐catheterization predicts adverse cardiovascular outcomes after primary angioplasty for ST‐elevation myocardial infarction. Eur Heart J Acute Cardiovasc Care. 2014;3:118–125. [DOI] [PubMed] [Google Scholar]
- 18. Giannitsis E, Müller‐Bardorff M, Lehrke S, Wiegand U, Tölg R, Weidtmann B, Hartmann F, Richardt G, Katus HA. Admission troponin T level predicts clinical outcomes, TIMI flow, and myocardial tissue perfusion after primary percutaneous intervention for acute ST‐segment elevation myocardial infarction. Circulation. 2001;104:630–635. [DOI] [PubMed] [Google Scholar]
- 19. Björklund E, Lindahl B, Johanson P, Jernberg T, Svensson AM, Venge P, Wallentin L, Dellborg M; ASSENT‐2 and ASSENT‐PLUS Study Groups . Admission troponin T and measurement of ST‐segment resolution at 60 min improve early risk stratification in ST‐elevation myocardial infarction. Eur Heart J. 2004;25:113–120. [DOI] [PubMed] [Google Scholar]
- 20. O'Donoghue ML, Morrow DA, Cannon CP, Jarolim P, Desai NR, Sherwood MW, Murphy SA, Gerszten RE, Sabatine MS. Multimarker risk stratification in patients with acute myocardial infarction. J Am Heart Assoc. 2016;5:e002586 DOI: 10.1161/JAHA.115.002586. [DOI] [PMC free article] [PubMed] [Google Scholar]
- 21. Damman P, Beijk MA, Kuijt WJ, Verouden NJ, van Geloven N, Henriques JP, Baan J, Vis MM, Meuwissen M, van Straalen JP, Fischer J, Koch KT, Piek JJ, Tijssen JG, de Winter RJ. Multiple biomarkers at admission significantly improve the prediction of mortality in patients undergoing primary percutaneous coronary intervention for acute ST‐segment elevation myocardial infarction. J Am Coll Cardiol. 2011;57:29–36. [DOI] [PubMed] [Google Scholar]
- 22. Morrow DA, Antman EM, Charlesworth A, Cairns R, Murphy SA, de Lemos JA, Giugliano RP, McCabe CH, Braunwald E. TIMI risk score for ST‐elevation myocardial infarction: a convenient, bedside, clinical score for risk assessment at presentation: an intravenous nPA for treatment of infarcting myocardium early II trial substudy. Circulation. 2000;102:2031–2037. [DOI] [PubMed] [Google Scholar]
- 23. Halkin A, Singh M, Nikolsky E, Grines CL, Tcheng JE, Garcia E, Cox DA, Turco M, Stuckey TD, Na Y, Lansky AJ, Gersh BJ, O'Neill WW, Mehran R, Stone GW. Prediction of mortality after primary percutaneous coronary intervention for acute myocardial infarction: the CADILLAC risk score. J Am Coll Cardiol. 2005;45:1397–1405. [DOI] [PubMed] [Google Scholar]
- 24. Addala S, Grines CL, Dixon SR, Stone GW, Boura JA, Ochoa AB, Pellizzon G, O'Neill WW, Kahn JK. Predicting mortality in patients with ST‐elevation myocardial infarction treated with primary percutaneous coronary intervention (PAMI risk score). Am J Cardiol. 2004;93:629–632. [DOI] [PubMed] [Google Scholar]
- 25. Granger CB, Goldberg RJ, Dabbous O, Pieper KS, Eagle KA, Cannon CP, Van De Werf F, Avezum A, Goodman SG, Flather MD, Fox KA; Global Registry of Acute Coronary Events Investigators . Predictors of hospital mortality in the global registry of acute coronary events. Arch Intern Med. 2003;163:2345–2353. [DOI] [PubMed] [Google Scholar]