Abstract
Background
Cardiac sodium channel (NaV1.5) dysfunction contributes to arrhythmogenesis during pathophysiological conditions. Nav1.5 localizes to distinct subcellular microdomains within the cardiomyocyte, where it associates with region‐specific proteins, yielding complexes whose function is location specific. We herein investigated sodium channel remodeling within distinct cardiomyocyte microdomains during heart failure.
Methods and Results
Mice were subjected to 6 weeks of transverse aortic constriction (TAC; n=32) to induce heart failure. Sham–operated on mice were used as controls (n=20). TAC led to reduced left ventricular ejection fraction, QRS prolongation, increased heart mass, and upregulation of prohypertrophic genes. Whole‐cell sodium current (INa) density was decreased by 30% in TAC versus sham–operated on cardiomyocytes. On macropatch analysis, INa in TAC cardiomyocytes was reduced by 50% at the lateral membrane (LM) and by 40% at the intercalated disc. Electron microscopy and scanning ion conductance microscopy revealed remodeling of the intercalated disc (replacement of [inter‐]plicate regions by large foldings) and LM (less identifiable T tubules and reduced Z‐groove ratios). Using scanning ion conductance microscopy, cell‐attached recordings in LM subdomains revealed decreased INa and increased late openings specifically at the crest of TAC cardiomyocytes, but not in groove/T tubules. Failing cardiomyocytes displayed a denser, but more stable, microtubule network (demonstrated by increased α‐tubulin and Glu‐tubulin expression). Superresolution microscopy showed reduced average NaV1.5 cluster size at the LM of TAC cells, in line with reduced INa.
Conclusions
Heart failure induces structural remodeling of the intercalated disc, LM, and microtubule network in cardiomyocytes. These adaptations are accompanied by alterations in NaV1.5 clustering and INa within distinct subcellular microdomains of failing cardiomyocytes.
Keywords: heart failure, imaging, microdomains, microscopy, Na+ current, patch‐clamp, sodium channels, subcellular
Subject Categories: Electrophysiology, Basic Science Research, Ion Channels/Membrane Transport, Heart Failure, Remodeling
Clinical Perspective
What Is New?
Heart failure induces ultrastructural changes and sodium current reduction in both the lateral membrane and intercalated disc region of murine cardiomyocytes.
Failing murine cardiomyocytes display unchanged Nav1.5 protein expression, unaltered Nav1.5 cluster density, and smaller Nav1.5 cluster size, accompanied by remodeling of the microtubule network.
Within the lateral membrane of failing murine cardiomyocytes, reduced sodium current and increased late openings are specifically observed at the crest region, but not in the grooves/T‐tubules indicating microdomain‐specific remodeling.
What Are the Clinical Implications?
Differential remodeling of sodium channels within subcellular microdomains of failing cardiomyocytes may have functional consequences for arrhythmogenesis during heart failure.
Unraveling the mechanisms underlying microdomain‐specific remodeling of sodium channels in failing cardiomyocytes may uncover novel therapeutic strategies aimed at preventing arrhythmias and sudden cardiac death.
Cardiac conduction slowing is a major determinant of life‐threatening arrhythmias in patients with heart failure (HF).1, 2, 3 In failing hearts, reduced sodium current (INa) contributes to slowed conduction.4, 5, 6 NaV1.5 is the major pore‐forming protein of the cardiac sodium channel and is responsible for the fast entry of sodium ions into cardiomyocytes, thereby underlying the upstroke of the action potential and mediating cardiac conduction. Recent studies have shown that NaV1.5 proteins cluster together, localize to distinct “pools” within subcellular microdomains of the cardiomyocyte, and associate with region‐specific proteins that regulate their function.7 In the intercalated disc (ID) region, NaV1.5 colocalizes with N‐cadherin, ankyrin G, plakophilin‐2, and synapse‐associated protein 97, whereas NaV1.5‐based channels located at the lateral membrane (LM) of the cardiomyocyte associate primarily with the dystrophin‐syntrophin complex.8, 9 Remodeling of region‐specific proteins may affect NaV1.5 locally and lead to disturbances in INa, conduction abnormalities, and arrhythmias.10, 11, 12, 13
Classically, sodium channels at the ID have been considered the most relevant for conduction, but recent evidence indicates a functional role for the LM sodium channels as well.13 In this region, functional sodium channels are found in the sarcolemmal crest regions, in the membrane invaginations (grooves) and in the T tubules.14 The differential function of these distinct pools of channels has not been clearly elucidated. Moreover, it is as yet unknown how these different pools remodel in the setting of HF and how they each contribute to the overall reduction in INa during this condition. Using high‐resolution functional and imaging techniques, we herein demonstrate NaV1.5 cluster (re‐)organization and microdomain‐specific INa remodeling in failing murine cardiomyocytes.
Methods
Study Approval
Animal experiments were performed in accordance with New York University (New York, NY) guidelines for animal use and care and conformed to the Guide for the Care and Use of Laboratory Animals, published by the US National Institutes of Health (publication 58‐23, revised 1996).
Induction of HF in Mice by Pressure Overload
Male C57/Bl6 mice (Charles River Wilmington, MA, USA; 10–12 weeks old) were anesthetized by isoflurane (mean, 2.5% in oxygen), intubated with a 20 gauge polyethylene catheter, ventilated (Minivent Type 845; Harvard Apparatus, Holliston, MA), and placed on a heating pad to maintain body temperature at 37°C. Buprenorphine (Buprenex; 0.05 mg/kg) was injected SC for postsurgical analgesia. The thoracic cavity was accessed through a small incision at the left upper sternal border in the second intercostal space. A 7‐0 silk suture was passed around the aorta between the right innominate and left common carotid arteries. Constriction of the transverse aorta was performed by tying against a 27‐G needle, which was subsequently removed. The same procedure was followed in sham–operated on (Sham) animals, except for the constriction. A pressure gradient (calculated as the ratio between the maximum blood flow velocity of the right carotid/the left carotid artery) of at least 5 was confirmed 2 days after the procedure using pulsed Doppler measurements (Vevo; FujiFilm VisualSonics Inc, Toronto, Ontario, Canada).
Echocardiographic and Electrocardiographic Measurements in Mice
After 6 weeks of transverse aortic constriction (TAC), mice were anesthetized using isoflurane inhalation (4% for induction, 1%–1.5% in 700 mL O2/minute for maintenance), and echocardiographic measurements were recorded, as previously described.15 In a subset of mice (Sham, n=5; TAC, n=7), this was directly followed by surface ECG recordings. Mice were placed on a heating pad. A standard‐lead ECG was recorded with limb electrodes. ECG traces were signal averaged and analyzed for ECG parameters using LabChart7Pro software (ADInstruments, Sydney, Australia). QRS duration was calculated from lead III, and other parameters were calculated from lead I.
Cell Dissociation
Adult mouse ventricular myocytes were obtained by enzymatic dissociation, following standard procedures. Briefly, after 6 weeks of TAC, mice were injected with 0.1 mL heparin (500 IU/mL IP) 20 minutes before heart excision and anesthetized by carbon dioxide inhalation. Deep anesthesia was confirmed by lack of response to otherwise painful stimuli. Hearts were quickly removed from the chest and placed in a Langendorff column. For cell dissociation, the isolated hearts were perfused sequentially with low calcium and an enzyme (collagenase; Worthington Industries, Columbus, OH) solution. Ventricles were cut into small pieces and gently minced with a Pasteur pipette. Calcium concentration was increased gradually to normal values. Cardiomyocytes were used on the same day of isolation.
Patch‐Clamp Experiments
INa recordings were conducted in either whole cell configuration or the cell‐attached configuration, as described before.9, 16 Pipette resistance was maintained within the range of 1.9 to 2.1 MΩ, to facilitate reproducibility between experiments. Only recordings obtained under seal resistances >2 GΩ were used in this study.
Scanning Ion Conductance Microscopy
Freshly isolated cardiomyocytes were studied by scanning ion conductance microscopy (SICM), a high‐resolution (<20‐nm) technique that allows the 3‐dimensional visualization of the surface of live cells. SICM combines noncontact scanning probe microscopy with a cell‐attached patch clamp, enabling recordings of ion currents at a given location on the LM of cardiomyocytes. After surface scanning, Z‐groove ratios, indicative of completeness of the Z grooves, were calculated as followed: Z‐groove ratio=length of visible Z grooves on a scan/total estimated Z‐groove length as if they were all complete.17 Patch clamping was performed at a chosen location (ie, crest or groove/T tubule). Pipette solution contained (in mmol/L): NaCl 148, NaH2PO4 0.4, MgCl2 1, CdCl2 0.2, KCl 5.4, HEPES 15, CaCl2 1.0, and glucose 5.5, pH 7.4, with NaOH. Cells were maintained in a solution containing the following (in mmol/L): NaH2PO4 0.33, HEPES 5, CaCl2 1.0, and KCl 140, pH 7.4, with KOH, thus depolarizing the membrane potential to a value estimated to be near 0. To assess the presence of fast inward currents, and to define the unitary current‐voltage relation, the membrane under the patch was held at −120 mV and voltage clamp pulses of 1 second were applied every 3 seconds to −30, −40, −50, −60, −70, and −80 mV. The number of channels in a patch (n) was calculated as n=I/(V×g), where g is the single‐channel conductance. Detailed methods were previously described by Bhargava et al.14 Recordings at both locations (ie, crest and groove/T tubule) were also investigated for the presence of late sodium channel openings, which were defined as stochastic events >1 pA occurring between 200 and 1000 ms after the pulse.
Electron Microscopy
Mice were anesthetized and perfused with 0.1 mol/L phosphate buffer containing 2% paraformaldehyde and 2.5% glutaraldehyde and then euthanized by excision of the heart. The perfused heart was cut into 1 mm3 and placed in the same fixative solution at 4°C overnight. After washing with 0.1 mol/L phosphate buffer for 30 minutes at room temperature, the tissue was placed in phosphate buffer containing 2% OsO4/1.5% potassium ferrocyanide for 1 hour at room temperature, washed 3 times for 5 minutes in double‐distilled H2O (ddH2O) at room temperature, and then placed in a filtered solution of 1% thiocarbohydrazide (Electron Microscopy Sciences, Hatfield, PA) in ddH2O for 20 minutes at room temperature to allow for additional osmium staining. The tissue was then washed 3 times in ddH2O and then placed in 2% aqueous OsO4 for 30 minutes at room temperature. Finally, the tissue was washed 3 times in ddH2O and placed in 1% aqueous uranyl acetate at 4°C overnight. The next day, tissue was washed 3 times in ddH2O. En bloc lead staining was performed to enhance membrane contrast.18 A lead aspartate solution was made by dissolving 0.066 g of lead nitrate in 10 mL of 0.003 mol aspartic acid. The pH was adjusted to 5.5 with 1 N KOH, and the solution was placed in a 60°C oven for 30 minutes. The lead aspartate solution was filtered, and the tissue was stained at 60°C for 30 minutes. It was determined that this enhanced osmium staining protocol, combined with en bloc lead staining, was critical for enhancing membrane contrast. The sample was then washed 3 times in ddH2O, dehydrated in a series of ethanol solutions (30%, 50%, 70%, 85%, 95%, 100%, 100%; 10 minutes each, on ice), and then placed in ice‐cold dry acetone for 10 minutes, followed by 10 minutes in acetone at room temperature. The sample was then gradually equilibrated with embedding resin (Durcupan ACM Araldite; Electron Microscopy Sciences) by placing in 25% embedding resin/acetone for 2 hours, 50% embedding resin/acetone for 2 hours, 75% embedding resin/acetone for 2 hours, and 100% embedding resin overnight. The tissue was then embedded in fresh 100% embedding resin and placed in a 60°C oven for 48 hours to allow embedding resin polymerization and complete the embedding procedure. Thin sections (60 nm) were cut and mounted onto 200 mesh copper grids (Electron Microscopy Sciences). Images were acquired using a Philips CM‐12 electron microscope (FEI, Eindhoven, the Netherlands) equipped with a Gatan (4k x2.7k) digital camera (Gatan, Inc, Pleasanton, CA).
Immunocytochemistry
Freshly isolated cardiomyocytes from Sham or TAC mice were plated on laminin‐coated coverslips and left to adhere for at least 30 minutes before fixation (4% formaline). Immunohistochemistry was performed, as previously described, using N‐cadherin (610921; BD Biosciences, San Jose, CA, USA) and Glu‐tubulin (AB3201; Millipore, Burlington, MA, USA) antibodies.19 Cardiomyocytes were imaged using a Leica SP5 confocal microscope. The Glu‐tubulin signal was quantified using ImageJ. Three different cytosolic regions of interest were defined (12‐μm‐diameter regions of interest): 2 close to the ID and 1 in the middle of the cardiomyocyte, always excluding the nuclei. Red‐Green‐Blue images were split into channels, and raw integrated density (sum of pixel values) was measured in the green channel (Glu‐tubulin) only in the regions of interest defined previously.
Superresolution Microscopy
Freshly isolated cardiomyocytes from Sham or TAC mice were plated on laminin‐coated coverslips and left to adhere for at least 30 minutes before fixation (4% formaline). Superresolution microscopy was conducted in a custom‐built system, based on simultaneous 2‐color direct stochastic optical reconstruction microscopy (STORM). Detailed experimental methods are provided in previous publications.19, 20 Cluster analysis was automated for standardization, following criteria detailed by Agullo‐Pascual et al.19 LM cluster analysis was implemented for this study. LM clusters were defined as the clusters localized along the lateral edges of the cardiomyocytes.
Quantitative Polymerase Chain Reaction Assay and Analysis
Total mRNA was isolated from microdissected ventricular tissue from Sham or TAC hearts using an RNeasy Mini Kit (Qiagen, Hilden, Germany). mRNA (250 µg) was used as a template for reverse transcription using the Reverse Transcriptase‐SuperScript II Kit (Invitrogen, Life Technologies, Carlsbad, CA, USA). Real‐time reverse transcription–polymerase chain reaction was performed in a Light Cycler apparatus (Roche, Basel, Switzerland) using SYBR Green and appropriate mouse primers: Nppa_forward, 5′‐CCATATTGGAGCAAATCCTGTGT‐3′; Nppa_reverse, 5′‐TCCTCAGTCTGCTCACTCAG‐3′; Acta1_forward, 5′‐CCATCGGCAATGAGCGTTTC‐3′; Acta1_reverse, 5′‐ACATGACGTTGTTGGCATACAG‐3′; Hprt_forward, 5′‐CTTTCCCTGGTTAAGCAGTACAG‐3′; Hprt_reverse, 5′‐GTCAAGGGCATATCCAACAACAAAC‐3′; Scn5a_forward, 5′‐TTGTCATCCTCTCCATCGTTG‐3′; and Scn5a_reverse, 5′‐AGACGGATGACACGGAAGAG‐3′. The data were analyzed with the LinReg program.21
Protein Isolation and Western Blot
Sham and TAC ventricles were collected and homogenized in ice‐cold radioimmunoprecipitation assay buffer. The tissue lysates were probed by Western blot with NaV1.5 (S0819; Sigma, St. Louis, MO), α‐tubulin (sc‐5286; Santa Cruz Biotechnology, Dallas, TX, USA), End‐binding protein 1 (EB1) (MAPRE1; ab53358; Abcam, Cambridge, UK), connexin 43 (610061; BD Transduction Laboratories, San Jose, CA, USA), calnexin (208880; Calbiochem, Darmstadt, Germany), pan‐cadherin (C3678; Sigma, St Louis, MO, USA), and GAPDH (Fitzgerald Industries International, Acton, MA, USA) antibodies. Western blot band intensity was analyzed using ImageJ software and normalized to loading control.
Statistical Analysis
Data are presented as mean±SEM. Differences between groups were analyzed by unpaired Student t test and nonparametric, parametric, or nested ANOVA, as appropriate. For the STORM data, a Mann‐Whitney test was used to test the difference in NaV1.5 cluster area. The level of statistical significance was set to P<0.05.
Results
Cardiac Failure Phenotype in TAC Mice
Of the 32 animals subjected to TAC (with a Doppler ratio >5), 6 (19%) died suddenly during the 6 weeks after the procedure, whereas none of the Sham mice died (Figure 1A and 1B). Surviving animals had signs of HF, including shortness of breath, a doubling in heart mass, and an increase in lung weight, compared with Sham animals (Figure 1C). Echocardiographic recordings revealed an enlarged left ventricular chamber in TAC mice with a corresponding increase in left ventricular end‐diastolic volume and a decrease in left ventricular ejection fraction to 24±1% in TAC compared with 52±2% in Sham mice (P<0.001) (Figure 1D and 1E). Surface ECG recordings revealed a significantly increased heart rate and prolonged PR, QRS, and corrected QT intervals in TAC versus Sham mice (Table 1). Furthermore, mRNA levels of prohypertrophic genes Nppa and Acta1 were upregulated 7‐ and 4‐fold, respectively, in TAC ventricles compared with Sham (Figure 1F).
Figure 1.
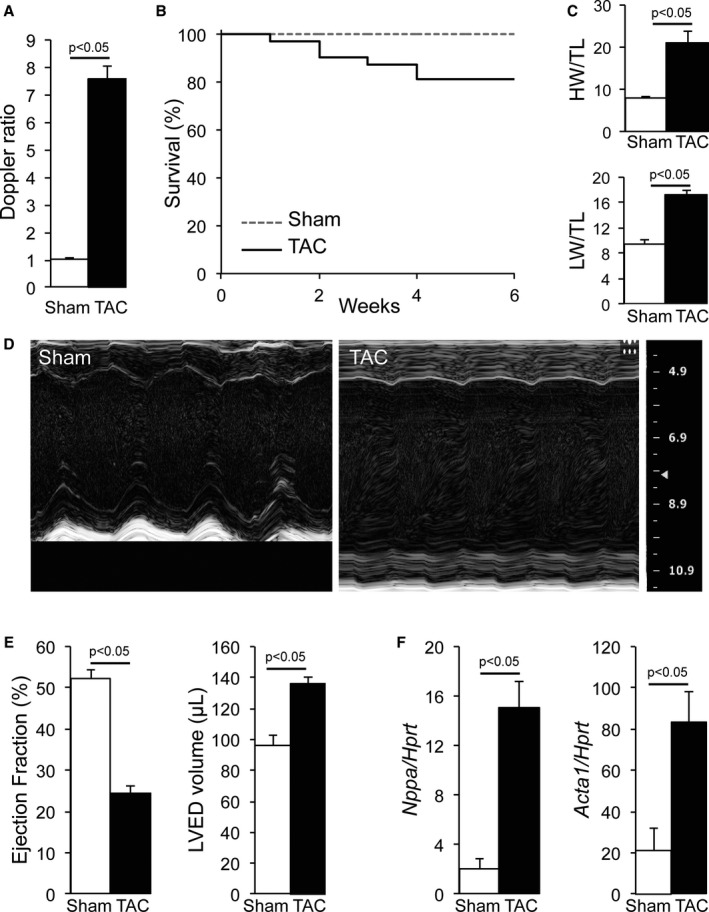
Cardiac failure characterization in transverse aortic constriction (TAC) mice. A, Increased Doppler ratio in TAC mice compared with sham–operated on (Sham) mice. B, Kaplan‐Meier survival curves of Sham and TAC mice. C, Cardiac hypertrophy secondary to TAC demonstrated by increased heart (HW) and lung (LW) weights corrected for tibia length (TL) in TAC mice. D, Typical M‐mode echocardiographic recording in Sham and TAC mice showing decreased contractility and increased wall and chamber sizes in TAC compared with Sham. E, Decreased ejection fraction and increased left ventricular end‐diastolic (LVED) volume in TAC compared with Sham hearts. F, Increased expression of prohypertrophic genes Nppa and Acta1 corrected for Hprt in ventricular tissue of TAC mice compared with Sham.
Table 1.
HR and ECG Indexes (RR, PR, QRS, and QT) Measured on ECGs in Sham and TAC Mice
| Group | HR (bpm) | RR Interval (ms) | PR Interval (ms) | QRS Duration (ms) | QT Interval (ms) |
|---|---|---|---|---|---|
| Sham (N=5) | 431.3±16.2 | 139.9±4.9 | 40.1±0.6 | 9.8±1 | 49.4±2.4 |
| TAC (N=7) | 517.0±10.4a | 116.3±2.3a | 44.7±2.3 | 13.9±0.8a | 61.1±3.1a |
Data are presented as mean±SEM. bpm Indicates beats per minute; HR, heart rate; Sham, sham operated on; and TAC, transverse aortic constriction.
P<0.05 vs Sham.
Decreased INa at the LM and ID of Failing Cardiomyocytes
Increased QRS duration in HF is indicative of ventricular conduction slowing. To investigate potential sodium channel remodeling underlying these conduction abnormalities, we first assessed the effect of TAC on whole cell INa characteristics using conventional patch clamping in isolated ventricular cardiomyocytes. Average whole cell INa amplitude was not different between Sham and TAC myocytes (Figure 2A and 2B, Table 2). However, INa density (current amplitude corrected by cell capacitance) was significantly decreased in failing cardiomyocytes (Figure 2C, Table 2), associated with an increase in cell capacitance in the TAC group (Figure 2D, Table 2). No changes were observed in steady‐state voltage‐dependent activation, inactivation, or recovery from inactivation between the groups (Figure 2E and 2F, Table 2). We next investigated whether the reduced whole‐cell INa originated from the midsection (LM region) and/or the end of the cell (ID region). Consistent with previous findings,9 cell‐attached measurements in Sham cardiomyocytes revealed a lower INa amplitude and a negative shift in steady‐state inactivation in the LM compared with the ID region (Figure 3A and 3B, Figure S1, and Table 2). In TAC cardiomyocytes, INa amplitude was reduced in LM and ID by 50% and 40%, respectively (Figure 3A and 3B, Table 2), without any changes in gating parameters between Sham and TAC (Figure 3C through 3F, Table 2).
Figure 2.
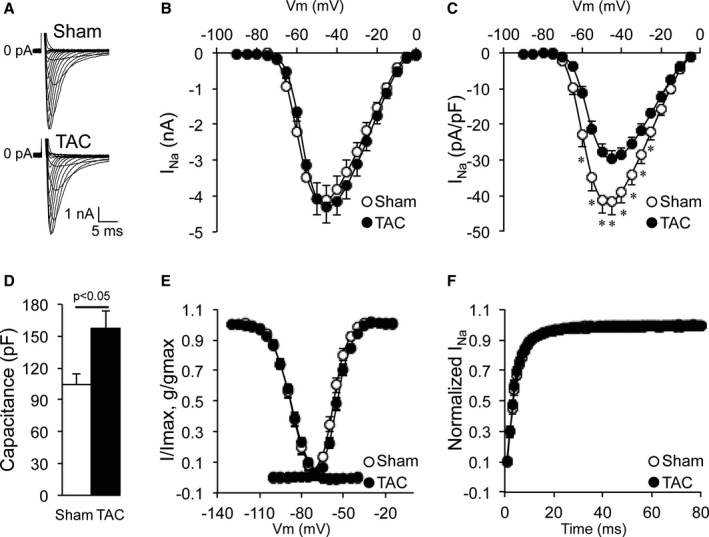
Whole cell current density decreased in transverse aortic constriction (TAC) cardiomyocytes. A, Typical whole cell sodium current (INa) recordings in sham–operated on (Sham) and TAC cardiomyocytes. B, Current (I) to voltage (Vm) relationship of INa showing similar current amplitude in Sham and TAC cardiomyocytes. C, I to Vm relationship of INa showing decreased current density (current amplitude corrected for cell capacitance) in TAC cardiomyocytes compared with Sham cardiomyocytes. D, Increased cell capacitance in TAC cardiomyocytes. E, Identical voltage dependence of inactivation and activation of whole cell sodium currents in Sham and TAC (g: conductance). F, Identical recovery from inactivation in Sham and TAC cardiomyocytes. *P<0.05 Sham vs TAC, nested ANOVA.
Table 2.
Whole Cell and Cell‐Attached INa Characteristics From LM and ID From Sham and TAC Cardiomyocytes
| Group | Capacitance (pF) | INa Peak (nA Whole, pA Attached) | INa Peak (pA/pF) | V1/2 Activation (mV) | V1/2 Inactivation (mV) | Recovery Time Constant (ms) |
|---|---|---|---|---|---|---|
| Sham (N=4, n=12) | 103.9±10.9 | −4.1±0.5 | −41.7±3.6 | −57.7±0.7 | −87.9±1.1 | 4.5±0.3 |
| TAC (N=7, n=14) | 157.5±15.9a | −4.3±0.5 | −29.6±2.1a | −54.2±0.8 | −87.7±0.9 | 4.2±0.3 |
| Cell‐attached LM | ||||||
| Sham (N=4, n=12) | −193.0±19 | −53.5±1.4 | −93.2±0.6b | 10.9±0.5b | ||
| TAC (N=7, n=14) | −95.3±8a | −52.4±1.1 | −93.1±0.7b | 11.0±0.6b | ||
| Cell‐attached ID | ||||||
| Sham (N=4, n=12) | −421.3±52.9 | −55.7±0.9 | −87.4±1.2 | 6.5±0.9 | ||
| TAC (N=4, n=7) | −252.2±2.2a | −53.2±1.1 | −87.7±1.0 | 8.2±0.5 | ||
Data are presented as mean±SEM. ID indicates intercalated disc; INa, sodium current; LM, lateral membrane; N, number of animals; n, number of cardiomyocytes; Sham, sham operated on; TAC, transverse aortic constriction; and V1/2, voltage of half activation or inactivation.
P<0.05 vs Sham.
P<0.005 vs ID.
Figure 3.
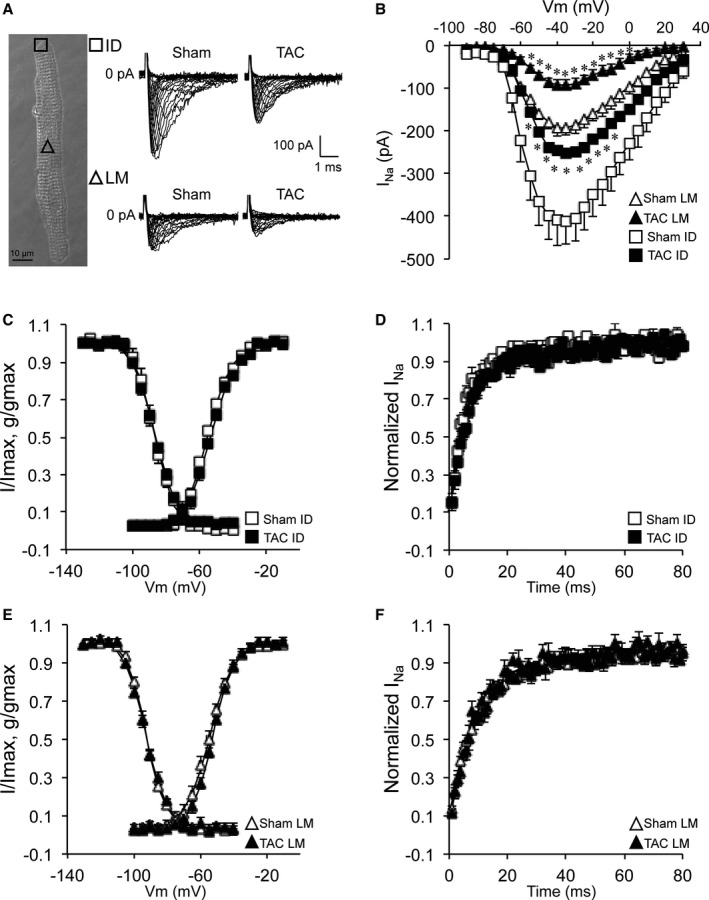
Decreased sodium current (INa) at the intercalated disc (ID) and lateral membrane (LM) of transverse aortic constriction (TAC) cardiomyocytes. A, Bright‐field image of a cardiomyocyte illustrating macropatch recording locations (square at the ID and triangle at the LM; bar=10 μm) and typical macropatch INa recordings in sham–operated on (Sham) and TAC cardiomyocytes at the ID and LM. B, Current (I) to voltage (Vm) relationship of INa showing decreased INa in TAC cardiomyocytes compared with Sham at the LM and ID. C, Identical voltage dependence of activation and inactivation of ID INa in Sham and TAC (g: conductance). D, Identical recovery from inactivation of ID INa in Sham and TAC. E, Identical voltage dependence of activation and inactivation of LM INa in Sham and TAC (g: conductance). F, Identical recovery from inactivation of LM INa in Sham and TAC. *P<0.05 Sham vs TAC, nested ANOVA.
Microdomain‐Specific INa Remodeling Within the LM of Failing Cardiomyocytes
Within the LM, 2 subdomains can be distinguished (ie, sarcolemmal crest regions separated by membrane invaginations [grooves] containing T tubules). We next investigated INa alterations in TAC within these LM subdomains using SICM combined with a cell‐attached patch. This technique allows us to first scan the topology of the cell surface and then to patch with precision the microdomain of interest (crest or groove/T tubule). As previously reported, LMs of Sham myocytes were organized in a succession of crests and grooves with clearly identifiable T‐tubule openings (Figure 4A).22 Crest‐crest distance was ≈2 μm, and the Z‐groove ratio, indicative of the completeness of the groove, was 85% (Figure 4C and 4D). In failing myocytes, the crest‐crest distance was unchanged, but the Z‐groove ratio was decreased to 63%, indicating less complete and less deep Z grooves on the surface of TAC myocytes (Figure 4B through 4D). Moreover, T‐tubule openings were more difficult to identify in failing cardiomyocytes (Figure 4B). Typical examples of cell‐attached patch recordings at the crest and groove/T tubule in Sham and TAC are represented in Figure 5A and 5B. The initial peak is followed by single‐channel events. In both locations, we did not observe differences in single‐channel conductance between Sham and TAC (Figure 5C and 5D). The average number of channels per crest recording was 41.2 in Sham cardiomyocytes, whereas it was only 25.4 in TAC cardiomyocytes. In Sham cardiomyocytes, half of the recordings from the cell crests carried >20 open channels (Figure 5E), whereas a lack of open channels (no current) was seen in only a small proportion (≈4.5%) of recordings. In contrast, a larger fraction of crest recordings from TAC myocytes carried no INa (ie, absence of open channels in ≈35%; P=0.012 versus Sham), with a lower percentage of recordings containing large currents (comprising >50 channels; Sham versus TAC, 23% versus 13%; Figure 5E). In contrast, and consistent with earlier reports,14 within the groove/T‐tubule regions of Sham myocytes, most recordings detected no or only small INa (<5 open channels). Groove/T‐tubule regions contained, on average, 3.8 channels per recording in Sham cardiomyocytes and 3.2 channels per recording in TAC cardiomyocytes. This pattern appeared unchanged in TAC myocytes (Figure 5F). Overall, these results show a remodeling of the LM region of failing cardiomyocytes, where INa is predominantly reduced in sarcolemmal crest regions.
Figure 4.
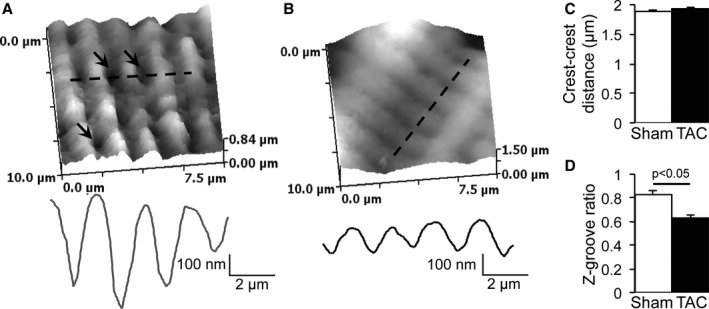
Structural remodeling of the lateral membrane of transverse aortic constriction (TAC) cardiomyocytes. A, Typical scanning ion conductance microscopy (SICM) scan and topology profile along the dashed line of a sham–operated on (Sham) cardiomyocyte lateral membrane (arrows indicate T‐tubule openings). B, Typical SICM scan and topology profile along the dashed line of a TAC cardiomyocyte lateral membrane. C, Unchanged crest‐crest distance between Sham and TAC. D, Decreased Z‐groove ratio in TAC compared with Sham.
Figure 5.
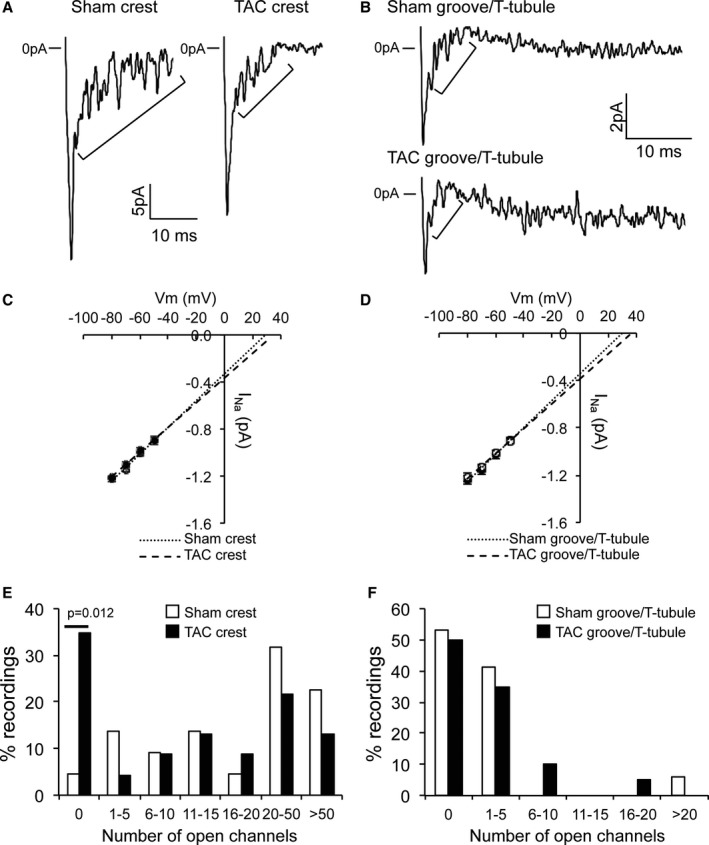
Decreased sodium current (INa) at the crest of transverse aortic constriction (TAC) cardiomyocytes. A, Typical INa recordings at the crest of sham–operated on (Sham) and TAC lateral membrane. Brackets highlight single‐channel events. B, Typical INa recordings in the groove/T tubule of Sham and TAC lateral membrane. Brackets highlight single‐channel events. Please note the scale. C, Identical unitary channel conductance in crest in Sham and TAC. Numbers of events at −50, −60, −70, and −80 mV are for Sham 68, 138, 139, and 85, respectively, and for TAC 29, 58, 87, and 114, respectively. D, Identical unitary channel conductance in groove/T tubule in Sham and TAC. Numbers of events at −50, −60, −70, and −80 mV are for Sham 73, 76, 62, and 72, respectively, and for TAC 66, 67, 58, and 66, respectively. E, Decreased numbers of channels at the crest of TAC cardiomyocytes when compared with TAC (χ2 test, P=0.012 for “0”). F, Identical number of open channels in groove/T tubule in Sham and TAC cardiomyocytes.
Increased Late Sodium Channel Openings at the Crests of Failing Cardiomyocytes
In addition to peak INa alterations, enhanced late INa has also been described in failing cardiomyocytes.23 As an estimate of late INa enhancement within specific microdomains, we assessed the numbers of late sodium channel openings (>200 ms after the pulse, >1 pA stochastic transitions) in the SICM recordings at the LM of Sham and TAC. Figure 6A and 6B show typical recordings illustrating late sodium channel openings in Sham and TAC at the crest and groove/T tubule, respectively. We observed an increased number of late openings at the crest of TAC cardiomyocytes compared with Sham but not in the groove/T‐tubule compartment (Figure 6C and 6D), indicating location‐specific late openings.
Figure 6.
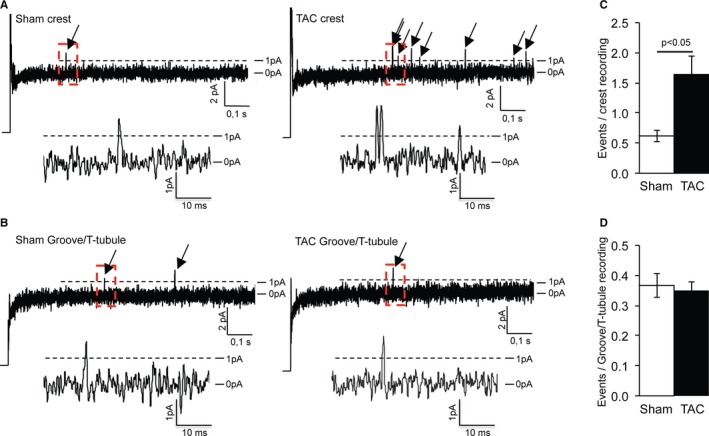
Increased late opening of sodium channels at the crest of transverse aortic constriction (TAC) cardiomyocytes. A, Typical recordings showing late sodium channel openings in sham–operated on (Sham) and TAC crests. Magnification of the rectangular red boxes is shown below. B, Typical recordings showing late sodium channel openings in Sham and TAC groove/T tubule. Magnification of the rectangular red boxes is shown below. C, Increased number of late openings in TAC crest compared with Sham crest. D, Identical number of late openings in Sham and TAC groove/T tubule.
Structural Modifications of the ID in Failing Cardiomyocytes
Proper insertion and function of NaV1.5 requires an intact membrane structure and organization. Hence, during HF, membrane remodeling may contribute to INa reduction within distinct subcellular microdomains. Our SICM measurements demonstrated membrane remodeling at the LM, including reduced depth of the grooves. We next investigated structural alterations of the ID membrane in ventricular tissue using electron microscopy. IDs in Sham tissue featured clear plicate and interplicate regions, whereas the IDs of TAC cardiomyocytes consisted of a succession of large folds (Figure 7A through 7C). The last sarcomere of failing cardiomyocytes flanking the ID was disordered with visible extended filaments (circle; bottom panel in Figure 7B). Vacuoles were clearly identifiable next to the ID membrane in TAC (arrows; Figure 7C). Thus, significant (ultra)structural changes were evident in IDs of failing cardiomyocytes.
Figure 7.
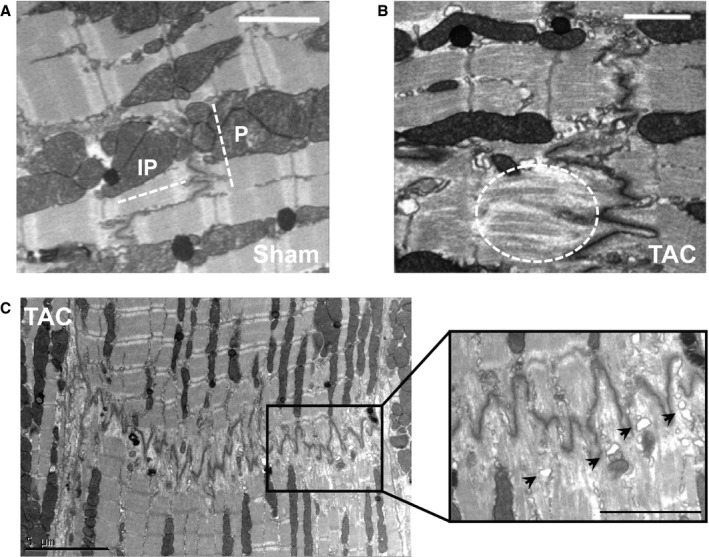
Intercalated disc (ID) structural and molecular alterations in transverse aortic constriction (TAC) cardiomyocytes. A, Electron microscopy image of an ID from a sham–operated on (Sham) cardiomyocyte featuring clear plicate and interplicate structures (bar=2 μm). B, Electron microscopy image of a TAC ID showing large disorganized deflections and extended filaments in the last sarcomere (dashed oval) (bar=2 μm). C, Electron microscopy image of an entire TAC ID with detail (black rectangle) showing large disorganized deflections and identifiable vacuoles (arrows) (bar=5 μm [left], bar=2.5 μm [right]).
Microtubule Network Alterations in Failing Cardiomyocytes
Several mechanisms potentially underlie the observed INa remodeling in the various subcellular microdomains of failing myocytes. NaV1.5 is trafficked to and delivered into the cell membrane by the microtubule network. Specific sites of delivery are determined by macromolecular complexes composed of anchoring and microtubule capture proteins.19, 24 In TAC hearts, increased protein expression levels of the microtubule protein α‐tubulin and plus‐end microtubule capture protein EB1 were observed, indicating a denser microtubule network and a potential increase in microtubule capture sites at the cell membrane (Figure 8A and 8B). Immunoreactive signal intensity for detyrosinated α‐tubulin (Glu‐tubulin) was also significantly increased after TAC (Figure 8C and 8D), confirming increased microtubule density but also indicating a less dynamic microtubule network.25 This denser, yet remodeled, microtubule network suggests altered trafficking and/or delivery of NaV1.5 to the cell membrane of failing cardiomyocytes.
Figure 8.
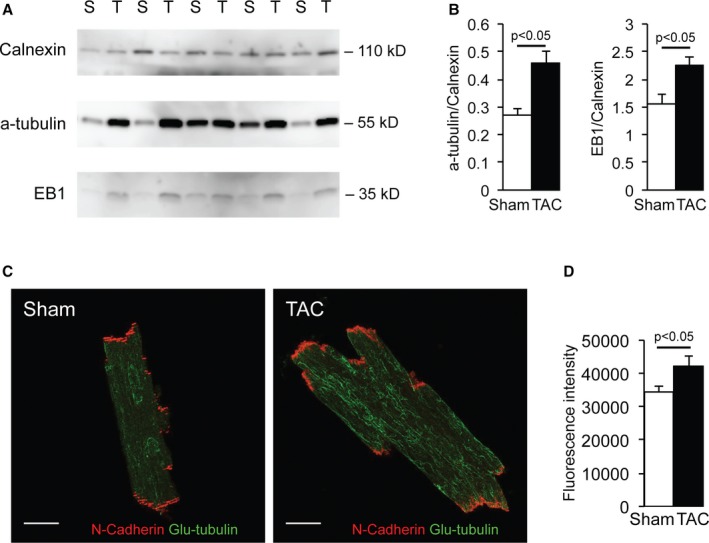
Microtubule remodeling in transverse aortic constriction (TAC) cardiomyocytes. A and B, Increased α‐tubulin and EB1 protein expression corrected for calnexin (loading control) in TAC compared with sham–operated on (Sham) ventricular tissue on Western blot analysis. C and D, Increased Glu‐tubulin expression in TAC compared with Sham cardiomyocytes on immunohistochemistry analysis (bar=20 μm).
Reorganization of NaV1.5 Clusters in Failing Cardiomyocytes
We next sought to define the impact of HF on NaV1.5 distribution and clustering at the membrane. To this end, we used superresolution localization microscopy (STORM) to resolve the molecular organization of NaV1.5 in fixed cardiomyocytes isolated from Sham and TAC ventricles, with a lateral resolution of 20 nm.19, 24 No differences in Scn5a mRNA levels or total NaV1.5 protein levels were observed between Sham and TAC ventricular tissue (Figure 9A through 9C). Figure 9D shows examples of immune‐reactive signals of NaV1.5 and N‐cadherin (marking the ID) detected by STORM in Sham and TAC cardiomyocytes. The N‐cadherin signal on STORM images of TAC cardiomyocytes demonstrated a loss of plicate and interplicate structures compared with Sham myocytes, in accordance with the electron microscopy images of the ID in Figure 7. Given this disorganized pattern, it was not possible to accurately delineate the cell end, thus precluding reliable calculations for NaV1.5 cluster size and density at the ID of TAC myocytes. To measure the area and the density of NaV1.5 clusters at the LM, we traced a 1‐μm‐thick line delineating the LM, perpendicular to the N‐cadherin signal. The line was traced along the green clusters at the cell edge. In total, 289 clusters from 11 images of Sham cardiomyocytes and 272 clusters from 9 images of TAC cardiomyocytes were incorporated in the analysis. The minimum area defined as a cluster was 2400 nm2, and cluster sizes ranged up to 404 400 nm2 in Sham and 230 000 nm2 in TAC myocytes. As shown in Figure 9E, NaV1.5 cluster density at the LM was not significantly different between Sham and TAC. However, NaV1.5 clusters at the LM were significantly smaller in TAC compared with Sham, as indicated by a shift towards smaller clusters in TAC cardiomyocytes (Mann‐Whitney test, P=0.0023; Figure 9F and 9G). Hence, NaV1.5 cluster density at the LM was maintained in failing cardiomyocytes, but at the expense of cluster size.
Figure 9.
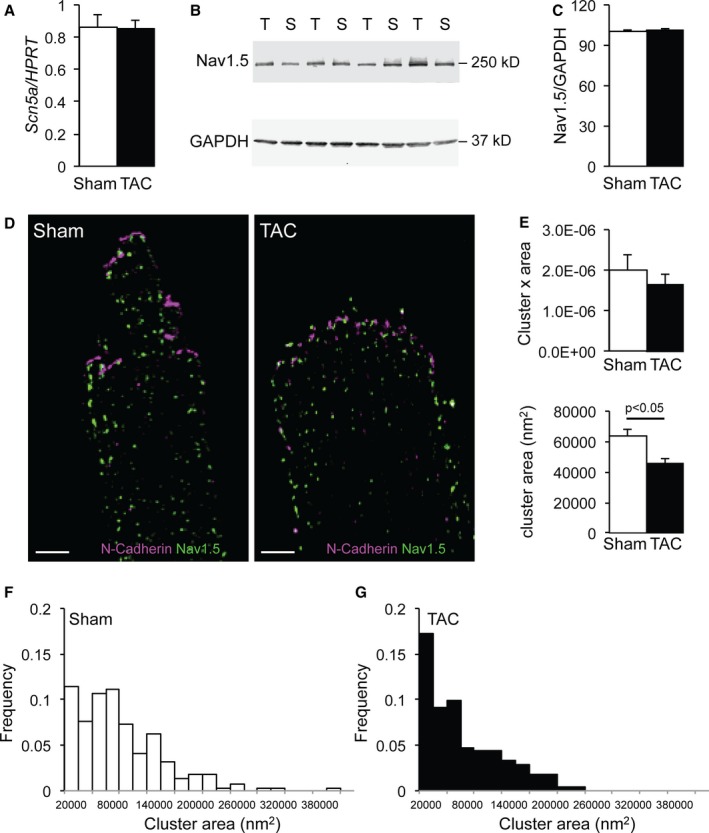
Sodium channel remodeling in transverse aortic constriction (TAC) cardiomyocytes. A, Similar Scn5a mRNA expression corrected for Hprt in sham–operated on (Sham) and TAC ventricular tissue on quantitative polymerase chain reaction analysis. B and C, Similar NaV1.5 protein expression corrected for Gapdh (loading control) in Sham and TAC ventricular tissue on Western blot analysis. D, Typical example of stochastic optical reconstruction microscopy images labeled for NaV1.5 (green) and N‐cadherin (purple) in Sham and TAC cardiomyocytes (bar=5 μm). E, Similar number of NaV1.5 cluster×area at the lateral membrane (LM) in Sham and TAC cardiomyocytes and decreased NaV1.5 cluster size at the LM of TAC compared with Sham cardiomyocytes. F and G, Distribution of NaV1.5 cluster sizes in Sham and TAC.
Discussion
We herein investigated, for the first time, INa remodeling and sodium channel cluster (re‐)organization within different subcellular microdomains of failing cardiomyocytes using nanometer precision techniques. We demonstrate a similar reduction in INa at the LM and ID in the setting of (ultra)structural membrane alterations and remodeling of the microtubular network. Our data furthermore provide insight into subdomain‐specific INa reduction and NaV1.5 cluster remodeling at the LM of failing cardiomyocytes.
Remodeling of INa in HF
INa reduction is well established in HF,4, 5, 6 but the possibility that sodium channel density and/or function is differentially remodeled within the various subcellular compartments (microdomains) of failing cardiomyocytes has not been previously addressed. Sodium channel clusters in various cardiomyocyte microdomains exhibit distinct current amplitudes and gating properties.9 Studies in animal models have shown differential contribution of distinct subcellular sodium channel pools to global conduction in the heart.10, 11, 12 Channels at the ID are considered the most functionally relevant for conduction, and specific reduction of ID INa in plakophilin‐2 and coxsackie and adenovirus receptor‐deficient models has been shown to modulate myocardial electrical properties and arrhythmogenesis.11, 12, 16 However, loss of channels specifically at the LM affects conduction anisotropy through preferential conduction, slowing in the transverse as opposed to longitudinal direction.13 Although these observations indicate a differential functional role for channels within specific microdomains, little is known about how channels in various subdomains are remodeled during pathophysiological conditions. Our current results demonstrate a similar decrease in INa within the ID and LM of failing murine cardiomyocytes. This global INa reduction is in line with previously reported ventricular conduction slowing in both the longitudinal and transversal directions in failing hearts26 and, together with structural remodeling occurring within the failing myocardium, may set the stage for arrhythmogenesis. Remodeling of other ion channels likely also contributes to arrhythmogenesis during HF. Although microdomain‐specific remodeling of L‐type Ca2+ channels has been described in failing cardiomyocytes,27 similar research on potassium channel remodeling remains to be performed.
Sodium Channel Remodeling at the LM of Failing Cardiomyocytes
Using superresolution microscopy, we observed unchanged NaV1.5 cluster density, yet reduced cluster size, at the LM of failing cardiomyocytes. Because smaller NaV1.5 clusters have been linked to reduced functionality, the observed decreased cluster size at the LM of failing myocytes readily explains the reduction in INa measured within this region.28 The reduction in INa amplitude recorded at the LM using the macropatch method was larger than the observed reduction in whole cell current density. This suggests a nonlinear relation between the increase in membrane surface (cell size) and the cluster reorganization at the LM of failing cardiomyocytes. STORM analysis did not allow us to distinguish clusters at the crest from those at the groove/T tubule. Nevertheless, SICM recordings at the LM indicated that INa is primarily decreased at the crests of failing cardiomyocytes and unaffected in the groove/T‐tubule microdomain, indicating microdomain‐specific remodeling secondary to TAC. In addition, there were significantly more recordings carrying no current in TAC, again suggesting the presence of nonfunctional clusters at the LM. In line with other studies demonstrating T‐tubule remodeling in HF, we observed less deep Z grooves in TAC cardiomyocytes in addition to less clearly identifiable T‐tubule openings. Apart from the cardiac sodium channel NaV1.5, neuronal sodium channel isoforms (ie, NaV1.1, NaV1.3, and NaV1.6) are also thought to populate the T tubules.29, 30, 31, 32 Studies on expression and function of neuronal sodium channel isoforms during HF have shown varied results, most likely because of variations in species (rat, rabbit, dog) and HF model (pressure and/or volume overload and embolizations) used, with the most consistent observation comprising an upregulation of NaV1.1.5, 23, 33 However, we observed unaltered INa gating properties at the LM of failing myocytes in addition to unchanged single‐channel conductance in both the crest and groove/T‐tubule microdomains, arguing against a change in neuronal sodium channel function. Thus, the observed reduction in INa at the LM of failing cardiomyocytes is likely predominantly caused by a decrease in NaV1.5‐based channels, in particular those located at the crest. Increased late INa is another key feature of HF and contributes to arrhythmogenesis.23 Interestingly, we observed location‐specific increased late openings of sodium channels at the crest of failing cardiomyocytes but not in the groove/T‐tubule region. Whether this increase represents an arrhythmogenic substrate in the particular conditions of our experiments remains to be determined.
Potential Role for Microtubule Network Remodeling
Similar to natural growth occurring during cardiomyocyte development, growth during cardiac remodeling is achieved by the insertion of sarcomeres flanking the ID.34 Our data show an unchanged crest‐crest distance of ≈2 μm in TAC cardiomyocytes, corresponding to the sarcomere length of quiescent myocytes. Because cell size was increased (increased cell capacitance; Figure 3C), sarcomeres were likely inserted during the development of hypertrophy in TAC hearts, as described previously by Wilson and coworkers in dilated cardiomyopathy.34 Although the number of sarcomeres and cell crests per cell increased, the mRNA and protein expression and density of sodium channel clusters remained unchanged. This indicates that the available NaV1.5 channels have been redistributed along the LM at existing and newly formed crest‐anchoring points, albeit with fewer channels per cluster (as indicated by reduced cluster size and fewer channels within recordings). Some of these smaller clusters may even not be functional at all, because we observed a significant increased number of recordings in TAC myocytes carrying no current. Smaller cluster size, yet unaltered cluster density, in TAC compared with Sham suggests a redirection and redistribution of channels to the newly formed sarcomeres at the LM in TAC cardiomyocytes. Several studies have previously shown that Nav1.5 channels are delivered to their final destination on the membrane through the microtubule network.19, 35 Although microtubule network density was increased in TAC cardiomyocytes, the observed increased detyrosinated tubulin (ie, Glu‐tubulin) levels indicate that the microtubule network is less dynamic25 and, thus, potentially less efficient.36, 37, 38 It is, therefore, reasonable to speculate that the increased Glu‐tubulin observed in our experiments is associated with impaired Nav1.5 delivery at any subcellular location. Moreover, microtubule densification may also have contributed to the observed T‐tubular remodeling in failing cardiomyocytes.39
Remodeling of the ID in Failing Cardiomyocytes
In failing cardiomyocytes, the ID showed overt (ultra)structural remodeling. Electron microscopy images revealed extended membrane folds at the ID of TAC myocytes, in addition to disorganization of the plicate and interplicate regions. These increased interdigitations of the ID membrane likely contributed to an enlarged 3‐dimensional ID surface in failing myocytes34, 40, 41 and an increased spatial complexity of the overall ID area, with membrane foldings tightly packed next to each other. In this complex space, the separation between membrane foldings can be less than the distance that can be resolved using superresolution. For example, 2 clusters on 2 different ID membrane locations could appear as 1 if located within 40 nm of each other, hence impeding a reliable measurement of NaV1.5 cluster size and density quantification. Nevertheless, our observation that INa is reduced at the ID is in line with NaV1.5 cluster remodeling at the ID secondary to (ultra)structural changes and microtubule network alterations, similar to the LM.
EB proteins are known to modulate dynamic transition of the microtubules' plus end (growth and shrinkage).42 The observed higher expression of the microtubule plus end tracking protein EB1 may also constitute a compensatory mechanism to render the plus end of microtubule more dynamic to maintain delivery of NaV1.5 to the membrane. Despite this, some sodium channels may actually not have reached the ID membrane and may not have functionally contributed to INa. Moreover, successful anchoring in the membrane does not necessarily guarantee normal functioning channels, and alterations in NaV1.5 partner proteins, such as connexin 43, may further compromise channel functionality.
Potential Additional Mechanisms Modulating INa in Failing Cardiomyocytes
In addition to membrane and microtubule network remodeling, other events during HF (eg, altered splicing, glycosylation, or changes in neuronal sodium channel composition) may also contribute to INa reduction at the ID and/or LM. Splicing events in HF generate multiple sodium channel protein isoforms, some of which lead to less functional channels and modify the gating properties of the overall INa.43, 44 Glycosylation of the sodium channel is known to modulate INa and its gating properties, and underlies arrhythmogenesis in HF.45, 46 Although such sodium channel alterations could have potentially contributed to the TAC‐induced INa reduction in the various microdomains, the unaltered INa gating properties observed after TAC make this unlikely.
Considerations and Limitations
Although the superresolution microscopy used in this study allowed for localization of fluorescently labeled proteins with a resolution of several nanometers, our ability to assign position and dimensions to clusters in relation to the cell membrane remains limited, particularly when applied as 2‐dimensional optical sections of complex 3‐dimensional objects. Moreover, our findings are limited to the case of pressure overload in mice and are not necessarily generalizable to all cases of HF. HF itself may arise from a large variety of causes, and differences in remodeling mechanisms exist between pressure or volume overload, myocardial infarction, or pacing, which may each contribute differently to sodium channel (dys)function. These mechanisms likely also differ depending on the stage of the disease.47, 48, 49, 50 Hence, although our current observations on INa remodeling are not necessarily applicable to other models or stages of HF, they highlight a potential arrhythmogenic change in the electrophysiological profile of a heart subjected to pressure overload, a common cause of HF.
Conclusion
HF induces structural remodeling of the ID, LM, and microtubule network in ventricular cardiomyocytes. These alterations are accompanied by alterations in NaV1.5 clustering and INa within distinct subcellular microdomains of the failing cardiomyocyte. INa is equally reduced at the ID and LM regions of failing murine cardiomyocytes. In the LM, INa reduction is microdomain specific, with decrease primarily at the crests, associated with a reduction in NaV1.5 cluster size.
Sources of Funding
This work was funded by an Innovational Research Incentives Scheme Vidi grant from ZonMw (grant 91714371 to Remme), by the Dutch Heart Foundation/Cardiovasculair Onderzoek Nederland (project PREDICT, CVON2012‐10, to Bezzina), the Dutch Heart Foundation (NHS2010/B201 to Remme), the American Heart Association (postdoctoral fellowship 15POST25550087 to Agullo‐Pascual), and by the National Institutes of Health (RO1‐GM57691, RO1‐HL134328, and RO1‐HL136179 to Delmar).
Disclosures
None.
Supporting information
Figure S1. Differences voltage dependence of inactivation between LM and ID.
Acknowledgments
We are grateful to A. Shekhar for sharing his expert knowledge on echocardiographic measurements and to L. Beekman for designing the primers for quantitative polymerase chain reaction experiments.
(J Am Heart Assoc. 2017;6:e007622 DOI: 10.1161/JAHA.117.007622.)29222390
Contributor Information
Mario Delmar, Email: mario.delmar@nyumc.org.
Carol Ann Remme, Email: c.a.remme@amc.uva.nl.
References
- 1. Bigger JT. Why patients with congestive heart failure die: arrhythmias and sudden cardiac death. Circulation. 1987;75:IV28–IV35. [PubMed] [Google Scholar]
- 2. Pu J, Boyden PA. Alterations of Na+ currents in myocytes from epicardial border zone of the infarcted heart: a possible ionic mechanism for reduced excitability and postrepolarization refractoriness. Circ Res. 1997;81:110–119. [DOI] [PubMed] [Google Scholar]
- 3. Chan MMY, Lam CSP. How do patients with heart failure with preserved ejection fraction die? Eur J Heart Fail. 2013;15:604–613. [DOI] [PubMed] [Google Scholar]
- 4. Valdivia CR, Chu WW, Pu J, Foell JD, Haworth RA, Wolff MR, Kamp TJ, Makielski JC. Increased late sodium current in myocytes from a canine heart failure model and from failing human heart. J Mol Cell Cardiol. 2005;38:475–483. [DOI] [PubMed] [Google Scholar]
- 5. Xi Y, Wu G, Yang L, Han K, Du Y, Wang T, Lei X, Bai X, Ma A. Increased late sodium currents are related to transcription of neuronal isoforms in a pressure‐overload model. Eur J Heart Fail. 2009;11:749–757. [DOI] [PubMed] [Google Scholar]
- 6. Elshrif MM, Pengcheng S, Cherry EM. Electrophysiological properties under heart failure conditions in a human ventricular cell: a modeling study. Conf Proc IEEE Eng Med Biol Soc. 2014;2014:4324–4329. [DOI] [PubMed] [Google Scholar]
- 7. Abriel H. Cardiac sodium channel Na(v)1.5 and interacting proteins: physiology and pathophysiology. J Mol Cell Cardiol. 2010;48:2–11. [DOI] [PubMed] [Google Scholar]
- 8. Shy D, Gillet L, Abriel H. Cardiac sodium channel NaV1.5 distribution in myocytes via interacting proteins: the multiple pool model. Biochim Biophys Acta. 2013;1833:886–894. [DOI] [PubMed] [Google Scholar]
- 9. Lin X, Liu N, Lu J, Zhang J, Anumonwo JMB, Isom LL, Fishman GI, Delmar M. Subcellular heterogeneity of sodium current properties in adult cardiac ventricular myocytes. Heart Rhythm. 2011;8:1923–1930. [DOI] [PMC free article] [PubMed] [Google Scholar]
- 10. Gavillet B, Rougier J‐S, Domenighetti AA, Behar R, Boixel C, Ruchat P, Lehr H‐A, Pedrazzini T, Abriel H. Cardiac sodium channel Nav1.5 is regulated by a multiprotein complex composed of syntrophins and dystrophin. Circ Res. 2006;99:407–414. [DOI] [PubMed] [Google Scholar]
- 11. Sato PY, Musa H, Coombs W, Guerrero‐Serna G, Patiño GA, Taffet SM, Isom LL, Delmar M. Loss of plakophilin‐2 expression leads to decreased sodium current and slower conduction velocity in cultured cardiac myocytes. Circ Res. 2009;105:523–526. [DOI] [PMC free article] [PubMed] [Google Scholar]
- 12. Marsman RFJ, Bezzina CR, Freiberg F, Verkerk AO, Adriaens ME, Podliesna S, Chen C, Purfürst B, Spallek B, Koopmann TT, Baczko I, Dos Remedios CG, George AL, Bishopric NH, Lodder EM, de Bakker JMT, Fischer R, Coronel R, Wilde AAM, Gotthardt M, Remme CA. Coxsackie and adenovirus receptor is a modifier of cardiac conduction and arrhythmia vulnerability in the setting of myocardial ischemia. J Am Coll Cardiol. 2014;63:549–559. [DOI] [PMC free article] [PubMed] [Google Scholar]
- 13. Shy D, Gillet L, Ogrodnik J, Albesa M, Verkerk AO, Wolswinkel R, Rougier J‐S, Barc J, Essers MC, Syam N, Marsman RF, van Mil AM, Rotman S, Redon R, Bezzina CR, Remme CA, Abriel H. PDZ domain‐binding motif regulates cardiomyocyte compartment‐specific NaV1.5 channel expression and function. Circulation. 2014;130:147–160. [DOI] [PubMed] [Google Scholar]
- 14. Bhargava A, Lin X, Novak P, Mehta K, Korchev Y, Delmar M, Gorelik J. Super‐resolution scanning patch clamp reveals clustering of functional ion channels in adult ventricular myocyte. Circ Res. 2013;112:1112–1120. [DOI] [PMC free article] [PubMed] [Google Scholar]
- 15. Ram R, Mickelsen DM, Theodoropoulos C, Blaxall BC. New approaches in small animal echocardiography: imaging the sounds of silence. Am J Physiol Heart Circ Physiol. 2011;301:H1765–H1780. [DOI] [PMC free article] [PubMed] [Google Scholar]
- 16. Cerrone M, Lin X, Zhang M, Agullo‐Pascual E, Pfenniger A, Chkourko Gusky H, Novelli V, Kim C, Tirasawadichai T, Judge DP, Rothenberg E, Chen H‐SV, Napolitano C, Priori SG, Delmar M. Missense mutations in plakophilin‐2 cause sodium current deficit and associate with a Brugada syndrome phenotype. Circulation. 2014;129:1092–1103. [DOI] [PMC free article] [PubMed] [Google Scholar]
- 17. Gorelik J, Yang LQ, Zhang Y, Lab M, Korchev Y, Harding SE. A novel Z‐groove index characterizing myocardial surface structure. Cardiovasc Res. 2006;72:422–429. [DOI] [PubMed] [Google Scholar]
- 18. Walton J. Lead aspartate, an en bloc contrast stain particularly useful for ultrastructural enzymology. J Histochem Cytochem. 1979;27:1337–1342. [DOI] [PubMed] [Google Scholar]
- 19. Agullo‐Pascual E, Lin X, Leo‐Macias A, Zhang M, Liang F‐X, Li Z, Pfenniger A, Lübkemeier I, Keegan S, Fenyö D, Willecke K, Rothenberg E, Delmar M. Super‐resolution imaging reveals that loss of the C‐terminus of connexin43 limits microtubule plus‐end capture and NaV1.5 localization at the intercalated disc. Cardiovasc Res. 2014;104:371–381. [DOI] [PMC free article] [PubMed] [Google Scholar]
- 20. Agullo‐Pascual E, Reid DA, Keegan S, Sidhu M, Feny D, Rothenberg E, Delmar M. Super‐resolution fluorescence microscopy of the cardiac connexome reveals plakophilin‐2 inside the connexin43 plaque. Cardiovasc Res. 2013;100:231–240. [DOI] [PMC free article] [PubMed] [Google Scholar]
- 21. Ramakers C, Ruijter JM, Deprez RHL, Moorman AFM. Assumption‐free analysis of quantitative real‐time polymerase chain reaction (PCR) data. Neurosci Lett. 2003;339:62–66. [DOI] [PubMed] [Google Scholar]
- 22. Lab MJ, Bhargava A, Wright PT, Gorelik J. The scanning ion conductance microscope for cellular physiology. Am J Physiol Heart Circ Physiol. 2013;304:H1–H11. [DOI] [PubMed] [Google Scholar]
- 23. Toischer K, Hartmann N, Wagner S, Fischer TH, Herting J, Danner BC, Sag CM, Hund TJ, Mohler PJ, Belardinelli L, Hasenfuss G, Maier LS, Sossalla S. Role of late sodium current as a potential arrhythmogenic mechanism in the progression of pressure‐induced heart disease. J Mol Cell Cardiol. 2013;61:111–122. [DOI] [PMC free article] [PubMed] [Google Scholar]
- 24. Tamura N, Draviam VM. Microtubule plus‐ends within a mitotic cell are “moving platforms” with anchoring, signalling and force‐coupling roles. Open Biol. 2012;2:120132. [DOI] [PMC free article] [PubMed] [Google Scholar]
- 25. Kreis TE. Microtubules containing detyrosinated tubulin are less dynamic. EMBO J. 1987;6:2597–2606. [DOI] [PMC free article] [PubMed] [Google Scholar]
- 26. Qu J, Volpicelli FM, Garcia LI, Sandeep N, Zhang J, Márquez‐Rosado L, Lampe PD, Fishman GI. Gap junction remodeling and spironolactone‐dependent reverse remodeling in the hypertrophied heart. Circ Res. 2009;104:365–371. [DOI] [PMC free article] [PubMed] [Google Scholar]
- 27. Sanchez‐Alonso JL, Bhargava A, O'Hara T, Glukhov AV, Schobesberger S, Bhogal N, Sikkel MB, Mansfield C, Korchev YE, Lyon AR, Punjabi PP, Nikolaev VO, Trayanova NA, Gorelik J. Microdomain‐specific modulation of L‐type calcium channels leads to triggered ventricular arrhythmia in heart failure. Circ Res. 2016;119:944–955. [DOI] [PMC free article] [PubMed] [Google Scholar]
- 28. Leo‐Macias A, Agullo‐Pascual E, Sanchez‐Alonso JL, Keegan S, Lin X, Arcos T, Feng‐Xia‐Liang, Korchev YE, Gorelik J, Fenyö D, Rothenberg E, Delmar M. Nanoscale visualization of functional adhesion/excitability nodes at the intercalated disc. Nat Commun. 2016;7:10342. [DOI] [PMC free article] [PubMed] [Google Scholar]
- 29. Malhotra JD, Chen C, Rivolta I, Abriel H, Malhotra R, Mattei LN, Brosius FC, Kass RS, Isom LL. Characterization of sodium channel alpha‐ and beta‐subunits in rat and mouse cardiac myocytes. Circulation. 2001;103:1303–1310. [DOI] [PubMed] [Google Scholar]
- 30. Maier SKG, Westenbroek RE, McCormick KA, Curtis R, Scheuer T, Catterall WA. Distinct subcellular localization of different sodium channel alpha and beta subunits in single ventricular myocytes from mouse heart. Circulation. 2004;109:1421–1427. [DOI] [PubMed] [Google Scholar]
- 31. Duclohier H. Neuronal sodium channels in ventricular heart cells are localized near T‐tubules openings. Biochem Biophys Res Commun. 2005;334:1135–1140. [DOI] [PubMed] [Google Scholar]
- 32. Brette F, Orchard C. T‐tubule function in mammalian cardiac myocytes. Circ Res. 2003;92:1182–1192. [DOI] [PubMed] [Google Scholar]
- 33. Mishra S, Reznikov V, Maltsev VA, Undrovinas NA, Sabbah HN, Undrovinas A. Contribution of sodium channel neuronal isoform Nav1.1 to late sodium current in ventricular myocytes from failing hearts. J Physiol. 2015;593:1409–1427. DOI: 10.1113/jphysiol.2014.278259. [DOI] [PMC free article] [PubMed] [Google Scholar]
- 34. Wilson AJ, Schoenauer R, Ehler E, Agarkova I, Bennett PM. Cardiomyocyte growth and sarcomerogenesis at the intercalated disc. Cell Mol Life Sci. 2014;71:165–181. [DOI] [PMC free article] [PubMed] [Google Scholar]
- 35. Casini S, Tan HL, Demirayak I, Remme CA, Amin AS, Scicluna BP, Chatyan H, Ruijter JM, Bezzina CR, van Ginneken ACG, Veldkamp MW. Tubulin polymerization modifies cardiac sodium channel expression and gating. Cardiovasc Res. 2010;85:691–700. [DOI] [PubMed] [Google Scholar]
- 36. Sato H, Nagai T, Kuppuswamy D, Narishige T, Koide M, Menick DR, Cooper G. Microtubule stabilization in pressure overload cardiac hypertrophy. J Cell Biol. 1997;139:963–973. [DOI] [PMC free article] [PubMed] [Google Scholar]
- 37. Scholz D, Baicu CF, Tuxworth WJ, Xu L, Kasiganesan H, Menick DR, Cooper G. Microtubule‐dependent distribution of mRNA in adult cardiocytes. Am J Physiol Heart Circ Physiol. 2008;294:H1135–H1144. [DOI] [PubMed] [Google Scholar]
- 38. Hein S, Kostin S, Schaper J. mRNA cargo no longer on time. Am J Physiol Heart Circ Physiol. 2008;294:H1130–H1132. [DOI] [PubMed] [Google Scholar]
- 39. Zhang C, Chen B, Guo A, Zhu Y, Miller JD, Gao S, Yuan C, Kutschke W, Zimmerman K, Weiss RM, Wehrens XHT, Hong J, Johnson FL, Santana LF, Anderson ME, Song L‐S. Microtubule‐mediated defects in junctophilin‐2 trafficking contribute to myocyte transverse‐tubule remodeling and Ca2+ handling dysfunction in heart failure. Circulation. 2014;129:1742–1750. [DOI] [PMC free article] [PubMed] [Google Scholar]
- 40. Pinali C, Bennett HJ, Davenport JB, Caldwell JL, Starborg T, Trafford AW, Kitmitto A. Three‐dimensional structure of the intercalated disc reveals plicate domain and gap junction remodeling in heart failure. Biophys J. 2015;108:498–507. [DOI] [PMC free article] [PubMed] [Google Scholar]
- 41. Perriard J‐C, Hirschy A, Ehler E. Dilated cardiomyopathy: a disease of the intercalated disc? Trends Cardiovasc Med. 2003;13:30–38. [DOI] [PubMed] [Google Scholar]
- 42. Zhang R, Alushin GM, Brown A, Nogales E. Mechanistic origin of microtubule dynamic instability and its modulation by EB proteins. Cell. 2015;162:849–859. [DOI] [PMC free article] [PubMed] [Google Scholar]
- 43. Shang LL, Pfahnl AE, Sanyal S, Jiao Z, Allen J, Banach K, Fahrenbach J, Weiss D, Taylor WR, Zafari AM, Dudley SC. Human heart failure is associated with abnormal C‐terminal splicing variants in the cardiac sodium channel. Circ Res. 2007;101:1146–1154. [DOI] [PMC free article] [PubMed] [Google Scholar]
- 44. Wei C, Qiu J, Zhou Y, Xue Y, Hu J, Ouyang K, Banerjee I, Zhang C, Chen B, Li H, Chen J, Song L‐S, Fu X‐D. Repression of the central splicing regulator RBFox2 is functionally linked to pressure overload‐induced heart failure. Cell Rep. 2015;10:1521–1533. [DOI] [PMC free article] [PubMed] [Google Scholar]
- 45. Mercier A, Clément R, Harnois T, Bourmeyster N, Bois P, Chatelier A. Nav1.5 channels can reach the plasma membrane through distinct N‐glycosylation states. Biochim Biophys Acta. 2015;1850:1215–1223. [DOI] [PubMed] [Google Scholar]
- 46. Ufret‐Vincenty CA, Baro DJ, Lederer WJ, Rockman HA, Quinones LE, Santana LF. Role of sodium channel deglycosylation in the genesis of cardiac arrhythmias in heart failure. J Biol Chem. 2001;276:28197–28203. [DOI] [PubMed] [Google Scholar]
- 47. Wang X, Gerdes AM. Chronic pressure overload cardiac hypertrophy and failure in guinea pigs, III: intercalated disc remodeling. J Mol Cell Cardiol. 1999;31:333–343. [DOI] [PubMed] [Google Scholar]
- 48. Haq S, Choukroun G, Lim H, Tymitz KM, del Monte F, Gwathmey J, Grazette L, Michael A, Hajjar R, Force T, Molkentin JD. Differential activation of signal transduction pathways in human hearts with hypertrophy versus advanced heart failure. Circulation. 2001;103:670–677. [DOI] [PubMed] [Google Scholar]
- 49. Kostin S, Dammer S, Hein S, Klovekorn WP, Bauer EP, Schaper J. Connexin 43 expression and distribution in compensated and decompensated cardiac hypertrophy in patients with aortic stenosis. Cardiovasc Res. 2004;62:426–436. [DOI] [PubMed] [Google Scholar]
- 50. Fontes MSC, Raaijmakers AJA, van Doorn T, Kok B, Nieuwenhuis S, van der Nagel R, Vos MA, de Boer TP, van Rijen HVM, Bierhuizen MFA. Changes in Cx43 and NaV1.5 expression precede the occurrence of substantial fibrosis in calcineurin‐induced murine cardiac hypertrophy. PLoS One. 2014;9:e87226. [DOI] [PMC free article] [PubMed] [Google Scholar]
Associated Data
This section collects any data citations, data availability statements, or supplementary materials included in this article.
Supplementary Materials
Figure S1. Differences voltage dependence of inactivation between LM and ID.


