Abstract
Background
Previous reports have proposed that prevention of electrode-endocardial interfacial boiling is the key mechanism by which radiofrequency application using an irrigated electrode yields a larger ablation lesion than a non-irrigated electrode. It has been suggested that maximal myocardial temperature is shifted deep into myocardium during irrigated ablation.
Purpose
To examine the biophysics of irrigated ablation by correlating electrode and myocardial temperatures with ablation circuit impedance and lesion morphology, and to perform a comparison with non-irrigated ablation modes. To assess the influence of irrigant rate, composition, temperature and blood flow velocity.
Methods
Ablation with and without electrode irrigation was performed in vitro utilizing a whole blood-superfused system. Electrode, electrode–endocardial interface, and intramyocardial temperatures were assessed, as were ablation circuit impedance, total delivered energy, and lesion and electrode morphology. Irrigants assessed were room temperature normal saline, iced normal saline, and dextrose. Irrigant flow rates assessed were 20 and 100 cc/min. Blood flow velocities assessed were 0 and 0.26 m/s.
Finite element simulations of myocardial temperature during irrigated ablation were performed to further elucidate irrigation biophysics and provide a more detailed myocardial temperature profile. Two models were constructed, each utilizing a different core assumption regarding the electrode-tissue boundary: 1. electrode temperature measured in vitro; 2. interfacial temperature measured in vitro. Intramyocardial temperatures predicted by each model were correlated with corresponding temperatures measured in vitro.
Results
Ablation during electrode irrigation with normal saline was associated with greater ablation energy deposition and larger lesion dimensions than non-irrigated ablation. The mechanism underlying the larger lesion was delay or inhibition of impedance rise; this was associated with attenuation or prevention of electrode coagulum. Irrigation did not prevent interfacial boiling, which occurred during uninterrupted radio-frequency energy deposition and lesion growth. Irrigation using saline at 100 cc/min was associated with no impedance rise regardless of blood flow velocity, whereas during irrigation at 20 cc/min impedance rise was blood flow rate-dependent. Iced saline produced results equivalent to room temperature saline. Irrigation with dextrose was associated with curtailed energy application and relatively small lesions.
The finite element simulation that used electrode–endocardial interfacial temperature as the core assumption predicted a myocardial temperature profile which correlated significantly better with in vitro than did the simulation which used electrode temperature as the core assumption. Regardless of irrigant and blood flow rates, maximal myocardial temperature was always within 1 mm of the endocardial surface.
Conclusions
Radiofrequency energy application via a saline irrigated electrode resulted in a larger lesion due to attenuation or eradication of electrode coagulum, thus preventing an impedance rise. Irrigation did not prevent interfacial boiling, but boiling did not prevent lesion growth. The site of maximal myocardial temperature during irrigated ablation was relatively superficial, always within 1 mm of the endocardial surface. Irrigation with iced saline was no more effective than with room temperature saline; both were far more effective than dextrose. Higher irrigation rates immunized the electrode from the influence of blood flow. The biophysical effects of blood flow and irrigation were similar.
Keywords: catheter ablation, radio frequency
Previous investigators have documented that radio frequency energy (RF) applied to myocardium via an irrigated electrode yields deeper and more voluminous ablation lesions than with a non-irrigated electrode [1–5]. This is associated with a higher maximum applied RF power, unencumbered by impedance rise. It has been concluded that the mechanism of prevention of impedance rise by electrode irrigation is cooling of the electrode–endocardial interface, preventing boiling [2,5]. It has been suggested that irrigation displaces the maximum temperature point deep (more than 2 mm) into the myocardium [5]. There have been no detailed reports of myocardial temperature profiles during irrigated ablation. Herein, we present the results of an investigation detailing the biophysics of “irrigated” ablation. Both in vitro and finite element modeling techniques were utilized. For the in vitro experiments, we utilized a whole blood superfused system designed to mimic the intra-cardiac environment. Electrode–endocardial interface (interfacial) and intramyocardial (intramural) temperatures were measured and correlated with ablation circuit impedance and lesion/electrode morphology. Continuous echocardiographic monitoring of the interface was also performed and correlated with these findings. Irrigated ablation was compared to non-irrigated ablation modes, including temperature-guided and constant power. The influence of irrigation variables, including fluid (irrigant) composition, temperature and flow rate, as well as blood flow velocity were examined. Finite element simulation of myocardial temperature during irrigated ablation was performed to extend the in vitro data and provide a more detailed myocardial temperature profile.
Methods
I. In Vitro
Ablation Electrode
The electrode was 2.3 mm in diameter and 5 mm in length incorporating a thermocouple located 2.5 mm from the distal end of the electrode, which provided a measurement accuracy of ±2°C (Biosense Webster, Inc., Diamond Bar, CA, USA). The internal design of the electrode permitted the irrigant to travel through a center lumen and exit via each of 6 irrigation holes, each with a diameter of 0.4 mm located radially around the electrode 1 mm from the distal tip (“showerhead” design). The rate of electrode irrigation was regulated by a programmable motorized pump (Masterflex®, Cole Parmer Inc., Vernon Hills, Ill., USA), which delivered the irrigant at a constant volume (cc/min). Two irrigation rates were assessed: 20 and 100 cc/min. At an irrigation rate of 20 cc/min, the maximum irrigant flow velocity (measured using Doppler echocardiography at the electrode surface) was 0.44 m/s. At an irrigation rate of 100 cc/min, the maximum velocity was 2.2 m/s.
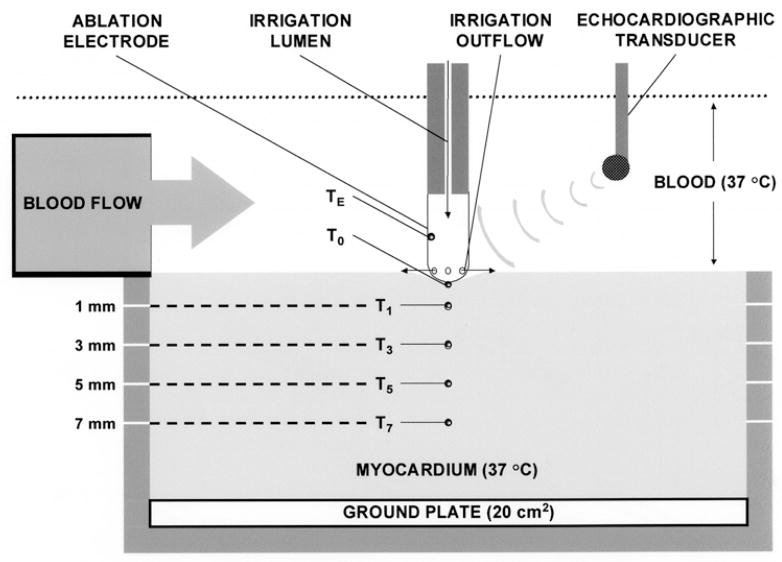
Ablation System (Fig. 1)
Fig. 1.
Schematic of in vitro ablation system.
This protocol was approved by the Institutional Animal Care and Use Committee of the Allegheny University of the Health Sciences, and was in compliance with the Guide for Care and Use of Laboratory Animals published by the National Institutes of Health, publication number 78–83. Bovine myocardium from freshly killed animals was mounted on an isolated ground plate at the base of a tank circulating bovine heparinized whole blood (10–12 liters) at 37°C. Thermocouples (T-type; 0.3 mm diameter; measurement accuracy ±2°C; Omega Engineering Inc., Stamford, CT, USA) were inserted at depths of 0 (electrode–endocardial interface; T0), 1 (T1), 3 (T3), 5 (T5) and 7 (T7) mm. Each thermocouple was electrically insulated and aligned so that its leads were perpendicular to the applied RF field so as to minimize non-thermal artifacts and prevent fluctuations of averaged temperatures >0.5°C root-mean-square. The electrode was mounted on a force-transducer (AccuForce, Acme Scale Inc., San Leandro, CA, USA) and locked into position such that it was aligned perpendicular to the tissue, directly above the thermocouples. Approximately 20% of the electrode surface area was in contact with endocardium: this required slight variations in the applied force (approximately 0.1 Newton). Blood flow was directed to the electrode–endocardial interface using a pulsatile flow pump (Masterflex, Cole Parmer Inc., Vernon Hills, Ill., USA) with a pulse rate of 60/min. When activated, the pump delivered blood so as to achieve a peak velocity of 0.26 m/s and a mean velocity of 0.20 m/s at the electrode–endocardial interface on the side of the electrode adjacent to the blood flow source. This is consistent with velocities commonly measured along the endocardial surface in man [6]. When the pump was inactivated, interfacial flow velocity was negligible. The interface was imaged using a multiplane transesophageal echocardiographic probe mounted into the tank (ATL, Bothell, WA, USA). Two-dimensional imaging was performed at a frequency of 5 MHz. A time calibration was employed to permit synchronization of echocardiography and temperature/impedance measurements. Radiofrequency energy was applied continuously in unipolar fashion between the ablation electrode and the ground plate utilizing a commercial generator (EP Technologies, Sunny-vale, CA, USA) operating at approximately 550 KHz. During each RF application, power, voltage, current, ablation circuit impedance and electrode/myocardial temperatures were measured continuously with sampling at 200 Hz using a commercial data acquisition system (Superscope II, GW Instruments Inc, Somerville, MA, USA). Data were digitized and stored.
Lesion/Electrode Morphology
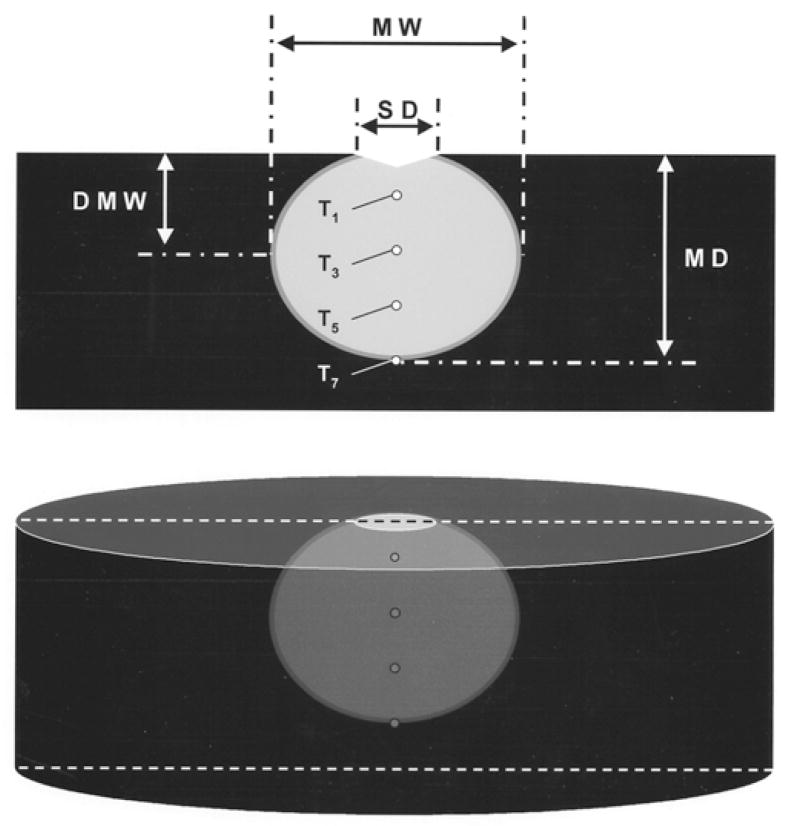
After each RF application, the electrode was examined for coagulum [2,4,5,7]. The endocardial surface was inspected for disruption (“cratering”) [2,4,5,7,8] and coagulum. The myocardium was then sectioned coronally and stained with 1% triphenyl tetrazolium chloride. This dye stains intra-cellular dehydrogenase, which distinguishes viable and necrotic tissue. Necrosis was observed when myocardial temperature exceeded 55°C for at least 10 seconds. The following lesion dimensions were measured using a caliper: maximum depth, maximum width, endocardial surface diameter, and depth at maximum width (Fig. 2). Lesion volume was calculated by assuming the lesion shape was an oblate ellipsoid and subtracting the estimated volume extending above the surface of the tissue [5].
Fig. 2.
Schematic of ablation lesion, depicted as the light area with viable myocardium dark. MW = maximum width; SD = surface diameter; DMW = depth at which lesion width was maximal; MD = maximal depth.
Experimental Protocol
Several different experimental groups were established (Table 1). In Groups 1 and 2, the electrode was not irrigated and RF power titration was guided by interfacial temperature. In Groups 3 and 4, the electrode was not irrigated and RF power was fixed at 50 watts. In groups 5 through 10, the electrode was irrigated and RF power was fixed at 50 watts. In each group, RF was applied for 60 seconds unless interrupted by a significant rise in ablation circuit impedance, defined as ≥10 ohms.
Table 1.
Experimental groups
| Group | 1 | 2 | 3 | 4 | 5 | 6 | 7 | 8 | 9 | 10 |
|---|---|---|---|---|---|---|---|---|---|---|
| Number of trials (n) | 6 | 6 | 5 | 6 | 6 | 6 | 6 | 6 | 6 | 5 |
| T0 target (°C) | 80 | 80 | – | – | – | – | – | – | – | – |
| Irrigant type | – | – | – | – | RTNS | RTNS | RTNS | RTNS | INS | DEX |
| Irrigation rate (cc/min) | – | – | – | – | 20 | 20 | 100 | 100 | 20 | 20 |
| Blood flow velocity (m/s) | 0 | 0.26 | 0 | 0.26 | 0 | 0.26 | 0 | 0.26 | 0 | 0 |
| Delivered power (Watts) | 10.6 ± 1.0 | 16.3 ± 1.4 | 50 | 50 | 50 | 50 | 50 | 50 | 50 | 50 |
T0 = electrode–endocardial interfacial temperature; RTNS = room temperature normal saline; INS = iced normal saline; DEX = dextrose.
Analytical Methods
Data are expressed as mean ± standard deviation, unless otherwise specified. The biophysical parameters (power, impedance, current, voltage), temperatures, and lesion dimensions were compared within/betw-between groups using chi-square or student’s t-test. Any significant differences were further evaluated using Scheffe’s method for pairwise comparisons. A P value of < 0.05 was considered statistically significant.
The rate of myocardial heating was estimated by fitting a given temperature–time profile to the following 1-exponential function: T(t) = TSS + (TINITIAL − TSS) · exp(−t/τ), where TSS was the steady-state temperature, TINITIAL was the baseline temperature before RF application, and τ was the exponential time-constant; (TSS − TINITIAL)/τ represented the linear component of the 1-exponential fit or the initial rate of heating (8; °C/s).
II. Finite Element Modeling
Modeling Methodology
Finite element models (FEM) designed to mimic each of the in vitro experimental groups were constructed utilizing a commercial software program (COSMOS®, Structural Research and Analysis Inc., Los Angeles, CA, USA) [9]. Assumptions utilized for electrical and thermal material properties of the ablation electrode, irrigant, myocardium and blood have been validated and reported previously [9,10]. The model was designed to predict myocardial temperature distributions utilizing a two step approach. In step 1, the distribution of electric currents produced by application of RF at a fixed power was determined by solving Laplace’s equation. Heat deposition via a resistive mechanism was then calculated from the predicted current distribution. In step 2, the temperature distribution within the myocardium was calculated by solving the bioheat transfer equation using the finite element method. For these calculations the myocardium and blood temperatures were initially assumed to be 37°C. Myocardial cooling due to blood flow and irrigation was modeled by imposing a convective boundary condition along the electrode-tissue (blood, endocardium) surface. Each model was constructed to report the temperature profile predicted to occur at the mean duration of RF application observed during ablation in the corresponding in vitro experimental group. Two finite element simulations were conducted:
FEM 1: for this simulation, electrode temperature was held fixed at the maximum TE which had been measured in vitro.
FEM 2: for this simulation, electrode temperature was held fixed at the maximum T0 which had been measured in vitro.
Analytical Methods
The consistency of the relationship between myocardial temperatures generated by the FEM simulation and those measured in vitro was assessed using a weighted chi-square method. The reported value represents the “goodness of fit” between these data sets:
where n = number of trials, SD = standard deviation of in vitro data, FEM = data from finite element simulation, and data = data measured in vitro. Therefore, a lower chi-square value denotes a better fit. Differences between chi-square values were assessed for statistical significance using a variance ratio test. Significance was defined as a P value < 0.05.
Results
During RF applications in each of the variable power, T0-guided groups (Groups 1 and 2), T0 was significantly greater than all intramural T (Fig. 3; Table 2). There were no significant differences between the groups in the initial rates of heating, intramural T or lesion dimensions (Tables 2, 3). In both groups, TE was significantly lower than T0; the magnitude of the difference was significantly greater in Group 2 than in Group 1. Impedance rise was not observed, nor was endocardial coagulum or disruption, electrode coagulum, or echocardiographic bubbling. In both groups, the maximal lesion width was at the endocardial surface. The chi-square value for FEM 2 was significantly lower than for FEM 1 for Group 1; for Group 2 the comparison had borderline significance (Fig. 4).
Fig. 3.
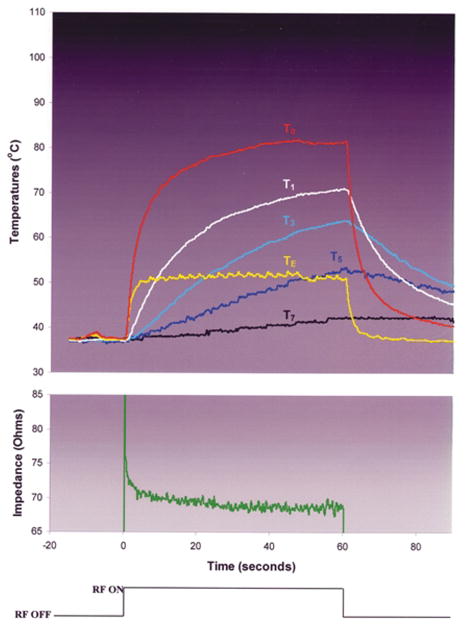
Typical trial from experimental Group 2: no irrigation, blood flow velocity = 0.26 m/s, RF titrated to achieve T0 = 80°C.
Table 2.
Temperature and rate of heating data
| Group | 1 | 2 | 3 | 4 | 5 | 6 | 7 | 8 | 9 | 10 |
|---|---|---|---|---|---|---|---|---|---|---|
| TE | 73 ± 2 | 53 ± 2 | 114 ± 7 | 103 ± 6 | 71 ± 5 | 49 ± 2 | 48 ± 2 | 45 ± 4 | 78 ± 7 | 101 ± 13 |
| kE | 7.9 ± 1 | 12 ± 3 | 32 ± 2 | 25 ± 3 | 29 ± 1 | 22 ± 2 | 20 ± 3 | 18 ± 7 | 27 ± 4 | 32 ± 2 |
| T0 | 81 ± 1 | 81 ± 1 | 114 ± 3 | 121 ± 5 | 98 ± 7 | 100 ± 2 | 100 ± 4 | 101 ± 10 | 94 ± 12 | 102 ± 8 |
| k0 | 8.2 ± 1 | 11 ± 2 | 30 ± 2 | 33 ± 6 | 31 ± 3 | 34 ± 3 | 26 ± 7 | 26 ± 3 | 19 ± 2 | 28 ± 4 |
| T1 | 67 ± 4 | 69 ± 3 | 65 ± 12 | 77 ± 11 | 98 ± 6 | 99 ± 6 | 98 ± 4 | 94 ± 4 | 98 ± 2 | 98 ± 2 |
| k1 | 2.3 ± 0.5 | 1.9 ± 0.4 | 7.4 ± 2 | 8.4 ± 2 | 6.5 ± 3 | 9.9 ± 4 | 7.3 ± 3 | 7.6 ± 2 | 8.5 ± 2 | 11 ± 1 |
| T3 | 57 ± 6 | 61 ± 3 | 46 ± 3 | 57 ± 7 | 85 ± 11 | 92 ± 3 | 92 ± 4 | 90 ± 6 | 88 ± 5 | 72 ± 7 |
| k3 | 1.1 ± 0.5 | 0.84 ± 0.2 | 2.9 ± 1 | 2.5 ± 1 | 2.2 ± 1 | 3.2 ± 1 | 3.3 ± 1 | 2.7 ± 0.6 | 3.0 ± 0.8 | 3.6 ± 0.5 |
| T5 | 50 ± 4 | 51 ± 3 | 39 ± 1 | 47 ± 3 | 73 ± 12 | 81 ± 5 | 80 ± 3 | 76 ± 9 | 70 ± 6 | 52 ± 3 |
| k5 | 0.31 ± 0.1 | 0.35 ± 0.04 | 1.3 ± 1 | 1.2 ± 0.5 | 1.3 ± 0.6 | 1.4 ± 0.4 | 1.1 ± 0.2 | 1.2 ± 0.4 | 1.0 ± 0.2 | 1.5 ± 0.4 |
| T7 | 40 ± 2 | 40 ± 2 | 38 ± 1 | 39 ± 3 | 54 ± 11 | 67 ± 6 | 62 ± 6 | 62 ± 5 | 56 ± 6 | 46 ± 3 |
| k7 | 0.15 ± 0.05 | 0.13 ± 0.03 | 0.0 ± 0.0 | 0.0 ± 0.0 | 0.49 ± 0.2 | 0.69 ± 0.1 | 0.61 ± 0.2 | 0.58 ± 0.1 | 0.64 ± 0.1 | 0.84 ± 0.2 |
Maximum electrode (E), interface (0), and intramural (1, 3, 5, and 7 mm depth) temperatures (T) and initial rates of heating (8), separated by experimental groups (columns). Shaded columns refer to groups with blood flow velocity = 0.26 m/s. Multiple statistical comparisons were performed within and between groups (see text).
Table 3.
Biophysical data
| Group | 1 | 2 | 3 | 4 | 5 | 6 | 7 | 8 | 9 | 10 |
|---|---|---|---|---|---|---|---|---|---|---|
| Baseline impedance (Ω) | 78 ± 3 | 78 ± 2 | 83 ± 4 | 80 ± 3 | 84 ± 7 | 81 ± 1 | 88 ± 8 | 78 ± 2 | 69 ± 3 | 82 ± 1 |
| Mean voltage (V) | 27 ± 1 | 34 ± 2 | 65 ± 8 | 58 ± 1 | 60 ± 5 | 58 ± 1 | 58 ± 1 | 59 ± 1 | 56 ± 3 | 63 ± 1 |
| Mean current (A) | 0.4 ± 0.007 | 0.5 ± 0.007 | 1.0 ± 0.03 | 0.9 ± 0.003 | 0.9 ± 0.02 | 0.9 ± 0.003 | 0.9 ± 0.003 | 0.9 ± 0.003 | 1.0 ± 0.03 | 0.9 ± 0.02 |
| RF duration (s) | 60 ± 0 | 60 ± 0 | 7 ± 5 | 15 ± 2 | 49 ± 12 | 60 ± 0 | 60 ± 0 | 60 ± 0 | 50 ± 10 | 16 ± 3 |
| Total delivered energy (J) | 600 ± 58 | 941 ± 77 | 345 ± 105 | 746 ± 123 | 2473 ± 585 | 3000 ± 0 | 3000 ± 0 | 3000 ± 0 | 2485 ± 503 | 810 ± 160 |
| Audible pop (n) | 0 | 0 | 4 | 6 | 6 | 6 | 6 | 6 | 6 | 5 |
| Significant (>10 Ω) impedance rise (n) | 0 | 0 | 5 | 6 | 6 | 0 | 0 | 0 | 6 | 5 |
| Echocardiographic explosion (n) | 0 | 0 | 5 | 6 | 6 | 6 | 6 | 6 | 6 | 5 |
| Electrode coagulum (n) | 0 | 0 | 5 | 6 | 6 | 0 | 0 | 0 | 6 | 5 |
| Endocardial coagulum (n) | 0 | 0 | 3 | 6 | 4 | 6 | 6 | 3 | 4 | 5 |
| Endocardial disruption (n) | 0 | 0 | 0 | 0 | 1 | 0 | 0 | 3 | 3 | 1 |
| Lesion depth (mm) | 3.9 ± 0.2 | 4.1 ± 0.2 | 2.6 ± 0.2 | 4.2 ± 0.3 | 7.0 ± 1.3 | 7.6 ± 0.8 | 7.3 ± 0.5 | 8.0 ± 0.6 | 6.8 ± 0.9 | 4.4 ± 0.4 |
| Lesion width (mm) | 6.5 ± 0.4 | 6.0 ± 0.0 | 6.8 ± 0.8 | 9.0 ± 0.0 | 10 ± 0.0 | 10 ± 0.0 | 11 ± 0.0 | 11 ± 0.0 | 10 ± 1 | 8.5 ± 0.5 |
| Depth at max width (mm) | 0.0 ± 0.0 | 0.1 ± 0.2 | 0.0 ± 0.0 | 0.8 ± 0.3 | 2.4 ± 1.5 | 2.8 ± 0.4 | 3.1 ± 0.5 | 2.8 ± 0.4 | 2.6 ± 0.5 | 1.3 ± 0.3 |
| Surface diameter (mm) | 5.5 ± 0.4 | 5.1 ± 0.2 | 5.8 ± 0.8 | 6.1 ± 0.9 | 5.6 ± 1.7 | 6.8 ± 1.3 | 4.5 ± 0.6 | 5.4 ± 0.7 | 6.5 ± 0.9 | 5.6 ± 0.7 |
| Lesion volume (mm3) | 75 ± 12 | 65 ± 0.5 | 54 ± 14 | 141 ± 11 | 251 ± 10 | 263 ± 36 | 298 ± 28 | 355 ± 49 | 273 ± 115 | 122 ± 31 |
Shaded columns refer to groups with blood flow velocity = 0.26 m/s.
Fig. 4.
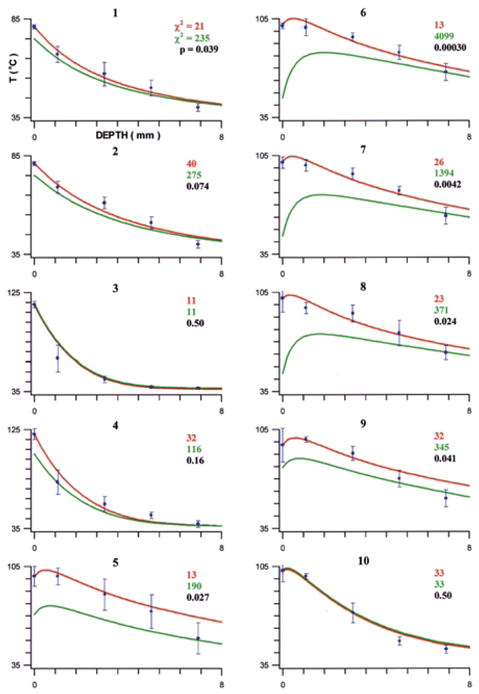
Finite element simulation results, separated by experimental group (labeled on top of each graph): FEM 2 (assuming T0 predicts intramyocardial temperatures) in red; FEM 1 (assuming TE predicts intramyocardial temperatures) in green. The data points (mean temperature) with error bars (standard deviation) represent in vitro data. The chi-square value, quantifying the agreement between FEM and in vitro data, is shown in the corresponding color. A variance ratio test was performed between the chi-square values of FEM 1 and FEM 2; the resulting P value indicates whether FEM 2 agreed with the in vitro data significantly better than FEM 1.
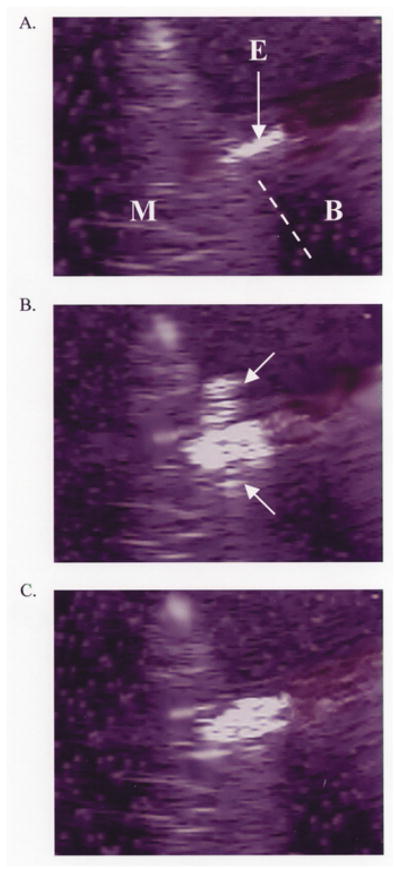
During RF applications in each of the fixed-power, non-irrigated groups (Groups 3 and 4), T0 rapidly approached 100°C, paralleled by TE (Fig. 5). In Group 3, as both temperatures approached 100°C, two echocardiographic observations were made consistently: 1. the apparent electrode diameter increased abruptly; 2. there was the sudden appearance of bubbles emanating from the interfacial region, associated with an audible “pop” and the initiation of a marked impedance rise, eliciting RF shutoff (Fig. 6). In Group 4, the sudden appearance of bubbles occurred as in Group 3, but there was a slower increase in the apparent electrode diameter. This was associated with a slower initial rate of heating at TE, delay in the timing of impedance rise, permitting greater total energy deposition, intramural temperatures, and lesion dimensions. The initial rates of heating at T0 were not significantly different between Groups 3 and 4. Electrode and endocardial coagulum were observed consistently. The maximal lesion width was at or near the endocardial surface. The chi-square values for FEM 1 and FEM 2 were not significantly different in either group (Fig. 4).
Fig. 5.
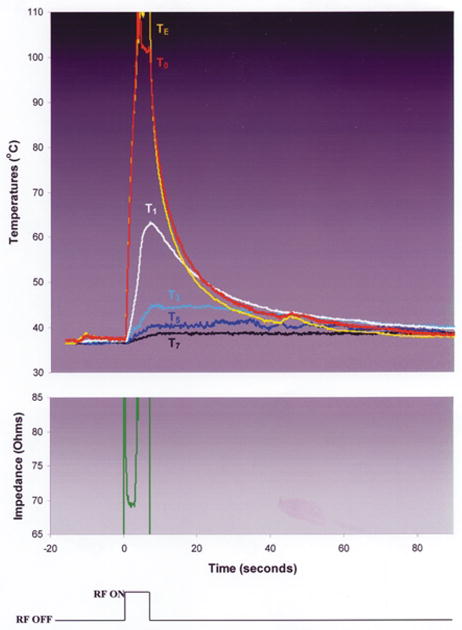
Typical trial from experimental Group 3: no irrigation, no blood flow, RF power was fixed at 50 Watts.
Fig. 6.
A. Echocardiographic image prior to initiation of RF application demonstrating myocardium (M), superfusing blood (B), and ablation electrode (E). The dotted line demarcates a portion of the electrode–endocardial interface. Scale is 1 centimeter. B. Echocardiographic image during RF application, at the moment of interfacial bubbling. The interfacial bubbles are difficult to appreciate in a static image, except that they are echodense. A “plume” of bubbles (arrows) can be seen escaping to either side of the electrode–endocardial interface. Scale is 1 centimeter. C. Echocardiographic image after RF application, after resolution of all bubbling. A significant widening of the electrode was observed. Scale is 1 centimeter.
During RF application in each of the 20 cc/min room temperature saline irrigated groups (Groups 5 and 6), T0 rapidly approached 100°C. In Group 5, the initial rate of heating at TE was similar to that at T0, but the maximum temperature was significantly lower than T0. In Group 6, the initial rate of heating and maximum temperature at TE were significantly lower than those at T0 (Fig. 7). For both groups, as T0 neared 100°C, there was the sudden appearance of echocardiographic bubbles without a significant change in the electrode diameter. This was associated with an audible pop and the initiation of an impedance rise which was not significant (<10 ohms) and which therefore did not elicit RF shutoff. Continued RF application was associated with progressive increase in intramural temperatures. In some trials, during continued RF application there was a second sudden increase in bubble density at the interface, usually associated with another audible pop. In each case, this was correlated with intramural temperature reaching 100°C. In Group 5, a gradual, significant increase in the apparent electrode diameter was observed in all trials. In concert with this, the impedance gradually rose. In 3 of 6 experiments, it eventually exceeded 10 ohms, eliciting premature RF shutoff. In Group 6, there was no significant change in the apparent electrode diameter throughout the RF application period. Impedance was stable after the early minor rise and RF was delivered for the planned duration in all experiments. Delay or elimination of a significant impedance rise in Groups 5 and 6 permitted greater total RF energy delivery than in Groups 3 and 4, which was associated with higher intramural temperatures and deeper and more voluminous lesions. Endocardial coagulum was observed after most applications. Electrode coagulum was observed consistently in Group 5 but never in Group 6. The depth at which lesion width was maximal was significantly greater in Groups 5 and 6 than in Groups 3 and 4. For both Groups 5 and 6, the chi-square value for FEM 2 was significantly lower than for FEM 1.
Fig. 7.
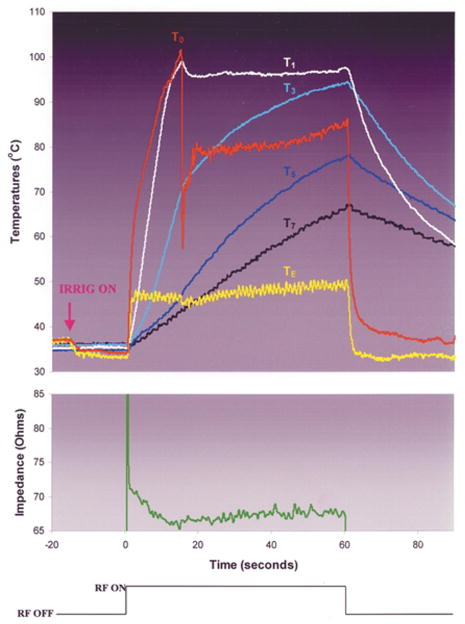
Typical trial from experimental Group 6: irrigation with room temperature normal saline at 20 cc/min, blood flow velocity = 0.26 m/s, RF power was fixed at 50 Watts. Note that T0 rises rapidly to boiling, at which point it abruptly deflects downward. This deflection was coincident with the sudden elaboration of echocardiographic bubbles at the electrode–endocardial interface and an audible “pop.” Trials stopped at this instant (data not shown) showed displacement of the interface thermocouple to a site adjacent to the interface. After a few seconds, T0 resumes its rise, but at a much slower rate. Note that at the moment that the downward deflection in T0 occurs, despite continued (constant) power application there is also a downward deflection in TE, and an insignificant (<10 ohm) rise in circuit impedance. We hypothesize that the drop in TE was due to temporary displacement of the electrode from endocardial contact by the elaboration of bubbles, increasing its exposure to blood cooling.
During RF application in each of the 100 cc/min room temperature saline irrigated groups (Groups 7 and 8), T0 rapidly approached 100°C; the initial rate of heating at TE was similar, but the maximum temperature was significantly lower than that at T0. As T0 neared 100°, the same echocardiographic observations and impedance pattern as described in Group 6 ensued. No significant impedance rise was observed. Endocardial coagulum was observed in all Group 7 trials and in half of Group 8 trials. Electrode coagulum was not observed in either group. Lesion depths and volumes were significantly greater than in Groups 3 o r 4, and lesion widths and volumes were significantly greater than in Groups 5 and 6. For both groups, the chi-square value for FEM 2 was significantly lower than for FEM 1.
During RF application in the 20 cc/min iced saline irrigated group (Group 9), T0 rapidly approached 100°C; the initial rate of heating at TE was greater than that at T0, but the maximum temperature was significantly lower. As T0 neared 100°C, the same echocardiographic observations and impedance pattern as described in Group 5 ensued. In all trials, RF duration was curtailed because of impedance rise. Lesion dimensions were similar to those in Group 5. The chi-square for FEM 2 was significantly lower than for FEM 1.
During RF application in the 20 cc/min room temperature dextrose irrigated group (Group 10), T0 rapidly approached 100°C, paralleled by TE. The same echocardiographic observations and impedance pattern as described for Group 4 ensued. Electrode and endocardial coagulum were observed consistently. Lesion dimensions were not significantly different from Group 4. The chi-square values for FEM 1 and FEM 2 were not significantly different in Group 10.
Discussion
How Does Saline Irrigation Produce a Bigger Lesion?
In the present study, a key finding was that saline irrigated RF applications resulted in larger lesions by delaying or eliminating impedance rise despite electrode–endocardial interfacial boiling, which was evidenced by direct measurement of temperature, intra-ablation echocardiographic bubbling, and post-ablation endocardial coagulum. RF application uninterrupted by interfacial boiling was associated with higher intramural temperatures and deeper and more voluminous lesions. Electrode coagulum was consistently associated with impedance rise; irrigation eliminated o r delayed its formation.
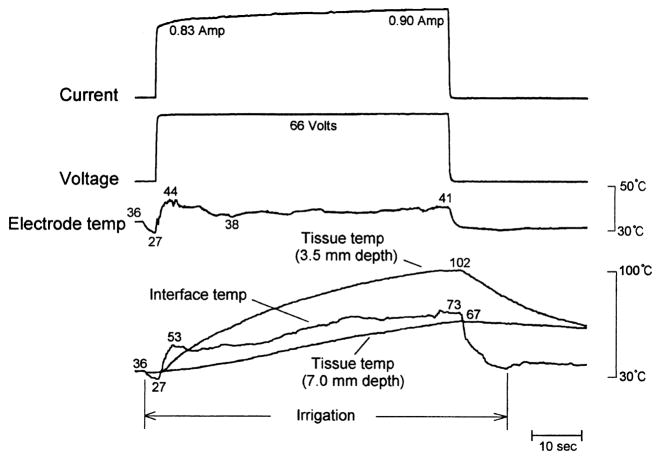
Previous reports in vitro and in vivo have demonstrated larger lesions using saline irrigated versus non-irrigated ablation electrodes, associated as in the present study with n o or delayed impedance rise, higher RF energy deposition, and attenuation or elimination of electrode coagulum [1–5]. In all but two reports [5,11], it was assumed that impedance rise was prevented by inhibition of electrode–endocardial interfacial boiling, but myocardial temperature measurement was either not performed or was performed at a distance from the interface. Wong et al [11] utilized an ablation electrode which had an internal irrigation design. Temperatures were measured at the interface and at depths of 1 and 2 mm. During irrigation with room temperature saline at 30 cc/min, RF application at a fixed power of only 20 watts resulted in maximum temperature at the interface. No boiling or impedance rises were observed. I n regard to tissue temperature profile, these data are consistent with the data reported herein. Nakagawa et al [5], utilizing a canine thigh muscle preparation, employed the same electrode, irrigant, and irrigation rate as in the present study. A constant RF voltage of 66 volts (approximately 50 watts) was applied in unipolar fashion. With the possible exception of blood flow velocity and volume (not reported by the investigators), these variables are very similar to our Group 6. Intramyocardial temperatures were measured only at depths of 3.5 and 7.0 mm. In a subset of applications, temperature was measured at the electrode-thigh muscle interface. No echocardiographic imaging was performed. Maximum electrode temperature (38.4 ± 5.1°C) was significantly lower than in Group 6 (49 ± 2°C), but the magnitude of the difference was small. The intramural temperatures were very similar. However, in marked contrast to our findings, the peak interfacial temperature was approximately 69°C, and did not approach 100°C during any application. No information on endocardial coagulum was reported. Based on these data, the authors concluded that prevention of interfacial boiling was a key mechanism by which irrigation permitted increased RF energy deposition, and deeper and more voluminous lesions. The discrepancy in measured interfacial temperature is obviously crucial, and we cannot offer a definitive explanation. The difference in electrode temperature, also difficult to explain, may have played a role, but we expect that if so it was very small and does not explain the marked difference in interfacial temperatures. Nakagawa et al demonstrated the time–temperature relationship during an irrigated ablation trial, during which a sudden drop in interfacial temperature after an early rapid rise is apparent (Fig. 8). We observed a similar phenomenon in some trials (Fig. 7), but always as the interface temperature was approaching 100°C. The phenomenon was due to physical displacement of the interface thermocouple by the sudden release of gas bubbles. Once displaced, the interface thermocouple reported temperature near the interface, which was considerably lower than peak interfacial temperature. This phenomenon was also observed in another in vitro study [4]. It is possible, therefore, that the interfacial temperature values reported in Nakagawa et al were spuriously low.
Fig. 8.
Figure 10 from Nakagawa et al [5] demonstrating an irrigated RF application using parameters almost identical to those used in Figure 7 (Group 6). Note that, despite continued (constant) RF application, there are sudden downward deflections in both “interface temp” and electrode temp (arrow), followed by a more gradual rise. The electrode temperature pattern is virtually identical to that in Figure 7. The interfacial temperature pattern is similar in pattern to but different in scale from that in Figure 7. No impedance tracing was supplied with this figure. Reproduced with permission.
Insights from Finite Element Model Simulations
FEM has been validated in previous reports to estimate intramyocardial temperature distributions [9,10]. In the present study, FEM was used to gain further insight into the intramyocardial heating profile. For each group, we compared the temperatures measured in vitro with FEM simulations performed utilizing one of two different assumptions: 1. the electrode temperature predicts intramyocardial temperatures (FEM 1); 2. the electrode–endocardial interfacial temperature predicts intramyocardial temperatures (FEM 2). For most of the experimental groups, the intramural temperatures simulated with FEM 1 correlated poorly with the measured in vitro temperatures (Fig. 4). A markedly improved agreement was observed using simulations based on the interfacial temperature. In all saline irrigated groups, the chi-square value for FEM 2 was significantly lower than for FEM 1; in most of the remaining groups, there was no significant difference between the values. We conclude from these findings that, at least in the saline irrigation groups, internal electrode temperature markedly underestimated outer electrode surface (at the endocardial interface) temperature. We speculate that the reason for this was cooling of the electrode mass by flow, exposing temperature heterogeneity in various regions of the electrode. We and others have previously characterized this phenomenon [12–14].
Given the limited spatial resolution of tissue thermometry, precise information regarding sites of temperature maxima and gradients could not be culled from in vitro measurements. The FEM simulations provided far better spatial resolution. Based on FEM, and as previously reported: 1. during RF applications using non-irrigated electrodes the site of maximum temperature was the electrode–endocardial interface; 2. during RF applications using a saline irrigated electrode the site of maximum temperature was not the interface. However, for all irrigated modes, this site was within 1 mm of the interface (Fig. 4). This data varies with the assumptions of previous investigators. For example, Nakagawa et al estimated that the maximal temperature was located “several millimeters” beneath the interface [5]. However, these investigators actually measured intramural temperature only at depths of 3.5 and 7 mm.
FEM also provided insights regarding intramural temperature gradients during RF applications. During variable power, interfacial temperature-guided, non-irrigated ablation (Groups 1 and 2), the mean gradient at a depth of 0–4 mm was 12°C/mm (no difference between groups). During fixed power, non-irrigated ablation (Groups 3 and 4), a larger gradient (49°C/mm) was observed (no difference between groups). During saline irrigated ablation (Groups 5–9), a gradient (8°C/mm) smaller than Groups 1–4 was observed (no differences among Groups 5–9). Despite the equivalent RF duration for Groups 1, 2 and 5–9, the smaller gradient in the latter group was due to the greater cumulative energy deposition, yielding higher and more uniform temperatures. Despite the equivalence in RF power between Groups 3, 4 and 5–9, the larger gradient in the former group was due to the curtailed RF duration, markedly limiting cumulative energy deposition.
Influence of Irrigant Flow Rate, Temperature, and Composition
We evaluated the influence of irrigant flow rate in the absence of blood flow, utilizing saline irrigation at 20 cc/min (Group 5) and 100 cc/min (Group 7). As expected, the higher irrigation rate was associated with a significantly lower electrode temperature and initial rate of electrode heating. However, maximum interfacial temperatures and initial rates of interfacial heating were not significantly different. The elimination of electrode coagulum and impedance rise in Group 7 was associated with a longer RF duration, greater cumulative energy deposition, higher intramural temperatures, and larger lesion widths and volumes relative to Group 5.
We evaluated the influence of irrigant temperature in the absence of blood flow, utilizing room temperature (Group 5) and iced (Group 9) saline. There were no significant differences in the incidence of electrode coagulum or impedance rise, intramural temperatures or lesion dimensions. Maximal interfacial temperatures were not significantly different, but the initial rate of interfacial heating was markedly lower in Group 9. The latter observation suggests that there was superior interfacial cooling by iced saline irrigation but that the magnitude of the effect was relatively small.
We evaluated the influence of irrigant composition in the absence of blood flow, utilizing 0.9% saline (Group 5) and dextrose (Group 10). In Group 10, impedance rise severely curtailed RF duration, which was associated with lower intramural temperatures and smaller lesions relative to Group 5. Electrode temperature was significantly higher in Group 10. The behavior of this group was very similar to Group 4. We hypothesize that dextrose, a non-conductive fluid, acted as an electrical insulator. By diminishing conductivity at the electrode–blood interface, it effectively diminished the electrode surface area, resulting in a high electrode temperature and coagulum formation. Consistent with this, Shake et al reported a direct relationship between lesion dimensions and irrigant electrolyte concentration [15].
Influence of Blood Flow Velocity
At saline irrigation rates of 20 cc/min (Groups 5 and 6) and 100 cc/min (Groups 7 and 8), we evaluated the influence of blood flow velocity. During irrigation at 20 cc/min, the introduction of blood flow was associated with lower electrode temperature, lower initial rate of electrode heating, eradication of electrode coagulum, longer RF duration, greater total delivered energy and higher intramural temperatures. The data from Groups 6 and 7 are very similar, suggesting that blood flow and irrigation have the same biophysical effect. In contrast, during irrigation at 100 cc/min, the introduction of blood flow had little effect on biophysical parameters, intramural temperatures, or lesion dimensions. We hypothesize that, at this rate of irrigation, blood was effectively excluded from the electrode, rendering it without influence on events occurring at the electrode surface.
Lesion Morphology
Consistent with previous reports, we observed that the maximum width of an irrigated lesion was well beneath the endocardial surface (Table 3) [2–5]. This was in contrast to non-irrigated ablation, in which the maximum width was at or very close to the endocardial surface. Displacement of maximum lesion depth during irrigated ablation has been used as evidence that the maximum intramural temperature is similarly displaced, which we have demonstrated not to be the case. The depth at which lesion width is maximal is not simply a manifestation of the heating pattern directly below the electrode. Radial myocardial temperature is the result of competition between thermal conduction and convection. Despite the high temperatures which we have demonstrated at the electrode–endocardial interface, it is likely that there was a rapid radial decline in temperature. This may have been exaggerated for the showerhead irrigation electrode design tested herein, given that the main direction of irrigant flow was radial to the electrode [16]. Low surface temperature would act as a heat sink, preventing radial myocardium at and adjacent to the endocardial surface from reaching ablative temperature. Deeper regions would be relatively resistant to this effect.
As in other reports, we observed the phenomenon of endocardial disruption (“lesion cratering”) in several of the irrigated lesions [2–4]. This phenomenon has also been used as evidence that the maximum intramural temperature is displaced deep into myocardium. In the present study, cratering was seen after trials during which intramural temperature reached 100°C, associated with a second sudden increase in echocardiographic bubble density at the electrode–endocardial interface and a second audible pop. The endocardial aspect of the lesion demonstrated a small tear, presumably the area where steam was suddenly released from a site of subendocardial accumulation. Note that despite multiple trials with identical RF parameters, cratering was not seen consistently. Even though intramural temperatures commonly approached the boiling point, if the second sudden increase in echocardiographic bubble density at the electrode–endocardial interface was not observed then cratering was not observed. The variability in the incidence of lesion cratering could have been due to small differences in electrode–endocardial contact, the rate of intramural temperature rise, and/or in the arrangement of the myocytes and connective tissue in the heating zone.
Echocardiographic Observations
This is the first report in which measured electrode and myocardial temperatures, impedance and echocardiographic observations have been synchronized. Two main echocardiographic observations were made which increased insight into the biophysics of irrigated ablation. First, we demonstrated the phenomenon of interfacial gas bubble liberation during RF application. As the electrode–endocardial interface approached boiling, bubbles were observed emanating rapidly from the interface into the surrounding blood. This was associated with the initial audible pop and a small (<10 ohm) rise in impedance. Second, in some trials we observed an increase in the echocardiographic image of the electrode diameter during RF application, which was correlated with electrode coagulum. During lesions which involved the formation of electrode coagulum, bubbles were observed to be trapped at the electrode surface. A marked impedance rise occurred only when bubble trapping was observed. We hypothesize that gas liberated in the absence of electrode coagulum transiently encountered the electrode surface, whereas gas liberated in the presence of coagulum had a sustained presence at the electrode surface. Gas would function as an electrical insulator, precipitating impedance rise.
Limitations
Our data have several limitations. First, we utilized an in vitro system in which the targeted myocardium was not perfused. Previous studies have demonstrated significant changes in myocardial properties soon after excision without perfusion [17]. Similarly, the ex vivo whole blood may have had properties, including rheologic and biophysical, which might be substantially different in vivo. Second, our observations may be specific to the RF power, duration and irrigation rates utilized herein. Third, we evaluated only one manner of stable electrode–endocardial angulation and contact, utilizing smooth endocardium. Finally, only one irrigation electrode design (showerhead) was tested in this study. It is conceivable that other designs may produce disparate results. However, the same in vitro observations as in this study were also reported for two other electrode designs in another study [18].
Clinical Implications
Assuming appropriate titration of voltage, RF application via an irrigated electrode has clearly been demonstrated to produce lesions having greater depth and volume than those resulting from RF application via non-irrigated electrodes. This has, in part, led to its use in targeting entities such as ventricular tachycardia occurring in the setting of chronic myocardial infarction [19]. Our data suggest that irrigation might also be useful for ablation of relatively superficial targets, such as smooth atrium. Advantages of irrigated ablation which might have clinical utility for such a target would include prevention of coagulum and minimization of endocardial lesion dimensions. We have presented supportive data in a preliminary form [20,21].
Acknowledgments
Supported in part by a grant from Biosense Webster, Inc., Diamond Bar, CA
The authors gratefully acknowledge the support and assistance of Dr. Stephen M. Dillon, John J. Michele, and Dr. James P. Dilger.
Footnotes
Data presented in part at the 18th annual scientific sessions of the North American Society of Pacing and Electrophysiology, New Orleans, LA, 1997
References
- 1.Mittleman RS, Huang SKS, DeGuzman WT, Cuenoud H, Wagshal AB, Pires LA. Use of the saline infusion electrode catheter for improved energy delivery and increased lesion size in radiofrequency catheter ablation. Pacing Clin Electrophysiol. 1995;18:1022–1027. doi: 10.1111/j.1540-8159.1995.tb04743.x. [DOI] [PubMed] [Google Scholar]
- 2.Skrumeda LL, Mehra R. Comparison of standard and irrigated radiofrequency ablation in the canine ventricle. J Cardiovasc Electrophysiol. 1998;9:1196–1205. doi: 10.1111/j.1540-8167.1998.tb00092.x. [DOI] [PubMed] [Google Scholar]
- 3.Ruffy R, Imran MA, Santel DJ, Wharton JM. Radio-frequency delivery through a cooled catheter tip allows the creation of larger endomyocardial lesions in the ovine heart. J Cardiovasc Electrophysiol. 1995;6:1089–1096. doi: 10.1111/j.1540-8167.1995.tb00386.x. [DOI] [PubMed] [Google Scholar]
- 4.Peterson HH, Chen X, Pietersen A, Svendsen JH, Haunso S. Tissue temperatures and lesion size during irrigated tip catheter radiofrequency ablation. Pacing Clin Electrophysiol. 2000;23:8–17. doi: 10.1111/j.1540-8159.2000.tb00644.x. [DOI] [PubMed] [Google Scholar]
- 5.Nakagawa H, Yamanashi WS, Pitha JV, Arruda M, Wang X, Ohtomo K, Beckman KJ, McClelland JH, Lazzara R, Jackman WM. Comparison of in vivo tissue temperature profile and lesion geometry for radiofrequency ablation with a saline-irrigated electrode versus temperature control in a canine thigh muscle preparation. Circulation. 1995;91:2264–2273. doi: 10.1161/01.cir.91.8.2264. [DOI] [PubMed] [Google Scholar]
- 6.Ren J-F, Schwartzman D, Michele JJ, Li KS, Hoffman J, Brode SE, Lighty GW, Jr, Dillon SM, Chaudhry FA. Lower frequency (5 MHz) intracardiac echocardiography in a large swine model: imaging views and research applications. Ultrasound Med Biol. 1997;23(6):871–877. doi: 10.1016/s0301-5629(97)00045-8. [DOI] [PubMed] [Google Scholar]
- 7.Petersen HH, Chen X, Pietersen A, Svendsen JH, Haunso S. Temperature-controlled irrigated tip radio-frequency catheter ablation. J Cardiovasc Electrophysiol. 1998;9:409–414. doi: 10.1111/j.1540-8167.1998.tb00928.x. [DOI] [PubMed] [Google Scholar]
- 8.Eick OJ, Gerritse B, Schumacher B. Popping phenomena in temperature-controlled radiofrequency ablation. Pacing Clin Electrophysiol. 2000;23:253–258. doi: 10.1111/j.1540-8159.2000.tb00807.x. [DOI] [PubMed] [Google Scholar]
- 9.Labonte S. Numerical model for radiofrequency ablation of the endocardium and its experimental validation. IEEE Trans Biomed Eng. 1994;41:108–115. doi: 10.1109/10.284921. [DOI] [PubMed] [Google Scholar]
- 10.Panescu D, Whayne JG, Fleischman SD, Mirotznik MS, Swanson DK, Webster JG. Three-dimensional finite element analysis of current density and temperature distributions during radiofrequency ablation. IEEE Trans Biomed Eng. 1995;42:879–890. doi: 10.1109/10.412649. [DOI] [PubMed] [Google Scholar]
- 11.Wong WS, VanderBrink BA, Riley RE, et al. Effect of saline irrigation flow rate on temperature profile during cooled radiofrequency ablation. J Intervent Cardiac Electrophysiol. 2000;4:321–326. [PubMed] [Google Scholar]
- 12.Mirotznik MS, Schwartzman D. Inhomogenous heating patterns of commercial electrodes for radiofrequency catheter ablation. J Cardiovasc Electrophysiol. 1996;7:1058–1062. doi: 10.1111/j.1540-8167.1996.tb00481.x. [DOI] [PubMed] [Google Scholar]
- 13.Smith S, Demazumder D, Mannino SF, Dillon SM, Marchlinski FE, Schwartzman D. Thermometry-guided ablation using commercial systems. J Am Coll Cardiol. 1996;27(2):123A. [Google Scholar]
- 14.McRury ID, Panescu D, Mitchell MA, Haines DE. Nonuniform heating during radiofrequency catheter ablation with long electrodes: monitoring the edge effect. Circulation. 1997;96:4057–4064. doi: 10.1161/01.cir.96.11.4057. [DOI] [PubMed] [Google Scholar]
- 15.Shake JG, Larson DW, Salerno CT, Bianco RW, Bolman RM., III The role of electrolyte in lesion size using an irrigated radio frequency electrode. J Invest Surg. 1997;10:339–348. doi: 10.3109/08941939709099597. [DOI] [PubMed] [Google Scholar]
- 16.Demazumder D, Kallash H, Schwartzman D. Comparison of different electrodes for radiofrequency ablation of myocardium using saline irrigation. Pacing Clin Electrophysiol. 1997;20(4):1076. [Google Scholar]
- 17.Schwartzman D, Chang I, Michele JJ, Mirotznik MS, Foster KR. Electrical impedance properties of normal and chronically infarcted left ventricular myocardium. J Intervent Cardiac Electrophysiol. 1999;3(3):213–224. doi: 10.1023/a:1009887306055. [DOI] [PubMed] [Google Scholar]
- 18.Demazumder D, Mirotznik MS, Schwartzman D. Comparison of irrigated electrode designs for radio-frequency ablation of myocardium. J Intervent Cardiac Electrophysiol. 2001;5(4):391–400. doi: 10.1023/a:1013241927388. [DOI] [PMC free article] [PubMed] [Google Scholar]
- 19.Calkins H, Epstein A, Packer D, Arria AM, Hummel J, Gilligan DM, Trusso J, Carlson M, Luceri R, Kopelman H, Wilber D, Wharton JM, Stevenson W. Catheter ablation of ventricular tachycardia in patients with structural heart disease using cooled radiofrequency energy. J Am Coll Cardiol. 2000;35:1905–1914. doi: 10.1016/s0735-1097(00)00615-x. [DOI] [PubMed] [Google Scholar]
- 20.Schwartzman D, Fischer WD, Spencer EP, Pariszhkaya M, Devine W. Linear radiofrequency atrial lesions deployed using an irrigated electrode: electrical and histologic evolution. Circulation. 1998:I-567. [Google Scholar]
- 21.Schwartzman D, Fischer WD, Spencer EP. Linear radiofrequency atrial ablation: comparison of irrigated and non-irrigated electrodes. Circulation. 1998:I-643. [Google Scholar]


