Abstract
Background: Vitamin A (VA; retinol) supplementation is widely used to reduce child mortality in low-income countries. However, existing research suggests that supplementation with VA alone may not be optimal for infants.
Objective: We compared the effect of VA with VA combined with retinoic acid (VARA) on retinol uptake and turnover in organs of neonatal rats raised under VA-marginal conditions.
Methods: Secondary analysis was conducted on data obtained from 2 previous kinetic studies in Sprague-Dawley neonatal rats nursed by dams fed a VA-marginal diet (0.35 mg retinol equivalents/kg diet). On postnatal day 4, pups had been treated with a single dose of VA (6 μg/g; n = 52; VA study), VA + 10% retinoic acid (6 μg/g; n = 42; VARA study), or placebo (canola oil; n = 94; both studies), all of which contained ∼2 μCi [3H]retinol as the tracer for VA. Total retinol and tracer concentrations were measured in plasma and tissues from 1 h to 14 d after dosing. Control group data from both studies were merged before analysis. Kinetic parameters were re-estimated and compared statistically.
Results: VARA supplementation administered to neonatal rats within a few days after birth resulted in a lower turnover of retinol in the lungs, kidneys, and carcass and less frequent recycling of retinol between plasma and organs (100 compared with 288 times in the VARA- compared with the VA-treated group). Although VA supplementation resulted in a higher concentration of retinol in the liver, VARA supplementation led to a higher uptake of postprandial retinyl esters into the lungs, intestines, and carcass.
Conclusion: Given the relatively higher retinol uptake into several extrahepatic organs of neonates dosed orally with VARA, this form of supplementation may serve as a targeted treatment of low VA concentrations in extrahepatic organs that continue to develop postnatally.
Keywords: extrahepatic, growth and development, neonate, rat, retinyl esters, retinoic acid, vitamin A deficiency, vitamin A metabolism, vitamin A supplementation
Introduction
Despite a modest reduction in the prevalence of vitamin A (VA; retinol) deficiency in low-income countries, it is still very common in South Asia and sub-Saharan Africa, where it affects 44–48% of children (1). VA supplementation has been widely used as a cost-effective strategy to reduce all-cause mortality among children on the basis of the positive findings of multiple intervention trials conducted in this age group (2–4). However, the same intervention conducted in neonates (<1 mo old) did not bring the expected positive outcome (4–6), possibly due to a limited VA storage capacity of neonatal tissues (7).
Although knowledge about neonatal VA metabolism is limited, previous studies in neonatal rats showed that VA retention, especially in the extrahepatic tissues such as skin, bone, and muscle, is low compared with that in adult rats (7, 8). Moreover, oral supplementation with VA delivered during the first few days after birth resulted in an extensive recycling of retinol between plasma and tissues before catabolism (541 compared with 12–13 times normally observed in adult rats) (8, 9). On the other hand, a slightly modified form of VA supplement, VA mixed with 10% retinoic acid (VARA), which is designed to create a “metabolic priming” of VA metabolism, increased the uptake of retinol into extrahepatic tissues and reduced its recycling in supplemented compared with control neonates (10). However, these 2 supplements, VA and VARA, were tested in 2 separate studies in the supplemented and control groups; therefore, the extent to which VARA may be superior to VA in improving retinol tissue stores is currently unknown.
In this secondary analysis, we combined data from the VA and VARA studies (7, 11, 12) and used the model-based compartmental analysis to compare the concentration and kinetics of retinol in several organs of neonatal rats dosed with either VA or VARA or placebo in the amount equivalent to that which has been given to human infants (13). Our results build on previous knowledge of the neonatal VA metabolism and may help inform the most effective treatment of VA deficiency in neonates by comparing the effect of 2 different supplement forms on retinol tissue uptake and distribution.
Methods
Study design
Retinol concentration and kinetic data were obtained from 2 similar studies conducted in 2011 and 2013, which are described in detail in previous reports (7, 11, 12). Briefly, Sprague-Dawley pregnant female rats (Charles River Laboratories) were fed a VA-marginal (0.35 mg retinol equivalents/kg) AIN-93G purified diet (Research Diets) (14) to render them in VA status similar to that of mothers in low-income countries. Their newborn pups were randomly assigned to either the VA-supplemented (n = 52; 33 males) or control (n = 52; 30 males) groups in the VA study (7, 11) and to either the VARA-supplemented (n = 42; 19 males) or control (n = 42; 24 males) groups in the VARA study (12). In both studies, on postnatal day 4, pups received an oral dose of either VA [6 μg retinyl palmitate/g body weight (VA study)], VARA [6 μg retinyl palmitate/g body weight + 10% retinoic acid (VARA study)], or placebo [canola oil (both studies)]. All doses (VA, VARA, and placebo) contained ∼2 μCi [3H]retinol as the tracer for VA. Plasma and organs were collected from 0.5 h to 24 (VA study) or 14 (VARA study) d after dosing from pups sedated with isoflurane or, after postnatal day 14, killed with carbon dioxide. All animal procedures were approved by the Institutional Animal Care and Use Committee of the Pennsylvania State University. Retinol mass and tracer concentrations were measured by using ultra-performance LC (Acquity UPLC System; Waters) and liquid scintillation counting (Beckman Coulter), respectively, according to a protocol described earlier (7, 11, 15). In both studies, kinetic analysis was performed by using the Windows version of Simulation, Analysis, and Modeling software (version 3.0.8; http://www.winsaam.org) (16).
The VA and VARA experiments differed with respect to the following: 1) sample collection times (VA study: 0.5, 1, 4, 8, and 15 h, and 1, 2, 4, 8, 11, 14, 18, and 24 d after dosing; VARA study: 1, 2.5, 4, 6, 8, 11, and 15 h and 1, 2, 4, 6, 8, 11, and 14 d after dosing), 2) number of rat pups per sampling time according to group (VA study: n = 4; VARA study: n = 3), 3) organs collected [VA study: stomach, intestines, liver, lungs, kidneys, brain, adipose tissue, and the remaining carcass (muscles, bones, and connective tissue); VARA study: the same as in the VA study; however, the carcass comprised skin, adipose tissue, and brain (organs dissected and analyzed individually in the VA study)], and 4) retinol mass analysis (retinol mass was measured only in the liver, lungs, and plasma in the VARA study, precluding the comparison of retinol concentrations in other organs). To address these differences, the following adjustments were made to the data before statistical comparison. First, data for the skin, adipose tissue, brain, and carcass from the VA study were summed in order to match the VARA study carcass, and the resulting SEMs were recalculated on the basis of the following error propagation formula:
 |
Second, data from control groups in both studies (retinol and tracer concentrations measured at 1, 4, 8, and 15 h and 1, 2, 4, 8, 11, and 14 d after dosing) were combined to create a single comparison group. Third, models of retinol kinetics from the VA study were truncated by removing data for days 18 and 24 and the resulting kinetic parameters were re-estimated on the basis of the data observed from day 1 to day 14. The parameter estimation process followed the same steps as described in previous reports (10–12). Briefly, parameters were adjusted to obtain the best fit of the model-calculated plot to the observed data and the final values were generated through a weighted nonlinear regression analysis. The parameters were considered well identified if the sum of squares from regression analysis was <10−5 and the parameter fractional SD was <0.5.
Statistical analysis
The mean total retinol (REs + unesterified retinol) and tracer concentrations over time were plotted and the values for the control and VA- and VARA-supplemented neonates were compared by using a 2-factor ANOVA (treatment and time) with Bonferroni correction for multiple comparisons (GraphPad Prism version 5.0). Plotted values were expressed as the mean total retinol concentration ± SEM or the mean fraction of dose (total radioactivity measured in plasma or organ divided by the radioactivity of the ingested dose) in n = 4 pups that were killed at one sampling time. The sample size of n = 4 was sufficient to detect differences of P < 0.05 between treatment groups for the primary outcome, irreversible loss of retinol (9). The fractional transfer coefficients [L(I,J)s] were expressed as the mean fraction of tracer in compartment (J) transferred to compartment (I) per day ± SEM and compared statistically with the use of Student's t test, with a t-statistic evaluated for significance by using the table of critical values of t-distribution. Differences with P < 0.05 were considered significant. The uptake of retinol expressed as a percentage was calculated by using fractional transfer coefficients as the basal values.
Results
VA concentration in plasma, liver, and lungs
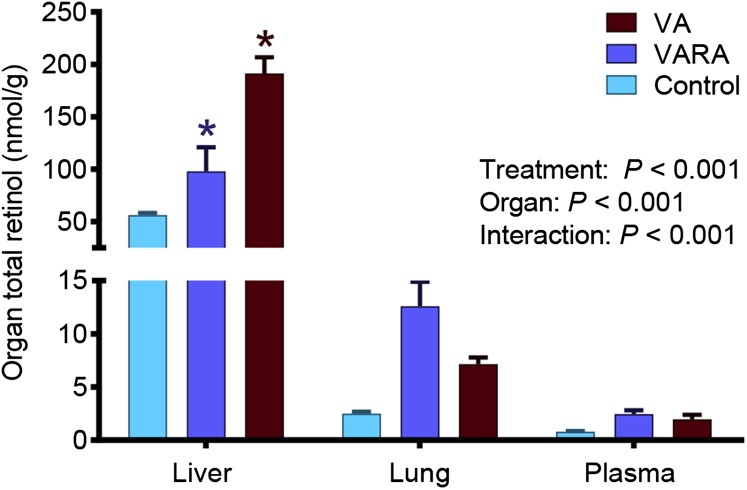
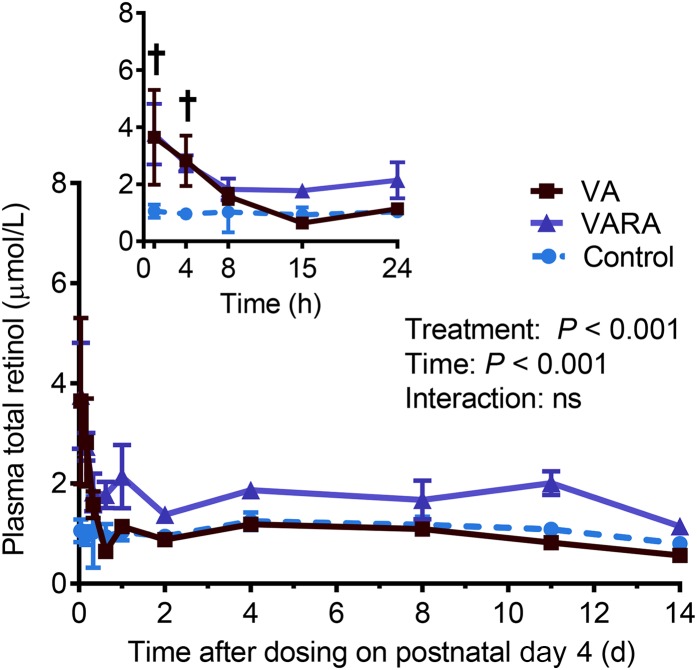
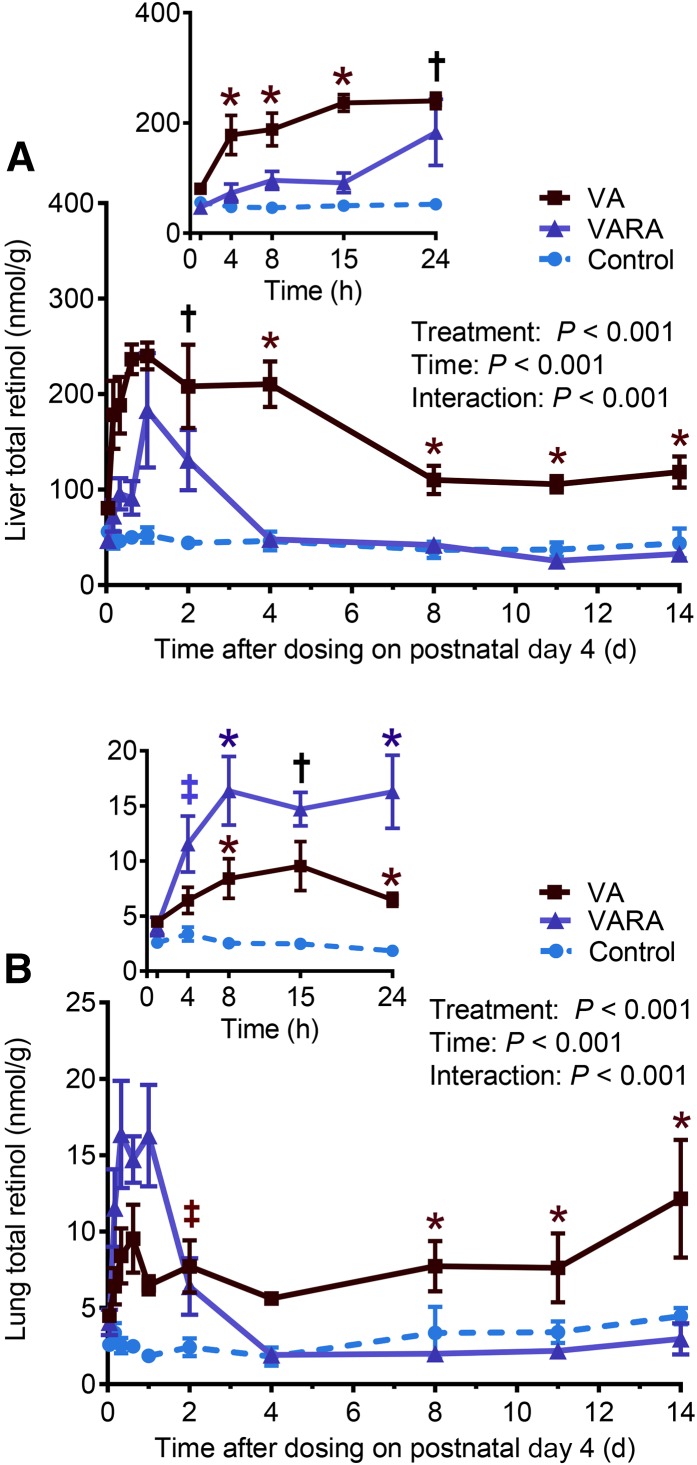
The mean total retinol concentrations on day 1 of the study were significantly higher in the liver in the VA-supplemented group compared with both the control and VARA-supplemented groups (P < 0.001 for both) and in the VARA-supplemented group compared with the control group only (P < 0.05) (Figure 1). During the study, total retinol concentrations in plasma were significantly higher in both of the supplemented groups than in the control group at 1 and 4 h after dosing (VA group compared with the control group: P < 0.001 at 1 h and P < 0.01 at 4 h; VARA group compared with the control group: P < 0.001 at 1 h and P < 0.05 at 4 h) (Figure 2). Total retinol concentrations in the liver were significantly higher in the VA-supplemented group compared with both other groups at all times from 4 h to 14 d, except at days 1 and 2 when they were significantly higher compared with the control group only (VA group compared with the control group: P < 0.001 from 4 h to 4 d; P < 0.01 from 8 to 14 d; VA group compared with the VARA group: P < 0.001 at 4 and 15 h and 4 d; P < 0.01 for other times) (Figure 3A). In the VARA-supplemented group, liver retinol concentrations were higher than in the control group at 1 and 2 d after dosing (P < 0.001 at 1 d and P < 0.01 at 2 d).
FIGURE 1.
Mean total (unesterified + esterified) retinol concentrations in the liver, lungs, and plasma of control and VA- and VARA-supplemented neonatal rat pups on day 1 after dosing on postnatal day 4. Values are means ± SEMs; n = 42 (control), n = 24 (VA), or n = 18 (VARA) rat pups. *VA or VARA compared with the other groups, P < 0.05 (ANOVA). VA, vitamin A; VARA, VA combined with retinoic acid.
FIGURE 2.
Plasma total (unesterified + esterified) retinol concentrations in control and VA- and VARA-supplemented neonatal rat pups from 0 to 14 d after dosing on postnatal day 4. The inset shows the first 24 h after dosing. Each point represents the mean ± SEM of n = 7 (control), n = 4 (VA), or n = 3 (VARA) rat pups. †Supplemented groups compared with control, P < 0.05 (ANOVA). VA, vitamin A; VARA, VA combined with retinoic acid.
FIGURE 3.
Liver (A) and lung (B) total (unesterified + esterified) retinol concentrations in control and VA- and VARA-supplemented neonatal rat pups from 0 to 14 d after dosing on postnatal day 4. Insets show the first 24 h after dosing. Each point represents the mean ± SEM of n = 7 (control), n = 4 (VA), or n = 3 (VARA) rat pups. *VA or VARA group compared with the other groups; †supplemented groups compared with control; ‡VA or VARA group compared with control [all P < 0.05 (ANOVA)]. VA, vitamin A; VARA, VA combined with retinoic acid.
In the lungs, total retinol concentrations were higher in the VARA-supplemented group than in both other groups at 8 and 24 h after dosing (P < 0.001 for all) and higher than in the control group at 4 and 15 h (P < 0.001 for both) (Figure 3B). In the VA–supplemented neonates, lung retinol concentrations were higher than in both other groups during the last 6 d of the study (P < 0.05 at 8 and 11 d; P < 0.001 at 14 d) and higher than in controls between 8 h and 2 d after dosing (P < 0.05 at 1 d; P < 0.01 for other times).
Tracer response in digestive organs
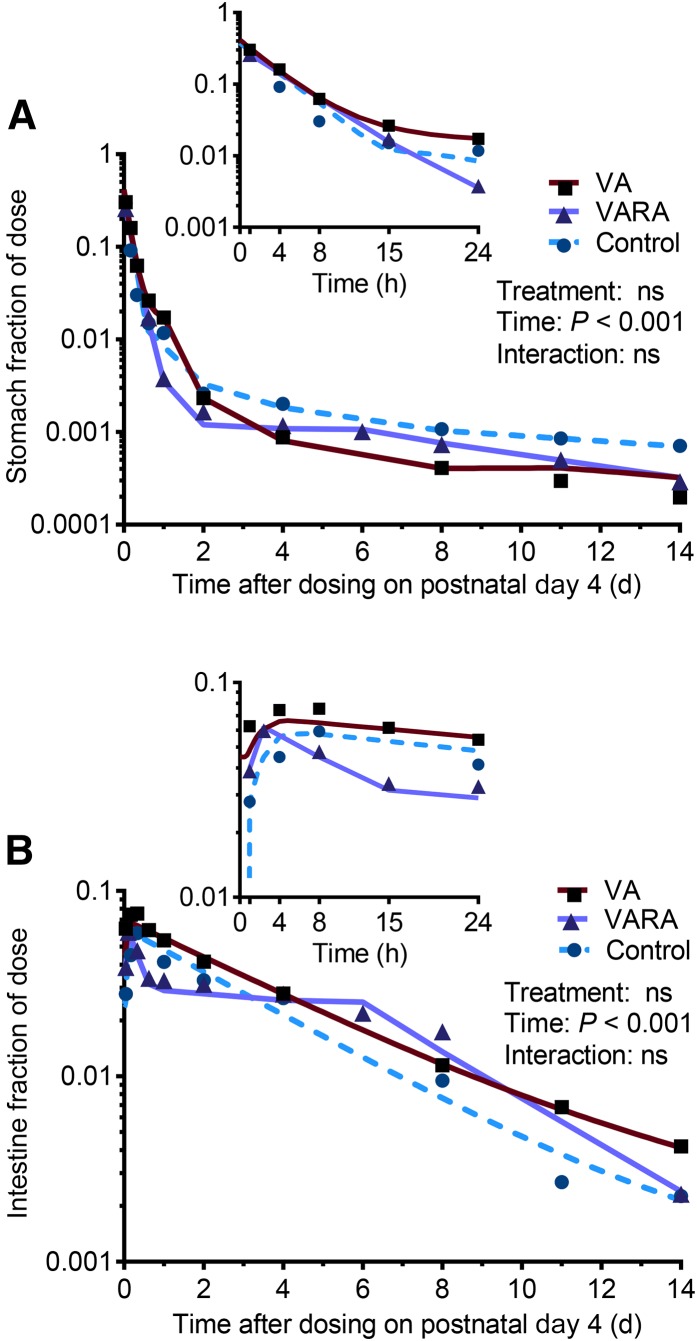
There were no significant differences in tracer response observed in digestive organs between the 3 groups (Figure 4). The tracer appeared to leave the intestine more rapidly in the VARA group between 4 and 15 h after dosing, but the difference was not significant (Figure 4B).
FIGURE 4.
Stomach (A) and intestine (B) fractions of ingested [3H]retinol dose in control and VA- and VARA-supplemented neonatal rat pups from 0 to 14 d after dosing on postnatal day 4. Insets show the first 24 h after dosing. Each symbol represents the mean of n = 7 (control), n = 4 (VA), or n = 3 (VARA) rat pups. There were no significant differences between groups. VA, vitamin A; VARA, VA combined with retinoic acid.
Tracer response in plasma, liver, and extrahepatic organs
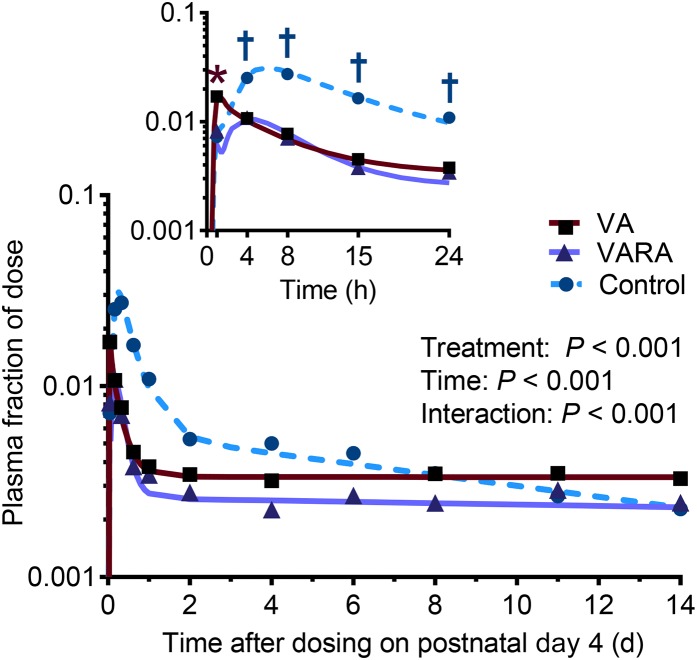
The tracer concentrations in plasma were significantly higher in the VA-supplemented group than in both other groups at 1 h after dosing (VA group compared with the control group: P < 0.01; VA group compared with the VARA group: P < 0.05) (Figure 5). Between 4 and 24 h after dosing, both supplemented groups showed a significantly lower tracer concentration than the control group (P < 0.001 from 4 to 15 h; P < 0.05 at 24 h).
FIGURE 5.
Plasma fraction of ingested [3H]retinol dose in control and VA- and VARA-supplemented neonatal rat pups from 0 to 14 d after dosing on postnatal day 4. The inset shows the first 24 h after dosing. Each symbol represents the mean of n = 7 (control), n = 4 (VA), or n = 3 (VARA) rat pups. *VA group compared with the other groups; †supplemented groups compared with control [all P < 0.05 (ANOVA)]. VA, vitamin A; VARA, VA combined with retinoic acid.
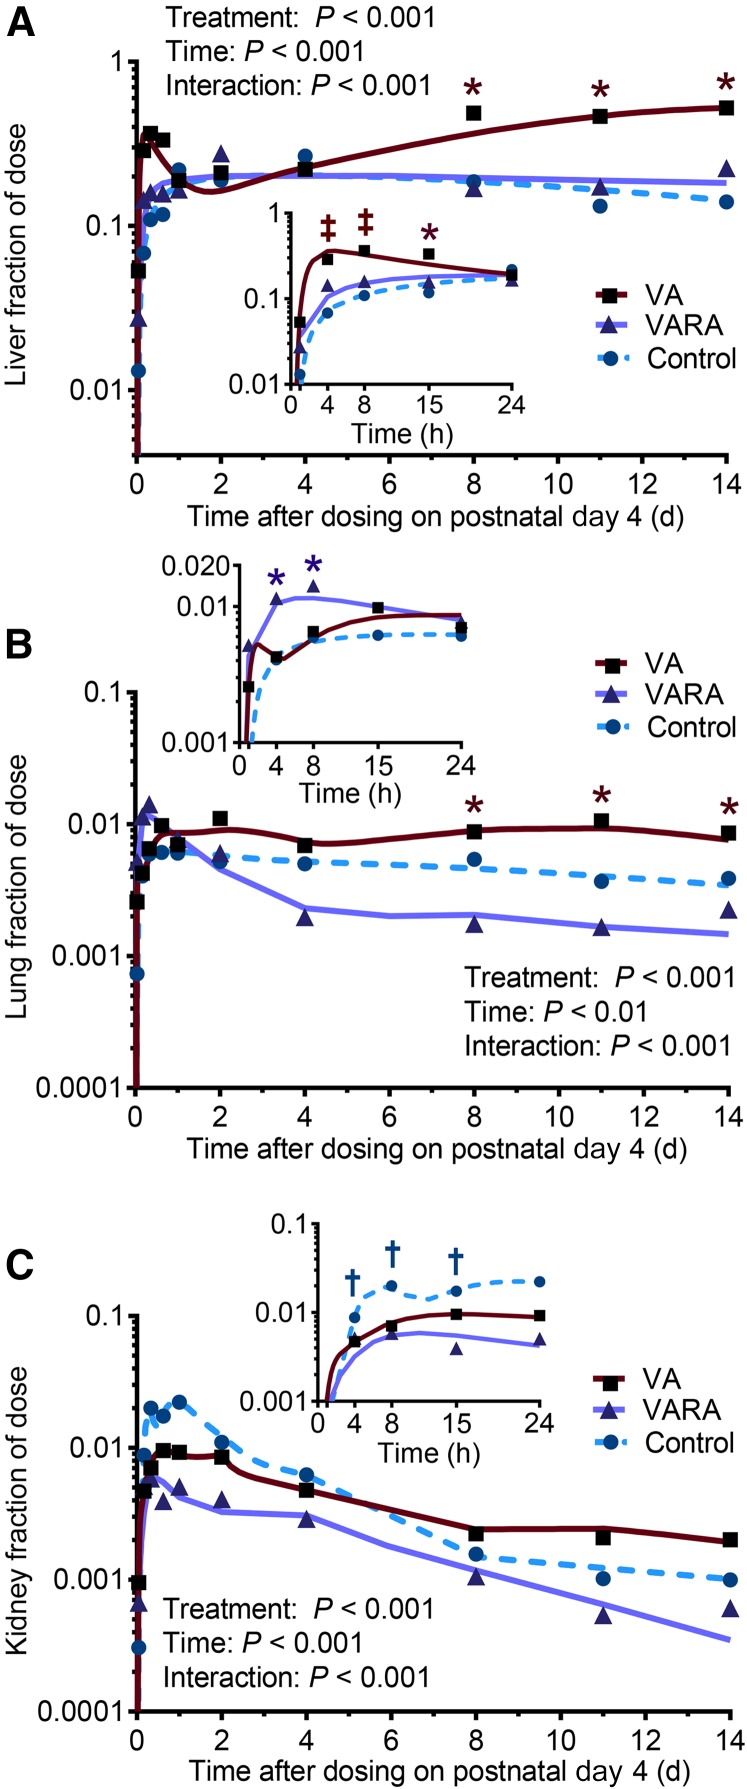
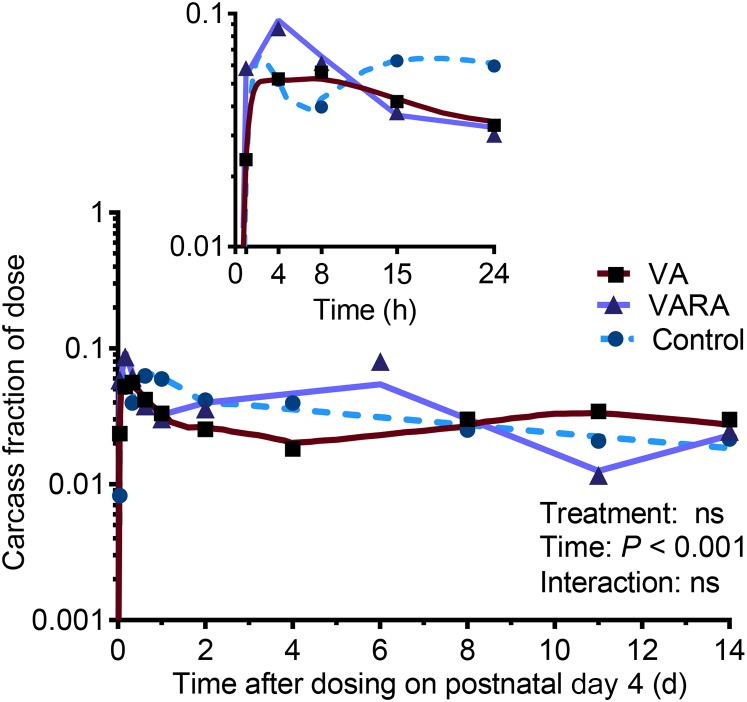
The tracer concentrations in the liver were significantly higher in the VA-supplemented group compared with the control group at 4 and 8 h after dosing (P < 0.001 for both) and compared with both other groups at 15 h (P < 0.001) and during the last 6 d of the study (VA group compared with the control group: P < 0.001 for all; VA group compared with the VARA group: P < 0.01 at 8 d and P < 0.001 for other times) (Figure 6A). In the lungs, tracer concentrations were significantly higher in the VARA group compared with both other groups at 4 and 8 h after dosing (P < 0.001 at 4 h and P < 0.05 at 8 h) and in the VA group compared with both other groups during the last 6 d of the study (VA group compared with the control group: P < 0.01 at 8 d, P < 0.05 at 11 d, and P < 0.001 at 14 d; VA group compared with the VARA group: P < 0.05 at 14 d and P < 0.01 for other times) (Figure 6B). Tracer concentrations in the kidneys were significantly lower in both supplemented groups compared with the control group between 8 and 24 h after dosing (VA group compared with the control group: P < 0.01 at 15 h and P < 0.001 for other times; VARA group compared with the control group: P < 0.001 for all) (Figure 6C). In the carcass, there were no significant differences between groups (Figure 7). The tracer appeared to peak higher in the VARA group at 4 h after dosing, but the difference was not significant.
FIGURE 6.
Liver (A), lung (B), and kidney (C) fractions of ingested [3H]retinol dose in control and VA- and VARA-supplemented neonatal rat pups from 0 to 14 d after dosing on postnatal day 4. Insets show the first 24 h after dosing. Each symbol represents the mean of n = 7 (control), n = 4 (VA), or n = 3 (VARA) rat pups. *VA or VARA group compared with other groups; †supplemented groups compared with control; ‡VA or VARA group compared with control [all P < 0.05 (ANOVA)]. VA, vitamin A; VARA, VA combined with retinoic acid.
FIGURE 7.
Carcass fraction of ingested [3H]retinol dose in control and VA- and VARA-supplemented neonatal rat pups from 0 to 14 d after dosing on postnatal day 4. The inset shows the first 24 h after dosing. Each symbol represents the mean of n = 7 (control), n = 4 (VA), or n = 3 (VARA) rat pups. There were no significant differences between groups. VA, vitamin A; VARA, VA combined with retinoic acid.
Plasma kinetic parameters
The fractional uptake of chylomicron retinyl esters (CM-REs) and retinol-binding protein–bound retinol (RBP-ROH) from plasma to organs and the irreversible loss of retinol from organs were not different in pups that received either the VARA or VA dose (Table 1). However, VARA supplementation resulted in a significantly greater fractional release of RBP-ROH from the liver to plasma (P < 0.001) and a significantly lower recycling of retinol-binding protein (RBP)–derived retinol from organs back to plasma (P < 0.05). The VARA-supplemented group also showed a longer transit time of retinol in plasma, a higher fractional catabolic rate of plasma retinol, and therefore a lower recycling number of retinol between plasma and organs than did the VA-supplemented group (Table 2).
TABLE 1.
Plasma fractional transfer coefficients in control and VA- and VARA-supplemented neonatal rat pups dosed orally with [3H]retinol on postnatal day 41
| Fractional transfer coefficients [L(I,J)] | |||
|---|---|---|---|
| Variable | Control group | VA group | VARA group |
| Transit of retinol through digestive system | 26.9 ± 2.0a | 31.9 ± 13.4a,b | 11.5 ± 1.2b |
| Uptake of CM-REs from plasma to organs | 567 ± 95.2 | 508 ± 135 | 647 ± 105 |
| Release of RBP-ROH from liver to plasma | 2.5 ± 0.1a | 4.0 ± 0.2b | 5.5 ± 0.1c |
| Uptake of RBP-ROH from plasma to organs | 29.8 ± 0.8a | 245 ± 184a,b | 169.4 ± 3.2b |
| Recycling of RBP-ROH from organs to plasma | 0.3 ± 0.0a | 1.2 ± 0.1b | 0.8 ± 0.0c |
| Irreversible loss of retinol from organs | 0.06 ± 0.00a | 0.01 ± 0.01b | 0.01 ± 0.00b |
Values are means ± SEMs. Means within a row without a common superscript letter differ, P < 0.05 (ANOVA). CM-RE, chylomicron retinyl ester; RBP-ROH, retinol-binding protein–bound retinol; VA, vitamin A; VARA, vitamin A combined with retinoic acid.
TABLE 2.
Plasma kinetic parameters in control and VA- and VARA-supplemented neonatal rat pups dosed orally with [3H]retinol on postnatal day 41
| Variable | Description | Control group | VA group | VARA group |
|---|---|---|---|---|
| Plasma residence time | Average time a molecule of retinol spends in plasma over multiple transits | 4.8 h | 28.3 h | 14.4 h |
| Plasma transit time | Average time a molecule of retinol spends in plasma during a single transit | 48.6 min | 6.0 min | 8.4 min |
| Organ transit time | Average time a molecule of retinol spends in organs during a single transit | 2.6 d | 20 h | 28 h |
| Fractional catabolic rate | Fraction of plasma retinol utilized irreversibly per day | 5.0 | 0.8 | 1.7 |
| Recycling number | Average number of times a molecule of retinol recycles through plasma before irreversible disposal | 5 | 288 | 100 |
VA, vitamin A; VARA, vitamin A combined with retinoic acid.
Organ kinetic parameters
The fractional uptake of CM-REs into the intestines, lungs, and carcass was significantly higher in the VARA group compared with the VA group (P < 0.001 for all), whereas the uptake into the liver and kidneys was higher in the VA group compared with the VARA group (P < 0.001 for both) (Table 3). The fractional uptake of RBP-ROH into the intestines and liver was significantly higher in the VARA group compared with the VA group (P < 0.001 for both), whereas the uptake into the lungs, kidneys, and carcass was higher in the VA group compared with the VARA group (P < 0.001 for all).
TABLE 3.
Fractional uptakes of CM-REs and RBP-ROH from plasma to organs in control and VA- and VARA-supplemented neonatal rat pups dosed orally with [3H]retinol on postnatal day 41
| Fractional transfer coefficients [L(I,J)], fraction of plasma retinol transferred/d | ||||||
|---|---|---|---|---|---|---|
| Uptake of CM-REs | Uptake of RBP-ROH | |||||
| Organ | Control group | VA group | VARA group | Control group | VA group | VARA group |
| Stomach2 | — | — | — | 2.0 ± 0.9 | 10.0 ± 5.5 | 0.6 ± 0.3 |
| Intestines | 39.3 ± 8.4a | 19.1 ± 3.1b | 327 ± 15.5c | 0.01 ± 0.01a | 0.04 ± 0.01b | 9.8 ± 0.3c |
| Liver | 77.3 ± 3.4a | 304 ± 15.6b | 223 ± 3.7c | 6.7 ± 1.0a | 17.0 ± 0.5b | 28.1 ± 1.0c |
| Lungs | 5.1 ± 0.2a | 15.0 ± 1.1b | 32.6 ± 0.3c | 0.2 ± 0.1a | 4.6 ± 0.4b | 0.1 ± 0.0a |
| Kidneys | 34.8 ± 1.6a | 4.9 ± 0.4b | 1.4 ± 0.1c | 3.2 ± 0.1a | 6.8 ± 0.5b | 3.0 ± 0.1a |
| Carcass | 271.6 ± 12.7a | 176 ± 11.7b | 438 ± 6.3c | 7.7 ± 0.1a | 196 ± 6.5b | 7.2 ± 0.1c |
Values are means ± SEMs. Means within a row without a common superscript letter differ, P < 0.05 (ANOVA). CM-RE, chylomicron retinyl ester; RBP-ROH, retinol-binding protein–bound retinol; VA, vitamin A; VARA, vitamin A combined with retinoic acid.
The stomach model did not include a CM-RE uptake component.
The fractional turnover of both the chylomicron- and RBP-derived retinol was significantly higher in the intestines in the VARA group compared with the VA group (P < 0.001 for both) (Table 4). In the liver, the turnover of chylomicron-derived retinol was higher in the VA group (P < 0.001), whereas the turnover of RBP-derived retinol was higher in the VARA group (P < 0.001). In all other organs, except for the stomach, the turnover of both the chylomicron- and RBP-derived retinol was significantly higher in the VA group compared with the VARA group (P < 0.001 for all).
TABLE 4.
Fractional turnover of chylomicron- and RBP-derived retinol in organs of control and VA- and VARA-supplemented neonatal rat pups dosed orally with [3H]retinol on postnatal day 41
| Fractional transfer coefficients [L(I,J)], fraction of organ retinol transferred/d | ||||||
|---|---|---|---|---|---|---|
| Turnover of chylomicron-derived retinol2 | Turnover of RBP-derived retinol2 | |||||
| Organ | Control group | VA group | VARA group | Control group | VA group | VARA group |
| Stomach | 5.8 ± 0.2a | 6.2 ± 0.5a,b | 5.0 ± 0.1b | 6.4 ± 3.0 | 79.5 ± 51.5 | 0.8 ± 0.3 |
| Intestines | 0.3 ± 0.0a | 0.2 ± 0.0a | 7.9 ± 0.3b | 0.0 ± 0.0a | 0.0 ± 0.0a | 0.7 ± 0.0b |
| Liver | 0.1 ± 0.3a | 1.4 ± 0.1b | 0.2 ± 0.0a | 0.2 ± 0.1a | 0.1 ± 0.0a | 0.4 ± 0.0b |
| Lungs | 0.8 ± 0.5a | 37.4 ± 4.6b | 0.7 ± 0.0a | 0.2 ± 0.1a | 2.0 ± 0.2b | 0.1 ± 0.0a |
| Kidneys | 4.1 ± 0.6a | 21.2 ± 3.6b | 0.1 ± 0.0c | 6.1 ± 1.1a | 9.4 ± 0.7b | 1.8 ± 0.1c |
| Carcass | 26.2 ± 2.1a | 88.7 ± 10.8b | 5.8 ± 0.1c | 1.1 ± 0.0a | 2.8 ± 0.1b | 0.3 ± 0.0c |
Values are means ± SEMs. Means within a row without a common superscript letter differ, P < 0.05 (ANOVA). RBP, retinol-binding protein; VA, vitamin A; VARA, vitamin A combined with retinoic acid.
Turnover included both retinol released back to plasma and retinol metabolized irreversibly in an organ, due to an assumption inherent in uncoupling the organs from the rest of the system to model them individually.
Percentage of uptake of retinol from plasma to organs
The percentage of uptake of CM-REs from plasma was highest in the liver in the VA group and in the carcass in the VARA group (Table 5). The opposite was found for RBP-ROH. The percentage of uptake of RBP-ROH was highest in the carcass in the VA group and in the liver in the VARA group.
TABLE 5.
Percentage of uptake of CM-REs and RBP-ROH from plasma to organs of control and VA- and VARA-supplemented neonatal rat pups dosed orally with [3H]retinol on postnatal day 41
| CM-RE uptake, % | RBP-ROH uptake, % | |||||
|---|---|---|---|---|---|---|
| Organ | Control group | VA group | VARA group | Control group | VA group | VARA group |
| Stomach2 | — | — | — | 10.1 | 4.3 | 1.2 |
| Intestines | 9.2 | 3.7 | 32.0 | 0.1 | 0.0 | 20.1 |
| Liver | 18.1 | 58.6 | 21.8 | 33.8 | 7.3 | 57.6 |
| Lungs | 1.2 | 2.9 | 3.2 | 1.0 | 2.0 | 0.2 |
| Kidneys | 8.1 | 0.9 | 0.1 | 16.2 | 2.9 | 6.1 |
| Carcass | 63.4 | 33.9 | 42.9 | 38.9 | 83.6 | 14.8 |
CM-RE, chylomicron retinyl ester; RBP-ROH, retinol-binding protein–bound retinol; VA, vitamin A; VARA, vitamin A combined with retinoic acid.
The stomach model did not include a CM-RE uptake component.
Discussion
Previous animal studies reported that oral supplementation of neonatal rats with VA and a small proportion of retinoic acid (VARA) resulted in a greater uptake of retinol into extrahepatic tissues (10) and higher retinol concentrations in plasma, liver, and lungs of the supplemented group than in the control group (17). However, the primary form of supplementation used to reduce VA deficiency in low-income countries is pure VA (retinyl palmitate) (5). To determine whether the supplementation with VARA offers additional benefits in terms of improved uptake and retention of VA in tissues, we compared the effects of these 2 treatments on retinol concentrations and kinetics in organs of neonatal rats raised under VA-marginal conditions to simulate the low VA status common in areas where supplementation is practiced.
Our results showed that the recycling number of retinol, or the number of times an average molecule of retinol moves between plasma and organs before irreversible disposal, was lower in the VARA group than in the VA group due to the lower turnover of retinol in most organs in this group. We also found that the fractional uptake of CM-REs into the lungs, intestines, and carcass was significantly higher in the VARA-supplemented pups, whereas the uptake into the liver and kidneys was higher in the VA-treated pups, as were their liver retinol concentrations throughout the study. Finally, there was a reciprocal relation between the uptake of CM-REs and RBP-ROH in both the VARA- and VA-supplemented pups: a significantly higher fractional uptake of CM-REs in the VARA group compared with the VA group coincided with a significantly lower fractional uptake of RBP-ROH, and vice versa. This relation was present in all organs except for the intestines and kidneys.
Our finding of the lower organ turnover of retinol after supplementation with VARA than with VA may be attributed to the synergistic effect of VA and retinoic acid on the activity of lecithin-retinol acyltransferase (LRAT), an enzyme responsible for the esterification of retinol for long-term storage. This phenomenon was previously shown in the liver, lungs, and kidneys in both neonatal and adult rats (17–20). However, given the presence of LRAT in other organs, including intestine, skin, and adipose tissue (18, 19), it is likely that this effect occurs throughout the body. The simultaneous induction of LRAT by VARA in multiple organs may lead to greater retention and lower recycling of retinol back to plasma, as observed in our study.
Our second finding, that is, the more potent effect of VARA than of VA on the uptake of CM-REs into the intestines, lungs, and carcass but not into the liver, may be explained by a relatively greater sensitivity of LRAT in these organs. This explanation is consistent with a previous finding that the expression of LRAT after oral treatment with retinoic acid was 6- to 9-fold higher in the lungs and only 2-fold higher in the liver (20). It is also consistent with a previous kinetic study, which found that the residence time of retinol was 75-fold longer in the lungs of rats supplemented with retinoic acid than in controls, compared with 14-fold longer in the liver (21). The effect of VARA in the lungs, intestines, and carcass may be further enhanced by the presence of the stimulated-by-retinoic acid 6 receptor (STRA6), a cell membrane transporter for RBP-ROH that delivers retinol to LRAT (22, 23). STRA6 is highly expressed in all 3 of these organs, especially during development (17, 24, 25), but it is absent in the liver (26), although an alternate form, RBP4 receptor 2 (27), might have a similar function. Furthermore, the expression of STRA6 in neonatal lungs has been previously shown to increase in response to oral VARA supplementation (17, 24).
The stronger effect of VARA than of VA on the uptake of CM-REs into the lungs compared with the liver may also result from their differential effect on the activity of cytochrome P450 (CYP)26A1 and CYP26B1 in these organs. Both CYP26A1 and CYP26B1 oxidize retinoic acid irreversibly, converting it to its inactive metabolites (28). However, the CYP26A1 variant is most prominently expressed in the liver where it is highly responsive to retinoic acid. In fact, its expression shows the largest fold increase due to the treatment with retinoic acid compared with any other VA–metabolizing enzyme (28, 29). In contrast, the CYP26B1 variant is more highly expressed in the lungs and is somewhat less sensitive to retinoic acid (24). Therefore, it is possible that a large dose of VA combined with retinoic acid induces its own catabolism in the liver to a greater extent than it does in the lungs, resulting in a lower accumulation of hepatic retinol. This hypothesis agrees with our finding of a lower retinol concentration and a higher turnover of RBP-ROH in the liver in the VARA group.
As for the higher uptake and concentration of retinol in the kidneys of the VA-supplemented pups, we speculate that this may be a result of the frequent recycling of RBP-ROH observed in this group. Although the liver is the main site of RBP synthesis, ∼50% of the circulating retinol is sequestered in the kidneys, filtered into urine, reabsorbed, and released back into the circulation after binding to newly synthesized RBP in the cells of the proximal convoluted tubules (30). Moreover, kidneys have a considerable capacity for storing retinyl esters (19) despite their lower expression of LRAT compared with the lungs or liver (18). This may explain the high turnover of RBP-derived retinol observed in the kidneys of the VA-supplemented pups.
Finally, our finding of the reciprocal relation between the uptake of CM-REs and RBP-ROH may reflect a highly regulated, organ-specific activity of LRAT, which ensures that a relatively high uptake of CM-REs is followed by a lower uptake of RBP-ROH, and vice versa. The reason why this relation was absent from the intestines and kidneys could be the constitutive high expression of LRAT in the intestines (18, 31, 32) and its narrow range of expression in the kidneys (17).
The design of our study has both strengths and limitations. As strengths, the comparison of the 2 studies, conducted under similar conditions with regard to the age of the neonate pups, the maternal diet, dosing, and sample preparation, allows inference about the effect of retinoic acid administration, as a surrogate for higher VA status, on the trafficking, tissue distribution, and metabolism of retinol. The results suggest that postprandial retinol metabolism is indeed influenced and suggest greater involvement of the intestines, lungs, and carcass in the removal of plasma retinol due to the presence of retinoic acid (VARA compared with VA alone). A limitation is that the 2 studies were not conducted concurrently, although to the best of our abilities, important procedural protocols were the same for both studies. Nonetheless, future research should test retinoic acid treatment (or higher VA status) in neonates side-by-side with the absence of retinoic acid treatment (lower VA status) to confirm the results of the present study and to further explore mechanisms by with retinoic acid has the effects that are predicted from the current analysis.
In conclusion, VARA supplementation administered to neonatal rat pups raised under VA-marginal conditions decreased retinol turnover in the lungs, kidneys, and carcass and attenuated the frequent recycling of retinol observed in VA-treated neonates. Although VA supplementation resulted in a higher concentration of retinol in the liver, VARA supplementation increased the uptake of CM-REs into the intestines, lungs, and carcass to a greater extent than did VA. Given the relatively higher uptake of postprandial REs into several extrahepatic organs of neonates dosed with VARA, this form of supplementation may serve as a targeted treatment of low VA concentrations in nonhepatic organs that continue to develop postnatally, such as lungs and intestines.
Acknowledgments
We thank JB Green for editorial assistance. The authors' responsibilities were as follows—JKH: conducted the research, analyzed the data, and wrote the manuscript; LT: conducted the research; MHG: assisted with the kinetic analysis and interpretation; ACR: conducted the research and had primary responsibility for the final content; and all authors: designed the research and read and approved the final manuscript.
Abbreviations
- CM-RE
chylomicron retinyl ester
- CYP
cytochrome P450
- LRAT
lecithin-retinol acyltransferase
- RBP
retinol-binding protein
- RBP-ROH
retinol-binding protein–bound retinol
- STRA6
stimulated-by-retinoic acid 6 receptor
- VA
vitamin A
- VARA
vitamin A combined with retinoic acid
Footnotes
Supported by the Pennsylvania State University Graduate Program in Nutrition, the Dorothy Foehr Huck Endowment, and NIH HD-066982.
References
- 1. Stevens GA, Bennett JE, Hennocq Q, Lu Y, De-Regil LM, Rogers L, Danaei G, Li G, White RA, Flaxman SR, et al. Trends and mortality effects of vitamin A deficiency in children in 138 low-income and middle-income countries between 1991 and 2013: a pooled analysis of population-based surveys. Lancet Glob Health 2015;3:e528–36. [DOI] [PubMed] [Google Scholar]
- 2. Bhutta ZA, Ahmed T, Black RE, Cousens S, Dewey K, Giugliani E, Haider BA, Kirkwood B, Morris SS, Sachdev HP, et al. What works? Interventions for maternal and child undernutrition and survival. Lancet 2008;371:417–40. [DOI] [PubMed] [Google Scholar]
- 3. Thorne-Lyman A, Fawzi WW.. Vitamin A supplementation, infectious disease and child mortality: a summary of the evidence. Nestle Nutr Inst Workshop Ser 2012;70:79–90. [DOI] [PubMed] [Google Scholar]
- 4. Tanumihardjo SA, Russell RM, Stephensen CB, Gannon BM, Craft NE, Haskell MJ, Lietz G, Schulze K, Raiten DJ.. Biomarkers of nutrition for development (BOND)—vitamin A review. J Nutr 2016;146(Suppl):1816S–48S. [DOI] [PMC free article] [PubMed] [Google Scholar]
- 5. Gogia S, Sachdev HS.. Neonatal vitamin A supplementation for prevention of mortality and morbidity in infancy: systematic review of randomised controlled trials. BMJ 2009;338:b919. [DOI] [PMC free article] [PubMed] [Google Scholar]
- 6. Imdad A, Yakoob MY, Sudfeld C, Haider BA, Black RE, Bhutta ZA.. Impact of vitamin A supplementation on infant and childhood mortality. BMC Public Health 2011;11(Suppl 3):S20. [DOI] [PMC free article] [PubMed] [Google Scholar]
- 7. Hodges JK, Tan L, Green MH, Ross AC.. Vitamin A supplementation transiently increases retinol concentrations in extrahepatic organs of neonatal rats raised under vitamin A–marginal conditions. J Nutr 2016;146:1953–60. [DOI] [PMC free article] [PubMed] [Google Scholar]
- 8. Tan L, Green MH, Ross AC.. Vitamin A kinetics in neonatal rats vs. adult rats: comparisons from model-based compartmental analysis. J Nutr 2015;145:403–10. [DOI] [PMC free article] [PubMed] [Google Scholar]
- 9. Hodges JK, Tan L, Green MH, Ross AC.. Vitamin A supplementation redirects the flow of retinyl esters from peripheral to central organs of neonatal rats raised under vitamin A–marginal conditions. Am J Clin Nutr 2017;105:1110–21. [DOI] [PMC free article] [PubMed] [Google Scholar]
- 10. Tan L, Wray AE, Green MH, Ross AC.. Retinol kinetics in unsupplemented and vitamin A-retinoic acid supplemented neonatal rats: a preliminary model. J Lipid Res 2014;55:1077–86. [DOI] [PMC free article] [PubMed] [Google Scholar]
- 11. Hodges JK, Tan L, Green MH, Ross AC.. Vitamin A supplementation increases the uptake of chylomicron retinyl esters into the brain of neonatal rats raised under vitamin A–marginal conditions. J Nutr 2016;146:1677–83. [DOI] [PMC free article] [PubMed] [Google Scholar]
- 12. Tan L, Wray AE, Green MH, Ross AC.. Compartmental modeling of whole-body vitamin A kinetics in unsupplemented and vitamin A-retinoic acid-supplemented neonatal rats. J Lipid Res 2014;55:1738–49. [DOI] [PMC free article] [PubMed] [Google Scholar]
- 13. WHO Guideline: neonatal vitamin A supplementation. Geneva (Switzerland): WHO; 2011. [PubMed] [Google Scholar]
- 14. Reeves PG, Nielsen FH, Fahey GC Jr... AIN-93 purified diets for laboratory rodents: final report of the American Institute of Nutrition ad hoc writing committee on the reformulation of the AIN-76A rodent diet. J Nutr 1993;123:1939–51. [DOI] [PubMed] [Google Scholar]
- 15. Ross AC.. Separation and quantitation of retinyl esters and retinol by high-performance liquid chromatography. Methods Enzymol 1986;123:68–74. [DOI] [PubMed] [Google Scholar]
- 16. Wastney ME, Patterson BH, Linares OA, Greif PC, Boston RC.. WinSAAM. Investigating biological systems using modeling: strategies and software. San Diego (CA): Academic Press; 1999. [Google Scholar]
- 17. Owusu SA, Ross AC.. Retinoid homeostatic gene expression in liver, lung and kidney: ontogeny and response to vitamin A-retinoic acid (VARA) supplementation from birth to adult age. PLoS One 2016;11:e0145924. [DOI] [PMC free article] [PubMed] [Google Scholar]
- 18. Zolfaghari R, Ross AC.. Lecithin:retinol acyltransferase from mouse and rat liver: CDNA cloning and liver-specific regulation by dietary vitamin A and retinoic acid. J Lipid Res 2000;41:2024–34. [PubMed] [Google Scholar]
- 19. Liu L, Gudas LJ.. Disruption of the lecithin:retinol acyltransferase gene makes mice more susceptible to vitamin A deficiency. J Biol Chem 2005;280:40226–34. [DOI] [PubMed] [Google Scholar]
- 20. Zolfaghari R, Ross AC.. Lecithin:retinol acyltransferase expression is regulated by dietary vitamin A and exogenous retinoic acid in the lung of adult rats. J Nutr 2002;132:1160–4. [DOI] [PubMed] [Google Scholar]
- 21. Cifelli CJ, Green JB, Green MH.. Dietary retinoic acid alters vitamin A kinetics in both the whole body and in specific organs of rats with low vitamin A status. J Nutr 2005;135:746–52. [DOI] [PubMed] [Google Scholar]
- 22. Isken A, Golczak M, Oberhauser V, Hunzelmann S, Driever W, Imanishi Y, Palczewski K, von Lintig J.. RBP4 disrupts vitamin A uptake homeostasis in a STRA6-deficient animal model for Matthew-Wood syndrome. Cell Metab 2008;7:258–68. [DOI] [PMC free article] [PubMed] [Google Scholar]
- 23. Kawaguchi R, Yu J, Honda J, Hu J, Whitelegge J, Ping P, Wiita P, Bok D, Sun H.. A membrane receptor for retinol binding protein mediates cellular uptake of vitamin A. Science 2007;315:820–5. [DOI] [PubMed] [Google Scholar]
- 24. Wu L, Ross AC.. Acidic retinoids synergize with vitamin A to enhance retinol uptake and STRA6, LRAT, and CYP26B1 expression in neonatal lung. J Lipid Res 2010;51:378–87. [DOI] [PMC free article] [PubMed] [Google Scholar]
- 25. Smeland S, Bjerknes T, Malaba L, Eskild W, Norum KR, Blomhoff R.. Tissue distribution of the receptor for plasma retinol-binding protein. Biochem J 1995;305:419–24. [DOI] [PMC free article] [PubMed] [Google Scholar]
- 26. Kawaguchi R, Zhong M, Kassai M, Ter-Stepanian M, Sun H.. Vitamin A transport mechanism of the multitransmembrane cell-surface receptor STRA6. Membranes (Basel) 2015;5:425–53. [DOI] [PMC free article] [PubMed] [Google Scholar]
- 27. Alapatt P, Guo F, Komanetsky SM, Wang S, Cai J, Sargsyan A, Rodriguez Diaz E, Bacon BT, Aryal P, Graham TE.. Liver retinol transporter and receptor for serum retinol-binding protein (RBP4). J Biol Chem 2013;288:1250–65. [DOI] [PMC free article] [PubMed] [Google Scholar]
- 28. Ross AC, Cifelli CJ, Zolfaghari R, Li NQ.. Multiple cytochrome P-450 genes are concomitantly regulated by vitamin A under steady-state conditions and by retinoic acid during hepatic first-pass metabolism. Physiol Genomics 2011;43:57–67. [DOI] [PMC free article] [PubMed] [Google Scholar]
- 29. Ross AC.. Retinoid production and catabolism: role of diet in regulating retinol esterification and retinoic acid oxidation. J Nutr 2003;133(Suppl):291S–6S. [DOI] [PubMed] [Google Scholar]
- 30. Raila J, Buchholz I, Aupperle H, Raila G, Schoon HA, Schweigert FJ.. The distribution of vitamin A and retinol-binding protein in the blood plasma, urine, liver and kidneys of carnivores. Vet Res 2000;31:541–51. [DOI] [PubMed] [Google Scholar]
- 31. Randolph RK, Ross AC.. Vitamin A status regulates hepatic lecithin: retinol acyltransferase activity in rats. J Biol Chem 1991;266:16453–7. [PubMed] [Google Scholar]
- 32. Ross AC, Zolfaghari R.. Regulation of hepatic retinol metabolism: perspectives from studies on vitamin A status. J Nutr 2004;134:269S–75S. [DOI] [PubMed] [Google Scholar]


