
Figure 1. Cartoon of E complex formation and the impact of the 5' SS mutations on U1 binding kinetics.
(A) E complex assembles on pre-mRNA and contains U1 and BBP/Mud2 associated with the 5' SS and BS, respectively. In yeast, the nuclear CBC is composed of Cbp20 and Cbp80, associates with the pre-mRNA 5' cap, and is also a member of E complex. Subsequent steps then lead to splicing. (B) Cartoon of a two-color CoSMoS experiment for observing U1 binding dynamics. The U1 snRNP contained two green-excited fluorophores attached to two different proteins while the RNA was immobilized to the slide surface and contained a single Cy5 fluorophore. (C) Graphic representation of capped RNAs with variable 5' SS used in these experiments and their corresponding label number. RNA sequences are given in Supplementary file 1. (D) Bar graph comparing the relative number of U1 binding events observed on each RNA depicted in panel (C). (E) Rastergram depicting U1 binding events on RNAs lacking a functional 5' SS (RNA 1). The rastergram represents a stack of 30 time ribbons from individual RNA molecules in which U1 binding events are shown as green bands. (F) Rastergram depicting U1 binding events on RNAs containing a functional, consensus 5' SS (RNA 3). (G) Probability density histogram of dwell times for U1 on RNAs lacking (RNA 1) and containing (RNA 3) a functional 5' SS. Lines represent fits of the distributions of dwell times to equations containing two exponential terms. (H–J) Bar graph comparison of the fit parameters (τ1, panel H; τ2, panel I; the τ2 amplitude A2, panel J) obtained from analysis of the dwell time distributions of U1 binding events on RNAs 1–4. Details of the fit parameters for data shown in (G–J) can be found in Supplementary file 2. Error bars in (D, G) represent the error in counting statistics as given by the variance of a binomial distribution. Bars in (H–J) represent the fit parameters ± S.D.

Figure 1—figure supplement 1. Examples of fluorescence intensity traces supplementing data shown in Figure 1C–J showing individual U1-SNAPf subcomplexes co-localizing with the indicated surface-tethered RNAs containing variable 5' SS sequences.
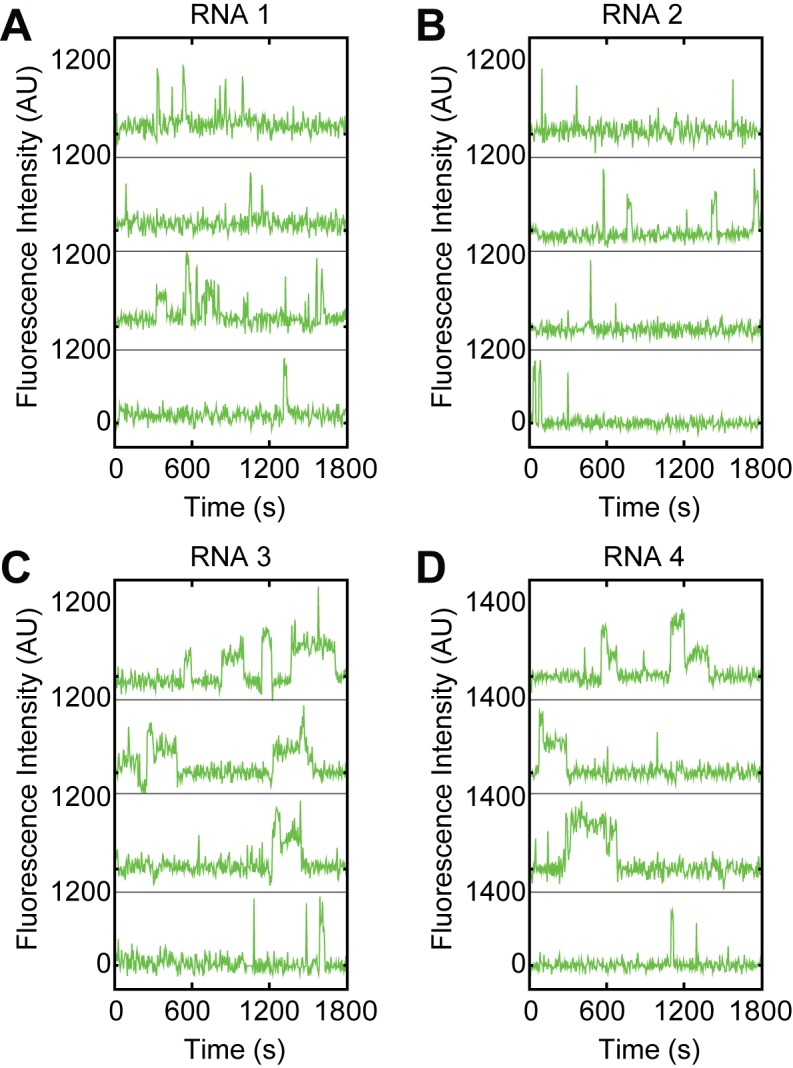
Figure 1—figure supplement 2. RNAs containing a weak 5' SS splice in vitro.
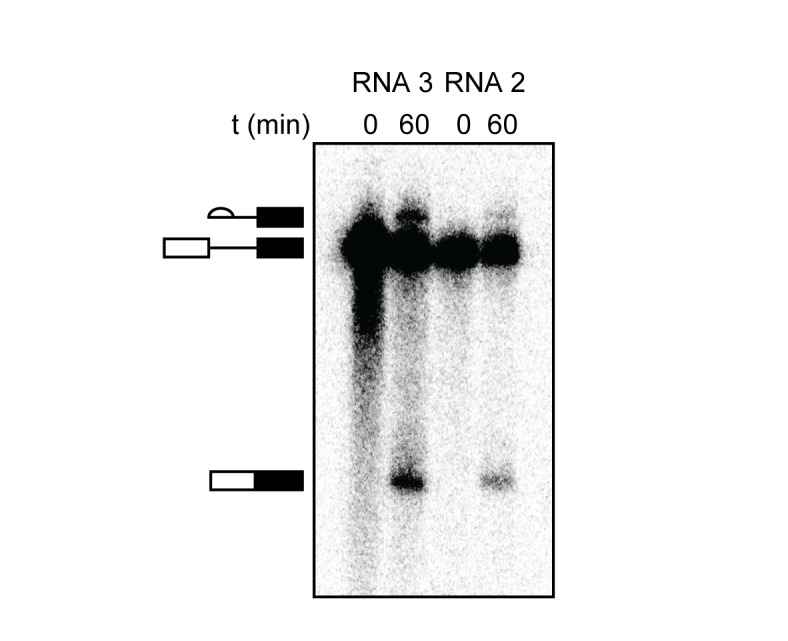
Figure 1—figure supplement 3. Single molecule analysis of U1 binding after ablation of the 5' end of the snRNA.
