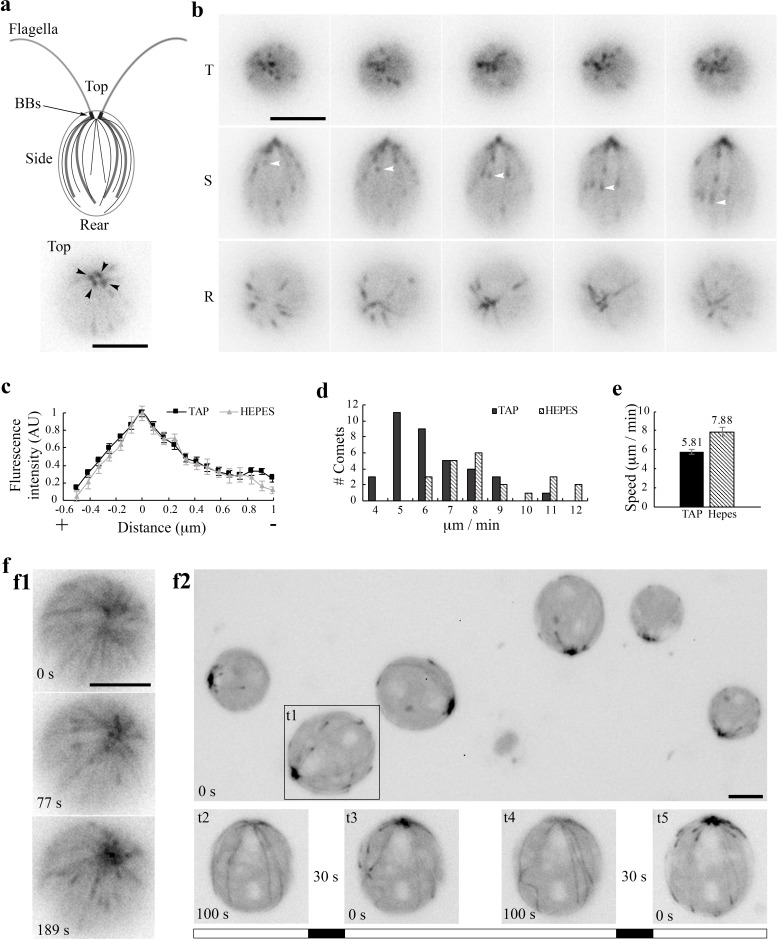
Figure 1. EB1 in Chlamydomonas.
(a) A schematic picture depicting flagella and the MT network in the cell body (top panel). Black dots, basal bodies (BB). Thick lines, four stable rootlet microtubule bundles. Thin lines in the cell body, the dynamic cortical MTs. A top view of EB1-NG transgenic cells reveals a pattern that resembles 4 BBs (bottom panel). (b) Time-lapse fluorescent images taken 10 s apart from the top (T), side (S) and rear (R) of cells resuspended in the TAP culture medium. EB1-NG appeared like typical comets (arrowheads), emerging from the BB area, coursing along the contour of the cell body and then vanishing as approaching the rear end. The frame rate was 1 frame/s. (c) Normalized line scans along the length of MT plus ends showed a similar EB1 intensity profile in the TAP medium (n = 18 comets from 6 cells) and the Na+/HEPES buffer (n = 11 comets from 3 cells). The position with peak intensity was designated as 0. The value was negative toward plus end; positive toward BBs. AU, arbitrary unit of fluorescence intensity. (d) The distribution and (e) the mean and the SEM of EB1 comet speed in the TAP medium (n = 36 comets from 6 cells in 6 recordings) and 5 mM Na+/HEPES buffer (n = 22 comets from 3 cells in 3 recordings) are significant different (Mann-Whitney U test, p<0.001). (f) Altered MT patterns during fluorescence microscopy. The EB1 comet pattern occasionally switched to a bird cage pattern (f1). Comets returned while the bird cage pattern receded in ~ 1 min. In flattened cells that were compressed by the cover slip gradually, both MTs and comets became explicit (f2, top panel). Comets disappeared after ~100 s (bottom panel, t2), but returned after illumination was switched off for 30 s (t3). The process was repeatable after another 100 s illumination and then another light off period (t4 and t5). The alternate white and black bars illustrate the scheme of alternate illumination and dark periods. Scale bars, 5 μm.

