

Abstract
Schizophrenia is a complex psychiatric disorder and many of the factors contributing to its pathogenesis are poorly understood. In addition, identifying reliable neurophysiological markers would improve diagnosis and early identification of this disease. The 22q11.2 deletion syndrome (22q11DS) is one major risk factor for schizophrenia. Here, we show further evidence that deviant temporal dynamics of EEG microstates are a potential neurophysiological marker by showing that the resting state patterns of 22q11DS are similar to those found in schizophrenia patients. The EEG microstates are recurrent topographic distributions of the ongoing scalp potential fields with temporal stability of around 80 ms that are mapping the fast reconfiguration of resting state networks. Five minutes of high-density EEG recordings was analysed from 27 adult chronic schizophrenia patients, 27 adult controls, 30 adolescents with 22q11DS, and 28 adolescent controls. In both patient groups we found increased class C, but decreased class D presence and high transition probabilities towards the class C microstates. Moreover, these aberrant temporal dynamics in the two patient groups were also expressed by perturbations of the long-range dependency of the EEG microstates. These findings point to a deficient function of the salience and attention resting state networks in schizophrenia and 22q11DS as class C and class D microstates were previously associated with these networks, respectively. These findings elucidate similarities between individuals at risk and schizophrenia patients and support the notion that abnormal temporal patterns of EEG microstates might constitute a marker for developing schizophrenia.
Keywords: Schizophrenia, 22q11.2 deletion syndrome, Endophenotype, Microstates, Resting-state
1. Introduction
Schizophrenia is one of the most devastating mental disorders. Despite thorough and intensive research its pathogenesis is still largely unknown. To better understand the pathogenesis of schizophrenia and identify susceptible genes, endophenotypes are of crucial interest (Gottesman and Gould, 2003). Endophenotypes are neurophysiological or neurocognitive measures sensitive to the underlying genetic abnormalities rather than the current state of the disease. Endophenotypes are simple, easily quantified, closer to the gene expression and brain network disturbances, and more susceptible to gene discovery, improving prevention and early diagnosis.
A large body of literature has shown abnormal patterns of resting state in schizophrenia (Menon, 2011, Palaniyappan and Liddle, 2012). Both review papers found that the anterior cingulate and the frontoinsular cortex, as part of the salience resting state network (SN), play an important role in schizophrenia by integrating, detecting and filtering pertinent internal and external stimuli as well as recruiting the appropriate networks for sensory information processing. Both models propose that dysfunctional activation of the SN via aberrant engagement of the fronto-parietal central executive resting network (CEN) is responsible for impairments of sensory information processing in schizophrenia (Menon, 2011, Palaniyappan and Liddle, 2012). We speculate that aberrant activation of salience networks could in general result in a reduced activation of sensory processing networks by altered top-down control.
Large-scale neural networks are characterised by flexible dynamics that allow for rapid reorganisation to meet the demands of a constantly changing environment (Bressler, 1995). Such changes in the sub-second time scale can be traced in real-time by electroencephalography (EEG). The EEG microstates are recurrent topographic distributions of the ongoing scalp potential fields with temporal stability of around 80 ms. The spatial configuration (the topography) and the temporal parameters (mean duration, time coverage, occurrence) of the EEG microstates are consistent across many studies and recordings and only 4 resting state EEG microstate classes (A–D) are explaining more than 80% of the data (Khanna et al., 2014, Lehmann et al., 2005). EEG microstates are proposed to be electrophysiological signatures of the typical fMRI resting state networks (RSNs), of which the class C resting EEG microstate has been linked to the salience network (SN) and the class D microstate to the central executive resting state networks (CEN) (Britz et al., 2010).
A recent study revealed that EEG microstates show scale-free behaviour measured by an index of fractality; i.e., the Hurst exponent (Van de Ville et al., 2010). The scale-free properties of microstate transitions in healthy subjects are of interest since neuropsychiatric disorders could potentially lead to a perturbation of dynamics of EEG microstates and thus affect also their fractal characteristics. To the best of our knowledge the scale-free dynamics of microstates in schizophrenia have not yet been studied. Here, we would like to investigate if the temporal dynamics of EEG microstates in schizophrenia and 22q11DS individuals exhibit any perturbations in their fractal properties. Several papers investigating resting EEG in schizophrenia reported abnormalities of the temporal patterns in EEG microstates (Kikuchi et al., 2007, Kindler et al., 2011, Koenig et al., 1999, Lehmann et al., 2005, Nishida et al., 2013). Many studies show a decreased duration of microstate class D (Andreou et al., 2014, Kikuchi et al., 2007, Koenig et al., 1999, Lehmann et al., 2005, Nishida et al., 2011), while other studies reported a decreased duration of class B and increased presence of class C (Kikuchi et al., 2007, Nishida et al., 2011).
The 22q11.2 deletion syndrome (22q11DS) is a genetic syndrome where the deletion of the locus (q11.2) on the 22nd chromosome is associated with a 30 fold increased risk to develop schizophrenia in adulthood (Murphy et al., 1999). In a previous study, we found temporal patterns of EEG microstates in 22q11.2 deletion syndrome that are in line with the literature on schizophrenia and with models of resting state dysfunction (Menon, 2011, Palaniyappan and Liddle, 2012, Tomescu et al., 2014). We found decreased class D (previously associated with central executive network CEN) and increased class C (previously associated with SN) presence and deviant transitions between microstate classes in a group of 22q11DS adolescents compared with age-matched healthy individuals (Tomescu et al., 2014). Interestingly, aberrant activation of the anterior cingulate (a key structure of the SN) was also observed during auditory stimulation in the 22q11DS adolescents compared with controls (Rihs et al., 2013). The results of both the resting state study and the auditory paradigm can be integrated in a framework, in which perception is as a state dependent process where the momentary state of the brain influences the processing of incoming stimuli. Several studies show that the pre-stimulus EEG microstate configuration is associated with the perceptual outcome (Britz and Michel, 2010, Britz and Pitts, 2011, Britz et al., 2011, Britz et al., 2014). Consequently, the deviant temporal dynamics of resting EEG microstates could reflect perturbations in networks relevant for cognitive function and could be related to cognitive impairments observed in schizophrenia and 22q11 Deletion Syndrome.
Since resting state activity seems to suggest aberrant salience and attention processing in the 22q11DS adolescents (Rihs et al., 2013, Tomescu et al., 2014), we ask whether we find similar patterns in schizophrenia patients. We specifically investigate whether there are similar differences for classes C and D microstates in 22q11DS individuals, with a genetic high-risk for developing schizophrenia, and in schizophrenia patients.
2. Methods
2.1. Subjects and procedure
This study assembled two cohorts recruited and EEG recorded under similar conditions in Switzerland and Georgia.
The cohort from Geneva was recruited at the Office Medico-Pedagogique; for more details about the inclusion/exclusion criteria of participants see Tomescu et al., 2014. Fifty-eight participants between 12 and 19 years old, 30 patients with 22q11DS (16.5 ± 2.5 years old, mean ± s.d., 17 females) and 28 healthy individuals (15.6 ± 2.3 years old, mean ± s.d., 14 females) were included. At the time of the recording, none of the 22q11DS met the diagnostic criteria for schizophrenia, however, patients were expressing psychotic symptoms (assessed by interview of the psychiatrist S.E. with the patient and parent/caregiver): 12 patients had no psychotic manifestation, 1 had isolated psychotic symptoms, 4 patients had less than one psychotic episode per month, 9 patients had at least one episode per month and 4 patients had psychotic episodes at least once per week.
The second cohort included 54 participants between 18 and 54 years old, 27 control adults (34.2 ± 8 years old; mean ± s.d.; 22 males) and 27 chronic schizophrenia patients (34.5 ± 9.5 years old; mean ± s.d.;14 males). Inpatients (n = 7) came from the Tbilisi Mental Health Hospital; outpatients (n = 20) were recruited in the Neuropsychiatric Dispensary and the Psychosocial Rehabilitation Centre in Tbilisi, Georgia. Diagnosis was made according to the Diagnostic and Statistical Manual of Mental Disorders, Fourth Edition, (DSM-IV) criteria, based on SCID-CV (Structured Clinical Interview for DSM-IV, Clinician Version). The severity of psychotic symptoms was assessed using the scale for assessment of positive (SAPS (Andreasen, 1984b)) and negative symptoms (SANS (Andreasen, 1984a)). The chronic schizophrenia patients in this study expressed positive symptoms with score values: min 3, max 16, mean = 8.7, s.d. = 3.3, and negative symptoms with score values: min 3, max 24, mean = 10.4, s.d. = 5.4. The duration since the schizophrenia diagnosis varied between 1 and 28 years with a mean duration of 10.8 years, s.d. 8.5. With one exception, all patients were treated with either clozapine (10/15/50 mg), haloperidol (10/15/30 mg), trifluoperazine (6/10/20 mg), risperidone (2/4/6 mg), quetiapine (100 mg), olanzapine (10/15 mg), fluphenazine (25 mg), chlorprothixen (12,5/25 mg) or zuclopenthixol (20 mg). Some patients were prescribed more than one antipsychotic drug. The chlorpromazine (CPZ) mean equivalent dose for the patients was 526.02 mg (s.d. = 401.6 mg). Two patients received trazodone (14 mg), 5 amitriptyline (20/25/100 mg), 1 paroxetine (20 mg), 1 fluvoxamine (50 mg), 1 citalopram (40 mg), 3 diazepam (5/10 mg), and 13 trihexyphenidyl (2/4/6 mg). The controls were recruited from the general population to match the patients with respect to age, education, and gender (see Table 1). All participants gave their informed consent before the experiment. All procedures complied with the Declaration of Helsinki and were approved by the local ethics committee.
Table 1.
Demographic table.
| 22q11 |
SZ |
Ado |
Adult |
ANOVA |
|||||||
|---|---|---|---|---|---|---|---|---|---|---|---|
| 22q11 vs. Ado | 22q11 vs. SZ | 22q11 vs. Adult | Adult vs. SZ | Adult vs. Ado | SZ vs. Ado | ||||||
| n | 30 | 27 | 28 | 27 | F(3,106) = 75,751, p = 0.000 | ||||||
| age | mean | 16.5 | 34.5 | 15.6 | 34.2 | ||||||
| s.d. | 2.5 | 9.5 | 2.3 | 8 | post-hoc | ||||||
| p = 0.67 | p = 0.00 | p = 0.00 | p = 0.84 | p = 0.00 | p = 0.00 | ||||||
| gender (F:M) | 17:13 | 5:22 | 14:14 | 13:14 | p = 0.611 | 0.716 | 0.003 | 0.01 | 0.014 | 0.89 | |
SZ = schizophrenia patients; Ado = adolescent controls; 22q11 = 22q11.2 deletion syndrome patients; Gender F = female; M = male.
2.2. EEG data acquisition
The EEG data were acquired mostly in the afternoon or early evening, always in a darkened, electrically shielded room. Participants were sitting in a comfortable, upright position and were instructed to stay awake, as calm as possible, to keep their eyes closed and to relax for five minutes. In Geneva, the EEG was recorded by a high density, 256-channel HydroCel Geodesic Sensor Net (Electrical Geodesics Inc, Eugene, USA), sampled online at 1 kHz between DC and 100Hz with a vertex reference. In Georgia, the EEG was recorded at the Mental Health Hospital in Tbilisi using a BioSemi Active 2 system (BioSemi) with 64 Ag-AgCl sintered active electrodes positioned in a cap according to the 10–20 system, referenced to the common mode sense (CMS) electrode, sampled online at 500 Hz. The electrooculogram (EOG) was recorded with electrodes positioned 1 cm above and below the right eye and 1 cm lateral to the outer canthi.
2.3. EEG data processing
The EEG datasets were band-pass filtered offline between 1 and 40 Hz. The Geneva dataset had the electrodes on the cheeks and nape excluded. The remaining 204 electrodes were kept for further analysis. In order to remove the oculomotor and cardiac artefacts, we applied the InfoMax-based Independent Component Analysis (ICA) (Jung et al., 2000). Bad electrodes were interpolated using a 3-D spherical spline (Perrin et al., 1989), and were then recomputed to the common average-reference for both datasets. The data were then down-sampled to 125 Hz for the Geneva dataset and 128 Hz for the Georgia dataset.
For the microstate analysis, the local maxima of the Global field Power (GFP) – providing best signal to noise-ratio (Pascual-Marqui et al., 1995) – were submitted to a modified k-means cluster analysis (Brunet et al., 2011, Murray et al., 2008) that identifies the most representative topographies as classes of EEG microstates. For more details about this procedure, see Tomescu et al. (2014). We computed the k-means cluster analysis first at the individual level and secondly at the group level by clustering the individual representatives of the microstate classes. Each individual subject contributed to the group map k-means cluster analysis with its first four dominant microstate classes in order to have an equal contribution of individual microstates. The best topographical representatives, the 4 prototypical microstate classes for each group were then kept for further analysis.
To validate if the 4 representative microstate classes were comparable across groups, we computed the topographical ANOVA (TANOVA) (Lehmann and Skrandies, 1980, Murray et al., 2008). The TANOVA is a non-parametric permutation test that allows to investigate statistical differences between EEG map topographies by means of the map dissimilarity between the maps after multiple shuffling and permutations of individual maps (Koenig et al., 2014). Subsequently, each time-point of each participant’s artefact-corrected EEG was assigned to one of four classes of group microstate maps on a best correlation basis (Brunet et al., 2011, Murray et al., 2008). This process allows to quantify the temporal parameters for each microstate class in each subject and yields measures such as mean duration, time coverage, frequency of occurrence, and global explained variance (GEV). The mean duration is the averaged amount of time (in ms) that a microstate class was continuously present, whereas the total time coverage represents the global, summed amount of time of one microstate class. The frequency of occurrence indicates how many times a microstate class is recurring per second, and the global explained variance (GEV) is the sum of the explained variances of each microstate weighted by the global field power (GFP).
The free academic software Cartool (brainmapping.unige.ch/cartool) was used for the microstate analysis (Brunet et al., 2011). For each microstate parameter (mean duration, time coverage, frequency of occurrence, and GEV) a two-way repeated measures ANOVA with two factors: group (22q11DS, adolescent controls, schizophrenia patients, adult controls), and microstate class (A, B, C, D) was performed.
The EEG microstate syntax (Lehmann et al., 2005) was analysed by calculating, at each time point, the transition probabilities between the different microstate classes and compared the probabilities between the groups as in Gartner et al. (2015) and Tomescu et al. (2014)).
Finally we investigated the fractal characteristics of the EEG microstate sequences using a modified version of the method described in Van de Ville et al. (2010). Specifically, the analysis was performed by first constructing a multidimensional random walk for each subject, followed by fractal analysis in order to estimate the Hurst exponents (Karahanoglu et al., 2014). We performed multivariate ANOVA (MANOVA) on the Hurst exponents in order to identify if there are any perturbations in their fractal behaviour.
3. Results
The 4 dominant microstate classes, markedly resembled those that were previously described in the literature (Britz et al., 2010, Koenig et al., 1999, Lehmann et al., 2005, Nishida et al., 2013, Strelets et al., 2003) and explained more than 80% of the global variance in each group (84.1% in the adolescent control group, 80.7% in the 22q11DS group, 83.9% in the adult control group and 85% in the schizophrenia patients). The four microstate classes were thus categorised as class A, B, C, and D in accordance with the literature.
To ensure that the 4 microstate classes were topographically similar between the clinical group and their corresponding controls we performed spatial correlation analysis between each group’s microstate class topography. Between the 22q11DS and adolescent controls we found correlation coefficients of 0.92 (A-A), 0.97 (B-B), 0.95 (C-C) and 0.88 (D-D) (see Tomescu et al. (2014)). Between patients with schizophrenia and adult controls the correlation coefficients between the corresponding microstate classes were: 0.97 (A-A), 0.98 (B-B), 0.94 (C-C) and 0.91 (D-D). Additionally, we performed TANOVA analyses for each corresponding microstate class (e.g., class A of controls vs. class A of patients). As expected, none of these tests was significant (p > 0.05).
We performed a two-way repeated measures ANOVA for each microstate (means and standard deviations are reported in Table 2). There was a significant main effect of group for time coverage and a significant group × microstate interaction for all microstate parameters: mean duration (F(9,234) = 6.87, p = 0.000, time coverage (F(9,234) = 8.5, p = 0.000), frequency of occurrence (F(9,234) = 8.91, p = 0.000), and Global Explained Variance(GEV)(F(9,234) = 12.1, p = 0.000) (see Table 2). Post hoc tests revealed significant group differences for class C, and D microstate, as shown in Fig. 1. For mean duration (22q11DS vs. controls p = 0.003; SZ vs controls p = 0.0001), GEV (22q11DS vs. controls p = 0.0004; SZ vs controls p = 0.000) and time coverage (22q11DS vs. controls p = 0.002; SZ vs controls p = 0.0001), the Class C microstate showed a significantly increased duration for both the 22q11DS and the schizophrenia patients compared to controls. The frequency of occurrence of class C was also significantly increased (22q11DS vs. controls p = 0.01; SZ vs controls p = 0.01) in both patient groups compared to their corresponding controls. Class D microstate showed a decreased duration in both clinical groups compared to their controls: mean duration (22q11DS vs. controls p = 0.09; SZ vs controls p = 0.03), frequency of occurrence (22q11DS vs. controls p = 0.009; SZ vs controls p = 0.0004), time coverage (22q11DS vs. controls p = 0.03 SZ vs controls p = 0.002) and GEV (22q11DS vs. controls p = 0.0002; SZ vs controls p = 0.00003).
Table 2.
Results of microstate analysis of classes A, B, C and D for each of the temporal parameters (mean duration, frequency of occurrence, time coverage and global explained variance): mean ± s.d.
| A | B | C | D | A | B | C | D | ||
|---|---|---|---|---|---|---|---|---|---|
| Mean Duration (ms) | Frequency of occurrence | ||||||||
| 22q11DS mean | 45.4 | 43.5 | 69.6 | 45.2 | 22q11DS mean | 4.5 | 4.4 | 5.9 | 3.7 |
| s.d. | 6.1 | 6.3 | 18.7 | 11.6 | s.d. | 1 | 0.9 | 0.7 | 1.5 |
| ADO mean | 44.3 | 47.1 | 60.7 | 51.8 | ADO mean | 4.2 | 4.7 | 5.2 | 4.5 |
| s.d. | 5.1 | 7.3 | 15.6 | 16.1 | s.d. | 0.7 | 0.6 | 1 | 1.6 |
| SZ mean | 41.4 | 44.1 | 61.5 | 51.6 | SZ mean | 4 | 4.4 | 5.6 | 4.9 |
| s.d. | 4.7 | 7.2 | 16.2 | 11.33 | s.d. | 1 | 0.9 | 0.6 | 1 |
| Adults mean | 41 | 44.9 | 49.1 | 58.2 | Adults mean | 4.2 | 4.7 | 5 | 5.8 |
| s.d. | 5.6 | 7.5 | 8.8 | 12.8 | s.d. | 1 | 0.9 | 0.6 | 0.8 |
| Time coverage % | Global explained variance | ||||||||
| 22q11DS mean | 21 | 19.2 | 41.4 | 18.5 | 22q11DS mean | 0.08 | 0.06 | 0.27 | 0.06 |
| s.d. | 6.1 | 5.2 | 10.5 | 10.7 | s.d. | 0.03 | 0.03 | 0.1 | 0.05 |
| ADO mean | 19 | 22.5 | 32.9 | 25.4 | ADO mean | 0.07 | 0.1 | 0.19 | 0.14 |
| s.d. | 4.2 | 5.7 | 13 | 14.5 | s.d. | 0.02 | 0.04 | 0.1 | 0.09 |
| SZ mean | 17.2 | 20.3 | 35.8 | 26.5 | SZ mean | 0.05 | 0.09 | 0.22 | 0.11 |
| s.d. | 5.5 | 6.4 | 10 | 9.3 | s.d. | 0.02 | 0.04 | 0.09 | 0.006 |
| Adults mean | 18 | 22 | 25.2 | 34.7 | Adults mean | 0.06 | 0.09 | 0.12 | 0.19 |
| s.d. | 5.1 | 5.6 | 5.5 | 7.9 | s.d. | 0.02 | 0.03 | 0.04 | 0.07 |
ADO = adolescent controls; SZ = schizophrenia patients.
Fig. 1.

Results of the microstate analysis reveal temporal differences between groups. In the four graphs, blue bars represent the control adolescents, orange bars the 22q11DS adolescent patients, purple bars the adult controls, and red ones the schizophrenia patients. 1. The spatial configuration of the four microstate classes (A, B, C, D) across groups. 2–5. The temporal microstate parameters frequency of occurrence, mean duration, time coverage and global explained variance (GEV) are significantly different across groups for microstate classes C and D. 3. Missing star on horizontal bar marks a statistical trend (p = 0.09). Error bars indicate the standard deviation (see Table 2).
The analysis of microstate syntax by means of transition probabilities revealed changes in the patient groups that were consistent with the microstate analysis results. In both patient groups the transitions to microstate class C increased as compared to their corresponding control group. As shown in Fig. 2, we observed significantly increased transition probabilities from class B to class C in 22q11DS compared to age-matched controls (mean 22q11DS = 0.091, s.d. = 0.023; mean adolescent controls = 0.067, s.d. = 0.025; T(df = 56) = 3.919; p < 0.003). In patients with schizophrenia with respect to adult controls the transition to class C microstates was more likely from all the three other classes as well as from class C to itself; see Table 3. Conversely, in control adults the transition to class D microstates was more likely from all the three other classes; see Table 3.
Fig. 2.
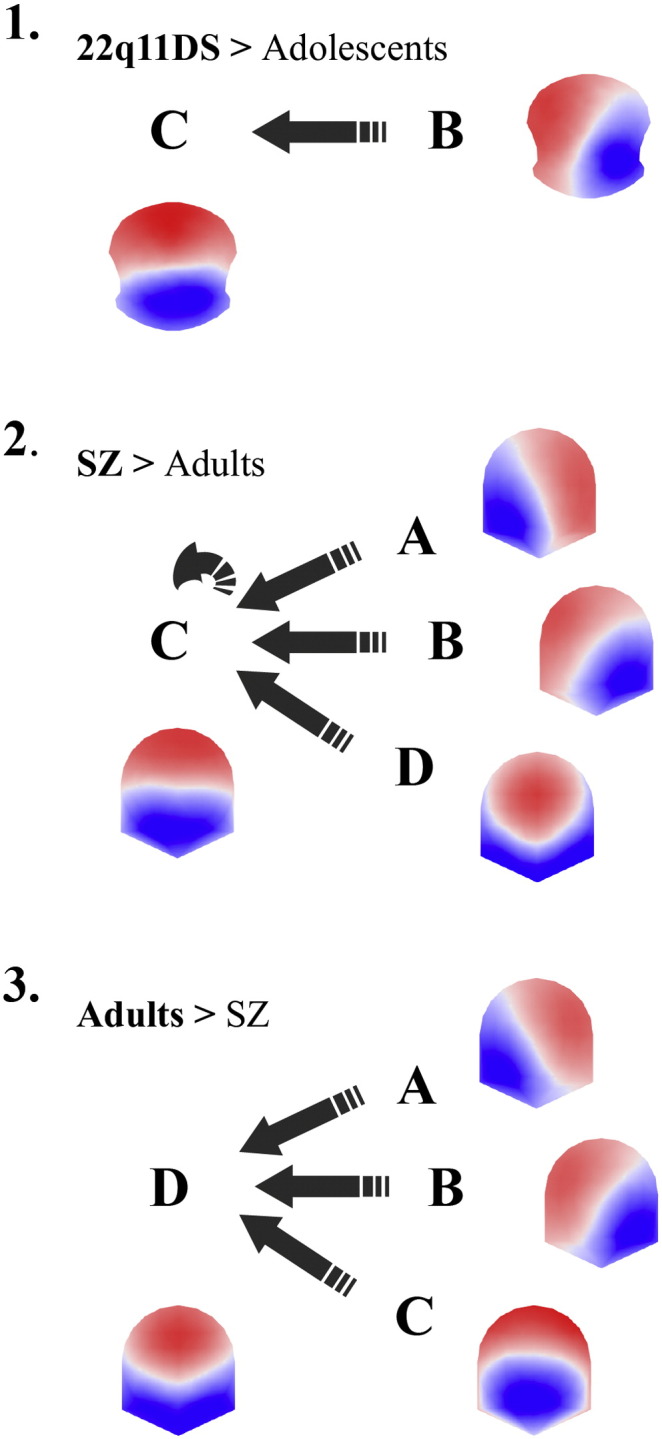
Microstate syntax analysis shows significant differences in transition probabilities between patient and control groups. 1. Dark arrows indicate significant increases in transition probabilities from microstate class B towards class C in the 22q11DS patients compared to adolescent controls. 2. Similarly, syntax transitions of SZ are significantly increased from A, B, C and D microstate classes toward the class C microstate of adult controls. 3. Conversely, adult controls show significant increased transition probabilities from A, B and C microstate classes towards class D microstate when compared with SZ. SZ = schizophrenia patients.
Table 3.
Significant results of syntax analysis between schizophrenia patients and adult controls: mean ± s.d. transition probabilities, t-test and p-values.
| Adult Controls |
SZ |
|||||
|---|---|---|---|---|---|---|
| mean | s.d. | mean | s.d. | t-test (df = 52) | p value | |
| A to C | 0.059 | 0.01 | 0.077 | 0.017 | − 4.49 | 0.00004 |
| B to C | 0.055 | 0.01 | 0.075 | 0.017 | − 5.03 | 0.000006 |
| C to C | 0.83 | 0.029 | 0.86 | 0.033 | − 3.44 | 0.001 |
| D to C | 0.051 | 0.012 | 0.07 | 0.019 | − 4.24 | 0.00009 |
| A to D | 0.076 | 0.02 | 0.057 | 0.017 | 3.66 | 0.0005 |
| B to D | 0.074 | 0.02 | 0.057 | 0.018 | 3.27 | 0.001 |
| C to D | 0.074 | 0.018 | 0.053 | 0.018 | 4.25 | 0.00008 |
SZ = schizophrenia patients.
Fractal analysis of the microstates showed no significant group effects between the control adolescents and 22q11DS group as well as between the control adults and schizophrenia patients. However, individual post-hoc analysis provided significant differences of the Hurst exponents within the patients with schizophrenia (p = 0.014) group, as well as within the 22q11DS group (p = 0.0005). The post-hoc analysis did not yield any differences of Hurst exponents within the control groups.
4. Discussion
We compared EEG microstates of chronic adult schizophrenia patients with a high-risk population of adolescents affected by the 22q11DS. Consistent with previous findings in schizophrenia patients, we found decreased class D duration compared to controls (Kikuchi et al., 2007, Kindler et al., 2011, Koenig et al., 1999, Lehmann et al., 2005, Nishida et al., 2013). We found no difference with respect to class B microstates as previously reported in patients with schizophrenia and clinical high-risk populations (Andreou et al., 2014, Lehmann et al., 2005, Nishida et al., 2013, Strelets et al., 2003). The difference may be explained by methodological differences, such as remission of symptoms (see Andreou et al., 2014) or/and medication effects as class B microstate differences were reported only on un-medicated patients (Andreou et al., 2014, Lehmann et al., 2005, Nishida et al., 2013, Strelets et al., 2003).
The class D microstate has been previously related to focal attention (Brandeis and Lehmann, 1989) and was associated with the central-executive network (CEN) anchored in the dorsolateral prefrontal cortex and the posterior parietal cortex (Britz et al., 2010). The CEN network is responsible for high-level cognitive functioning such as decision making, control of attention and working memory, cognitive processes which are impaired in schizophrenia patients and 22q11DS (Lewandowski et al., 2007). Moreover, dysfunction of the CEN is proposed to play an important role in the emergence of many psychiatric diseases like schizophrenia (Menon, 2011, Palaniyappan and Liddle, 2012). This model explains how inappropriate engagement and disengagement of different resting state networks lead to impoverished cognition and goal-relevant adaptive behaviour in these patients. However, further investigations are needed to study the effects of other networks such as the limbic system involving reward and motivational processes.
Related to clinical symptoms, a decreased microstate class D duration was observed while schizophrenia patients were self-reporting auditory hallucinations (Kindler et al., 2011), and another study reports negative correlations of microstate class D duration with positive, paranoid symptoms (Koenig et al., 1999). These findings led to the proposal that microstate class D might not reflect specific symptoms per se but that it rather subserves a protective function when present for a sufficient duration as precocious termination of this state was observed while patients were experiencing positive symptoms (Kindler et al., 2011).
We also found increased class C microstate occurrence, mean duration, time coverage and GEV in patients with schizophrenia, which has also been reported in some of the previous papers on microstates in schizophrenia (Kikuchi et al., 2007, Lehmann et al., 2005, Nishida et al., 2013). The increased class C duration in both schizophrenia patients and 22q11DS adolescents with respect to age-matched controls could explain the increased risk of 22q11DS adolescents to develop schizophrenia. The class C microstate was related to the salience RSN, a network comprised of core activations in the bilateral insula and the anterior cingulate cortex (Britz et al., 2010). Auditory task activations of the anterior cingulate followed by a downstream reduction of auditory activity in 22q11DS seem to suggest a deficit of salience processing in this population (Rihs et al., 2013). Functionally, the salience RSN was shown to be involved in the detection and orientation towards relevant internal and external stimuli (Menon, 2011). Numerous functional and structural studies reported salience dysfunctions in schizophrenia and a recent model is proposing the important role of the salience RSN in recruiting networks crucial for optimal information processing (Menon, 2011, Palaniyappan and Liddle, 2012). Hence, the salience network dysfunction would be responsible for the emergence of psychotic symptoms, such as active auditory hallucinations, which were associated with increased activation in nodes of the SN (Jardri et al., 2011, Palaniyappan and Liddle, 2012). The results of our study are in line with this model since we observe deviances in resting activity of two microstate classes associated with the salience and the CEN RSNs both in the schizophrenia as well in the ultra-high-risk 22q11DS group.
Our fractal analysis investigated the long-range temporal dependencies of EEG microstates. The index of fractality, the Hurst exponent, is not linked to a specific microstate class, but depends on the interactions between all four of them. A previous study on healthy controls showed that the Hurst exponent does not significantly differ across healthy individuals (Van de Ville et al., 2010). Here, we replicated the same result for our controls, but found significant differences of the Hurst exponents within the patient groups. These differences suggest that disturbances in the temporal dynamics of microstates are reflected by significant differences of Hurst exponent in both the 22q11DS and schizophrenia patients. Importantly, this result suggests that the efficiency of the global dynamics of EEG microstates was preserved and could point to a compensatory mechanism between the class C and D microstates. Thus, the deviant temporal dynamics of EEG microstates in clinical populations could explain differences in information processing strategies, while a disruption of the long range dependency of the resting state dynamics would only occur in more pronounced alterations of the functional activity such as during unconscious states.
Moreover, the results of the syntax analysis suggest that in schizophrenia patients the increased class C duration is probably explained by the significant transitions from all other classes towards the class C microstate, while in healthy adults there is a significant transition pattern from all other classes towards class D (see Fig. 2.3 and 2.4). Another study reported more transitions in individuals with schizophrenia from class D to class C and in reverse for the adult controls (Nishida et al., 2013). Interestingly, in the 22q11DS, we also find increased transition probabilities from class B to class C compared to adolescent controls. We could speculate that while the salience RSN is optimally recruiting the target networks in healthy adults, in schizophrenia a disconnection could be expressed by recurrent transitions towards the salience RSN in an effort to recruit the required networks. The fact that the same dynamics are observed in our ultra-high-risk population with 22q11DS could be indicative of a key mechanism in temporal network dynamics shared by 22q11DS and schizophrenia.
Certain limitations of this study should be taken into account. First of all, age is an important factor as it has been shown that microstate parameters vary with age and conclusions should be drawn with care in this regard (Koenig et al., 2002). Schizophrenia and the 22q11DS are both very heterogeneous diseases and differences in medication in the patient populations are unavoidable. However, it seems that antipsychotic medication only affects the EEG microstates in a subset of schizophrenia patients and in such a way that it could not explain the results here (Kikuchi et al., 2007). In addition, differences in co-occurring medical conditions in 22q11DS also need to be considered; even though we found no influence of these factors on previous microstate results in 22q11DS, we cannot completely rule out the influence of these factors (Tomescu et al., 2014).
While we currently have no information on the resting microstate dynamics in relatives of schizophrenia patients and the heritability of these patterns, deviant EEG microstate dynamics of classes C and D are a promising endophenotype candidate for schizophrenia, which could help to distinguish individuals at risk and allow for early therapeutic intervention strategies.
Role of Funding Source
This study was supported by the Swiss National Science Foundation (310030-132952 to C. M., 324730-121996 to S. E., PP00P2-146318 to D.V.D.V.), by the EPFL-HU Framework Grant (to F.I.K.), by the National Centres of Competence in Research (NCCR) “SYNAPSY—The Synaptic Basis of Mental Diseases”, and by the ANR (ANR IBM ANR-12-PDOC-0008-01) to Céline Cappe.
Conflict of Interest
None of the authors have any conflict of interest to report.
Acknowledgements
The authors would like to thank all the families who kindly volunteered for this study as well as the family associations Génération 22 and Connect 22. We also extend our special thanks to Déborah Badoud, Eleonora Rizzi, Gloria Azinhaga, Juliette Bleiker and Martina Franchini for their help in data collection and processing.
The Cartool software (brainmapping.unige.ch/cartool) has been programmed by Denis Brunet, from the Functional Brain Mapping Laboratory, Geneva, Switzerland, and is supported by the Center for Biomedical Imaging (CIBM) from Geneva and Lausanne.
References
- Andreasen N.C. University of Iowa; Iowa City: 1984. Scale for the Assessment of Negative Symptoms (SANS) [Google Scholar]
- Andreasen N.C. University of Iowa; Iowa City: 1984. Scale for the Assessment of Positive Symptoms (SANS) [Google Scholar]
- Andreou C., Faber P.L., Leicht G., Schoettle D., Polomac N., Hanganu-Opatz I.L., Lehmann D., Mulert C. Resting-state connectivity in the prodromal phase of schizophrenia: insights from EEG microstates. Schizophr. Res. 2014;152:513–520. doi: 10.1016/j.schres.2013.12.008. [DOI] [PubMed] [Google Scholar]
- Brandeis D., Lehmann D. Segments of event-related potential map series reveal landscape changes with visual attention and subjective contours. Electroencephalogr. Clin. Neurophysiol. 1989;73:507–519. doi: 10.1016/0013-4694(89)90260-5. [DOI] [PubMed] [Google Scholar]
- Bressler S.L. Large-scale cortical networks and cognition. Brain Res. Brain Res. Rev. 1995;20:288–304. doi: 10.1016/0165-0173(94)00016-i. [DOI] [PubMed] [Google Scholar]
- Britz J., Michel C.M. Errors can be related to pre-stimulus differences in ERP topography and their concomitant sources. Neuroimage. 2010;49:2774–2782. doi: 10.1016/j.neuroimage.2009.10.033. [DOI] [PubMed] [Google Scholar]
- Britz J., Pitts M.A. Perceptual reversals during binocular rivalry: ERP components and their concomitant source differences. Psychophysiology. 2011;48:1490–1499. doi: 10.1111/j.1469-8986.2011.01222.x. [DOI] [PubMed] [Google Scholar]
- Britz J., Van De Ville D., Michel C.M. BOLD correlates of EEG topography reveal rapid resting-state network dynamics. Neuroimage. 2010;52:1162–1170. doi: 10.1016/j.neuroimage.2010.02.052. [DOI] [PubMed] [Google Scholar]
- Britz J., Pitts M.A., Michel C.M. Right parietal brain activity precedes perceptual alternation during binocular rivalry. Hum. Brain Mapp. 2011;32:1432–1442. doi: 10.1002/hbm.21117. [DOI] [PMC free article] [PubMed] [Google Scholar]
- Britz J., Diaz Hernandez L., Ro T., Michel C.M. EEG-microstate dependent emergence of perceptual awareness. Front Behav Neurosci. 2014;8:163. doi: 10.3389/fnbeh.2014.00163. [DOI] [PMC free article] [PubMed] [Google Scholar]
- Brunet D., Murray M.M., Michel C.M. Spatiotemporal analysis of multichannel EEG: CARTOOL. Comput. Intell. Neurosci. 2011;2011:813870. doi: 10.1155/2011/813870. [DOI] [PMC free article] [PubMed] [Google Scholar]
- Gartner M., Brodbeck V., Laufs H., Schneider G. A stochastic model for EEG microstate sequence analysis. Neuroimage. 2015;104:199–208. doi: 10.1016/j.neuroimage.2014.10.014. [DOI] [PubMed] [Google Scholar]
- Gottesman I.I., Gould T.D. The endophenotype concept in psychiatry: etymology and strategic intentions. Am. J. Psychiatry. 2003;160:636–645. doi: 10.1176/appi.ajp.160.4.636. [DOI] [PubMed] [Google Scholar]
- Jardri R., Pouchet A., Pins D., Thomas P. Cortical activations during auditory verbal hallucinations in schizophrenia: a coordinate-based meta-analysis. Am. J. Psychiatry. 2011;168:73–81. doi: 10.1176/appi.ajp.2010.09101522. [DOI] [PubMed] [Google Scholar]
- Jung T.P., Makeig S., Westerfield M., Townsend J., Courchesne E., Sejnowski T.J. Removal of eye activity artifacts from visual event-related potentials in normal and clinical subjects. Clin. Neurophysiol. 2000;111:1745–1758. doi: 10.1016/s1388-2457(00)00386-2. [DOI] [PubMed] [Google Scholar]
- Karahanoglu F.I., Cuendet G., Tomescu M.I., Deouell L., Britz J., Van De Ville D. Multidimensional random walk embedding of state sequences: application to EEG microstates. IEEE Trans. Biomed. Eng. 2015 in revision. [Google Scholar]
- Khanna A., Pascual-Leone A., Farzan F. Reliability of resting-state microstate features in electroencephalography. PLoS One. 2014;9:e114163. doi: 10.1371/journal.pone.0114163. [DOI] [PMC free article] [PubMed] [Google Scholar]
- Kikuchi M., Koenig T., Wada Y., Higashima M., Koshino Y., Strik W., Dierks T. Native EEG and treatment effects in neuroleptic-naive schizophrenic patients: time and frequency domain approaches. Schizophr. Res. 2007;97:163–172. doi: 10.1016/j.schres.2007.07.012. [DOI] [PubMed] [Google Scholar]
- Kindler J., Hubl D., Strik W.K., Dierks T., Koenig T. Resting-state EEG in schizophrenia: auditory verbal hallucinations are related to shortening of specific microstates. Clin. Neurophysiol. 2011;122:1179–1182. doi: 10.1016/j.clinph.2010.10.042. [DOI] [PubMed] [Google Scholar]
- Koenig T., Lehmann D., Merlo M.C., Kochi K., Hell D., Koukkou M. A deviant EEG brain microstate in acute, neuroleptic-naive schizophrenics at rest. Eur. Arch. Psychiatry Clin. Neurosci. 1999;249:205–211. doi: 10.1007/s004060050088. [DOI] [PubMed] [Google Scholar]
- Koenig T., Prichep L., Lehmann D., Sosa P.V., Braeker E., Kleinlogel H., Isenhart R., John E.R. Millisecond by millisecond, year by year: normative EEG microstates and developmental stages. Neuroimage. 2002;16:41–48. doi: 10.1006/nimg.2002.1070. [DOI] [PubMed] [Google Scholar]
- Koenig T., Stein M., Grieder M., Kottlow M. A tutorial on data-driven methods for statistically assessing ERP topographies. Brain Topogr. 2014;27:72–83. doi: 10.1007/s10548-013-0310-1. [DOI] [PubMed] [Google Scholar]
- Lehmann D., Skrandies W. Reference-free identification of components of checkerboard-evoked multichannel potential fields. Electroencephalogr. Clin. Neurophysiol. 1980;48:609–621. doi: 10.1016/0013-4694(80)90419-8. [DOI] [PubMed] [Google Scholar]
- Lehmann D., Faber P.L., Galderisi S., Herrmann W.M., Kinoshita T., Koukkou M., Mucci A., Pascual-Marqui R.D., Saito N., Wackermann J., Winterer G., Koenig T. EEG microstate duration and syntax in acute, medication-naive, first-episode schizophrenia: a multi-center study. Psychiatry Res. 2005;138:141–156. doi: 10.1016/j.pscychresns.2004.05.007. [DOI] [PubMed] [Google Scholar]
- Lewandowski K.E., Shashi V., Berry P.M., Kwapil T.R. Schizophrenic-like neurocognitive deficits in children and adolescents with 22q11 deletion syndrome. Am. J. Med. Genet. B Neuropsychiatr. Genet. 2007;144B:27–36. doi: 10.1002/ajmg.b.30379. [DOI] [PubMed] [Google Scholar]
- Menon V. Large-scale brain networks and psychopathology: a unifying triple network model. Trends Cogn. Sci. 2011;15:483–506. doi: 10.1016/j.tics.2011.08.003. [DOI] [PubMed] [Google Scholar]
- Murphy K.C., Jones L.A., Owen M.J. High rates of schizophrenia in adults with velo-cardio-facial syndrome. Arch. Gen. Psychiatry. 1999;56:940–945. doi: 10.1001/archpsyc.56.10.940. [DOI] [PubMed] [Google Scholar]
- Murray M.M., Brunet D., Michel C.M. Topographic ERP analyses: a step-by-step tutorial review. Brain Topogr. 2008;20:249–264. doi: 10.1007/s10548-008-0054-5. [DOI] [PubMed] [Google Scholar]
- Nishida K., Yoshimura M., Isotani T., Yoshida T., Kitaura Y., Saito A., Mii H., Kato M., Takekita Y., Suwa A., Morita S., Kinoshita T. Differences in quantitative EEG between frontotemporal dementia and Alzheimer's disease as revealed by LORETA. Clin. Neurophysiol. 2011;122:1718–1725. doi: 10.1016/j.clinph.2011.02.011. [DOI] [PubMed] [Google Scholar]
- Nishida K., Morishima Y., Yoshimura M., Isotani T., Irisawa S., Jann K., Dierks T., Strik W., Kinoshita T., Koenig T. EEG microstates associated with salience and frontoparietal networks in frontotemporal dementia, schizophrenia and Alzheimer's disease. Clin. Neurophysiol. 2013;124:1106–1114. doi: 10.1016/j.clinph.2013.01.005. [DOI] [PubMed] [Google Scholar]
- Palaniyappan L., Liddle P.F. Does the salience network play a cardinal role in psychosis? An emerging hypothesis of insular dysfunction. J. Psychiatry Neurosci. 2012;37:17–27. doi: 10.1503/jpn.100176. [DOI] [PMC free article] [PubMed] [Google Scholar]
- Pascual-Marqui R.D., Michel C.M., Lehmann D. Segmentation of brain electrical activity into microstates: model estimation and validation. IEEE Trans. Biomed. Eng. 1995;42:658–665. doi: 10.1109/10.391164. [DOI] [PubMed] [Google Scholar]
- Perrin F., Pernier J., Bertrand O., Echallier J.F. Spherical splines for scalp potential and current density mapping. Electroencephalogr. Clin. Neurophysiol. 1989;72:184–187. doi: 10.1016/0013-4694(89)90180-6. [DOI] [PubMed] [Google Scholar]
- Rihs T.A., Tomescu M.I., Britz J., Rochas V., Custo A., Schneider M., Debbane M., Eliez S., Michel C.M. Altered auditory processing in frontal and left temporal cortex in 22q11.2 deletion syndrome: a group at high genetic risk for schizophrenia. Psychiatry Res. 2013;212:141–149. doi: 10.1016/j.pscychresns.2012.09.002. [DOI] [PubMed] [Google Scholar]
- Strelets V., Faber P.L., Golikova J., Novototsky-Vlasov V., Koenig T., Gianotti L.R., Gruzelier J.H., Lehmann D. Chronic schizophrenics with positive symptomatology have shortened EEG microstate durations. Clin. Neurophysiol. 2003;114:2043–2051. doi: 10.1016/s1388-2457(03)00211-6. [DOI] [PubMed] [Google Scholar]
- Tomescu M.I., Rihs T.A., Becker R., Britz J., Custo A., Grouiller F., Schneider M., Debbane M., Eliez S., Michel C.M. Deviant dynamics of EEG resting state pattern in 22q11.2 deletion syndrome adolescents: a vulnerability marker of schizophrenia? Schizophr. Res. 2014;157:175–181. doi: 10.1016/j.schres.2014.05.036. [DOI] [PubMed] [Google Scholar]
- Van De Ville D., Britz J., Michel C.M. EEG microstate sequences in healthy humans at rest reveal scale-free dynamics. Proc. Natl. Acad. Sci. U. S. A. 2010;107:18179–18184. doi: 10.1073/pnas.1007841107. [DOI] [PMC free article] [PubMed] [Google Scholar]