

Abstract
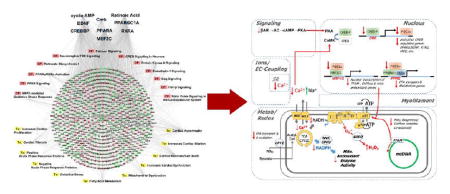
Here, we examine key regulatory pathways underlying the transition from compensated hypertrophy (HYP) to decompensated heart failure (HF) and sudden cardiac death (SCD) in a guinea pig pressure-overload model by integrated multiome analysis. Relative protein abundances from sham-operated HYP and HF hearts were assessed by iTRAQ LC–MS/MS. Metabolites were quantified by LC–MS/MS or GC–MS. Transcriptome profiles were obtained using mRNA microarrays. The guinea pig HF proteome exhibited classic biosignatures of cardiac HYP, left ventricular dysfunction, fibrosis, inflammation, and extravasation. Fatty acid metabolism, mitochondrial transcription/translation factors, antioxidant enzymes, and other mitochondrial procsses, were downregulated in HF but not HYP. Proteins upregulated in HF implicate extracellular matrix remodeling, cytoskeletal remodeling, and acute phase inflammation markers. Among metabolites, acylcarnitines were downregulated in HYP and fatty acids accumulated in HF. The correlation of transcript and protein changes in HF was weak (R2 = 0.23), suggesting post-transcriptional gene regulation in HF. Proteome/metabolome integration indicated metabolic bottlenecks in fatty acyl-CoA processing by carnitine palmitoyl transferase (CPT1B) as well as TCA cycle inhibition. On the basis of these findings, we present a model of cardiac decompensation involving impaired nuclear integration of Ca2+ and cyclic nucleotide signals that are coupled to mitochondrial metabolic and antioxidant defects through the CREB/PGC1α transcriptional axis.
Keywords: heart failure, hypertrophy, mass spectrometry, median sweep, metabolic bottleneck, metabolome, pathway analysis, proteome, proteomics, transcriptome
Graphical Abstract
INTRODUCTION
Heart failure (HF) is increasing in prevalence (5.1 million) and incidence (>825 000 new cases per year) in the United States as the general population ages.1 It is the most common inpatient diagnosis in patients over 65, and alarmingly, the prevalence of HF is projected to increase to 8 million people by 2030.2 Despite advances in treatment, mortality is ~50% within 5 years of diagnosis, and up to half of these deaths are from sudden cardiac death (SCD), while the rest occur after progressive cardiac decompensation.3 Mechanistic understanding of HF/SCD has been hindered by a paucity of experimental models with the SCD component of the human disease, perhaps contributing to the limited number of new therapeutic strategies developed over the past few decades.
We recently developed a novel guinea pig model of cardiac hypertrophy (HYP) and HF that employs a combination of ascending aortic constriction and daily β-adrenergic stimulation with isoproterenol (ACi model).4 This model exhibits early-acquired long QT syndrome during a compensated hypertrophy phase followed by progressive functional decline starting 2 weeks postconstriction. Interestingly, arrhythmias leading to spontaneous SCD were also observed, a particularly relevant finding given that the electrophysiological and Ca2+ handling properties of the guinea pig are known to be closer to the human phenotype than those of other rodents.5 Guinea pig electrocardiograms sufficiently resemble those of humans6 to permit the study of QT alterations and arrhythmias associated with HF, and beat-to-beat Ca2+ handling is also much more representative of human physiology than that of rats or mice.7 A further advantage is that computational models of the guinea pig cardiomyocyte are well-developed, incorporating the major subsystems of the cell, including energetics and reactive oxygen species (ROS) metabolism.8
Developing new avenues for rational therapeutic intervention requires a comprehensive understanding of how the heart is remodeled during the progression from HYP to HF. Over the past decade and a half, transcriptomic or microarray profiling has provided information about modifications of gene expression that support current paradigms driving HF research, including impaired energy metabolism, calcium-handling defects, the role of ROS, and extracellular matrix remodeling.9 Proteomic analysis further extends our inferential vision, first by providing information about the final gene product, the protein, rather than its transcript and also by its capacity to identify and quantify changes in post-translational modifications. Until recently, however, the bulk of proteomic HF profiling studies have been conducted at either the level of specific organellar subproteomes10 or by characterization of the most abundant highly soluble proteins amenable to characterization by two-dimensional (2D) gel electrophoresis techniques (see ref 11 for early examples of the >50 studies of HF across etiologies and species). Indeed, striated muscle has presented unique challenges to global proteomic characterization, as the top 100 most abundant proteins typically account for greater than 65% of total protein in shotgun experiments,12 thereby limiting proteome depth. Nevertheless, over the past few years improvements in mass spectrometry instrumentation, sample preparation, and evolving best practices for robust protein quantitation and statistical analysis have made deep, global-scale quantitative cardiac proteomics tractable.13
Cardiac metabolomics, the high-throughput identification and quantification of biological metabolites of different classes, is another tool for examining changes in cardiac metabolism in HF, a topic of much interest over the past 50 years.14 As in the field of proteomics, advances in both hardware and software have led to increased analyte coverage; therefore, it is now feasible to examine multiple metabolic processes simultaneously and in considerable detail. This provides an orthogonal view into defects associated with HF progression, since metabolites, lipids, and hormones collectively comprise the substrates, products, and ligands on which the proteome acts.
The key objective in this study is to ascertain what molecular processes distinguish hypertrophy with preserved contractile function from a failing heart with increased susceptibility to SCD. Here we integrate three omic technologies to map the transition from compensated hypertrophy to decompensation in a model that provides a reasonable simulacrum of human HF. We have quantified over 17 000 transcripts, 3000 proteins, and 275 lipids/metabolites. The three independent sources of information provided unique insights into the key pathways contributing to the pathological transition. In several instances, a plausible causal connection between changes in the proteome and metabolome could be established. Finally, an overall working hypothesis about the critical gene regulatory modules involved in HF progression has been developed.
METHODS
Guinea Pig Models of Heart Failure and Sudden Cardiac Death
Heart failure and sudden cardiac death were elicited in guinea pigs as described previously.4 Details are provided in panel 1 in the Supporting Information.
Quantitative Proteomics, Transcriptomics, and Metabolomics
Quantitative proteomics was performed using gel-free 2D LC–MS/MS employing isobaric tags for relative and absolute quantification (iTRAQ). The transcriptome was evaluated by microarray analysis (Affymetrix). Metabolomic studies were performed on a contract basis by Metabolon Inc. Detailed descriptions of instrumentation and methodology are provided in the Supporting Information.
Project Design and Overview
The scope and design of the project are outlined in Figure 1. We sought to examine changes in transcripts, proteins, and metabolites over the course of cardiac remodeling from hypertrophy (HYP) to heart failure (HF). Transcriptome and metabolome determinations were made with six biological replicates per experimental group, while quantitative proteome profiling was performed by comparing sham, HYP, and HF animals in three independent multiplexed experiments. The statistical analyses differed in accordance with prevailing conventions. Microarray analysis was performed according to the methods of Irizarry et al.15 A linear model empirical Bayesian (EB)-modified Student’s paired two-sample t test16 was applied for rigorous determination of the statistical significance of differential protein levels. Finally, as elements of the metabolome were quantified individually and on multiple platforms, differential metabolite levels were determined by a Welch’s two-sample t test. The effect of multiple-hypothesis testing on the differential regulation false-discovery rate (FDR) was documented using the q-value method of Storey.17 Detailed descriptions of data processing and statistical methodology are provided in panel 1 in the Supporting Information.
Figure 1.
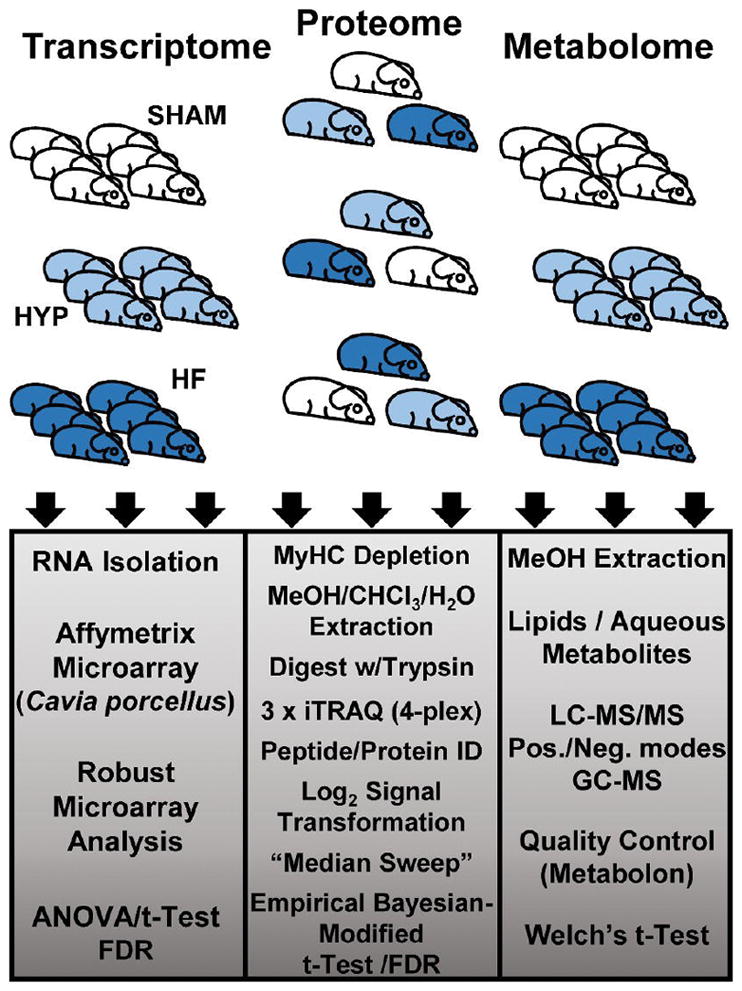
Study design.
Bioinformatic Analysis
Pathway analysis and inference of upstream regulators were performed using QIAGEN’s Ingenuity Pathways Analysis (IPA; QIAGEN, Redwood City, www.qiagen.com/ingenuity).18 Details are provided in panel 1 in the Supporting Information.
Animal Care
This study conformed to the Guide for the Care and Use of Laboratory Animals published by the National Institutes of Health (NIH Publication No. 85-23, revised 1996) and was approved by the Johns Hopkins Animal Care and Use Committee.
Methodological References
The Supporting Information contains an extensive bibliography of methodological references.
RESULTS
Proteome Data Set
Comparison of sham, HYP, and HF hearts was conducted by means of three independent multiplexed (4-plex) experiments (Figure 2). Each experiment identified over 3200 proteins. Because of stochastic data-dependent acquisition of peptides in LC–MS/MS, not all of the proteins identified with high confidence were observed in all three experiments. Therefore, statistical methods capable of handling instances of missing data were chosen. Specifically, by applying a linear model empirical Bayesian analysis,16a we were able to quantify and statistically evaluate proteins common to all three experiments (2429) as well as those present in at least two of the three experiments (675), i.e., 3104 of the 4150 proteins identified in the combined analyses (Figure 2A). Application of the median-sweep algorithm of Herbrich et al.,19 provided robust (log-transformed and median-summarized) estimation of protein abundance across iTRAQ channels within each multiplex, properly normalized for incidental differences in protein concentration among samples. Principal component analysis indicated that the protein levels clustered on the basis of experimental groups (sham, HYP, HF) rather than any other technical factor (Figure 2B) and therefore could be compared across experimental groups, as visualized in a volcano plot (Figure 2C). The plot reveals that for comparison of HF and sham groups, statistically significant protein changes (EB-modified p values <0.05) were among the subset of log2(fold change) values less than −0.22 or greater than 0.22. Changes in protein levels between the HF and sham groups, as determined by iTRAQ, exhibited a strong correlation with changes determined by immunoblot analysis (R2 = 0.97; Figure 2D). The slope of the best-fit line was 1.46, indicating that the protein abundance ratios (HF vs sham) obtained by chemiluminescence and X-ray film were compressed relative to spectrally derived protein abundance ratios.
Figure 2.
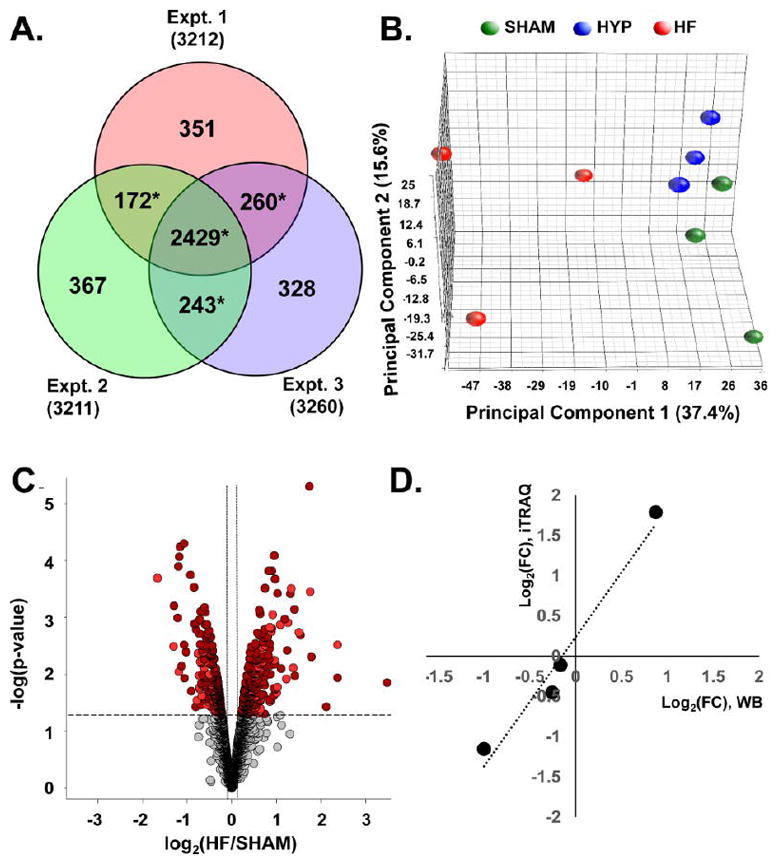
Quantitative proteomic data set. (A) Venn analysis of protein identification across three independent iTRAQ experiments. Data-dependent sampling of peptides for MS2 spectral acquisition yielded distinct but overlapping proteomes. Empirical Bayesian statistical methods can accommodate sampling-related absence and, therefore, analysis of relative abundance, provided that the protein is observed in two or more independent experiments (denoted with *). (B) Principal component analysis of protein abundances across the data set. Component 1 differentiates distinct global protein abundance biosignatures of sham, HYP, and HF hearts. (C) Volcano plot providing a visual representation of differential protein regulation in HF, for which a detailed table is found in panel 2 in the Supporting Information. Dark-red circles represent significantly regulated (p < 0.05) proteins identified in all three experiments. Light-red circles denote those identified in two out of three experiments. The use of EB-modified p values obviates arbitrary fold-change thresholds that undermine FDR assessment. (D) Corroboration of fold changes (FCs) determined by mass spectrometry with those determined by immunoblot analysis.
Overview of Protein and Transcript Changes in Heart Failure Progression
In addition to the 3104 proteins, 17 244 transcripts were quantified, permitting assessment of differential regulation between the sham, HYP, and HF groups. Complete tables of protein and transcript quantification are presented in panels 2 and 3, respectively, in the Supporting Information. One of the primary objectives of this study is to map changes in proteins and transcripts over the transition from HYP to HF. Accordingly, each was mapped to a corresponding gene and classified according to regulation exclusively in HYP, in both HYP and HF, and exclusively in HF (Figure 3A–F). The names of the top genes represented in each group were tabulated (Figure 3 right).
Figure 3.

Top regulated proteins and transcripts. The proteome (A–C) and the transcriptome (D–F) were parsed into three categories, those regulated (p < 0.05) in HYP only, in HYP and HF, and in HF only. Red symbols and traces denote entities upregulated in the specified condition. Blue symbols and traces denote entities that are downregulated in the specified condition. Transcripts and proteins were mapped to their respective genes, and the top genes in each category are listed in the right-hand panel.
Ion Channels and Transporters
The acquired long QT and arrhythmogenic phenotype of the model4 motivated us to analyze the changes in ion channels and transporters in HYP and HF hearts (Table 1). Low-copy-number transmembrane proteins were under-represented in the proteome, as expected; however, several important ion channel subunits were identified. Significant changes were noted for the cardiac L-type Ca2+ channel α subunit (CACNA1C; decreased 21% in HF) and the background inward rectifier potassium channel Kir2.1 (KCNJ2; decreased 18% in HYP and 36% in HF). Three isoforms of chloride intracellular channels, CLIC1, CLIC2, and CLIC4, increased in HF (by 48%, 28%, and 48%, respectively). Altered levels of Na+/K+ ATPase subunits were also observed: the α1 and β1 subunits (ATP1A1 and ATP1B1) were significantly decreased in HF, while the α2 subunit (ATP1A2) was increased in HYP (33%) and HF (129%). Consistent with the failing phenotype, the cardiac sarcoplasmic reticulum Ca2+ATPase (SERCA2a; ATP2A2) and ryanodine receptor (RYR2) were both significantly decreased by ~20%, while phospholamban (PLN) was down 49% in HF.
Table 1.
Ion Channels Altered in the Proteome
| protein accession no. | protein name | gene | HYP/shama | HF/shama | HF/HYPa |
|---|---|---|---|---|---|
| 348561620 | Na+/K+-transporting ATPase subunit α2 | ATP1A2 | 1.34* | 2.29* | 1.71* |
| 348571178 | chloride intracellular channel protein 4 | CLIC4 | 1.05 | 1.48* | 1.41* |
| 348576494 | chloride intracellular channel protein 1 | CLIC1 | 1.12 | 1.48* | 1.32* |
| 348552798 | chloride intracellular channel protein 2 | CLIC2 | 1.08 | 1.28* | 1.19 |
| 290543547 | voltage-dependent L-type calcium channel subunit β2 | CACNB2 | 1.1 | 0.82 | 0.75* |
| 290563281 | Na+/K+-transporting ATPase subunit β1 | ATP1B1 | 0.96 | 0.81* | 0.84* |
| 348554331 | sarcoplasmic/endoplasmic reticulum calcium ATPase 2 | ATP2A2 | 0.91 | 0.79* | 0.87 |
| 290543386 | voltage-dependent L-type calcium channel subunit α1C | CACNA1C | 0.94 | 0.79* | 0.84 |
| 290543531 | Na+/K+-transporting ATPase subunit α1 | ATP1A1 | 0.94 | 0.79* | 0.84* |
| 348575560 | ryanodine receptor 2-like | RYR2 | 0.95 | 0.77* | 0.81* |
| 348557586 | sodium-dependent phosphate transporter 2 isoform X1 | SLC20A2 | 0.88 | 0.75* | 0.85 |
| 290543565 | inward rectifier potassium channel 2 | KCNJ2 | 0.82* | 0.65* | 0.78* |
Asterisks (*) denote p < 0.05.
Analysis of the transcriptome provided broad coverage of ion channel/transporter subunit mRNA expression (Table 2). Correlation with the proteomic changes was evident in some cases. For example, Clic channel messages (Clic2 and Clic4) were increased in HF and Kcnj2 was significantly down-regulated. Moreover, the isoform shift in Na+/K+ ATPase subunits was recapitulated. The mRNAs for the repolarizing K+ channels Kcnq1 and Kcnh1, known to be altered in human heart failure,20 were also decreased in HF relative to sham and HYP animals, respectively. Trpc6 message was markedly increased, in accord with other HF animal models,21 and SERCA2a (Atp2a2) was decreased. In HYP, gap junctional channel mRNAs C×43 (Gja1) and C×31 β5 (Gjb5) increased significantly while C×37 (Gja4) decreased slightly. HF was marked by decreases in C×37 and C×45 (Gjc1).
Table 2.
Excitation–Contraction Coupling Channels and Transporters Regulated in the Transcriptome
| transcript accession no. | gene name | gene | HYP/shama | HF/shama | HF/HYPa |
|---|---|---|---|---|---|
| 20071073 | hyperpolarization activated cyclic nucleotide-gated potassium channel 1 | HCN1 | 3.24* | 7.19* | 2.22 |
| 20141937 | ATPase, Na+/K+ transporting, β4 polypeptide | ATP1B4 | 2.22* | 3.85* | 1.73 |
| 20126631 | ATPase, Na+/K+ transporting, α2 polypeptide | ATP1A2 | 1.52* | 2.2* | 1.45 |
| 20034606 | transient receptor potential cation channel, subfamily C, member 6 | TRPC6 | 1.46* | 2.10* | 1.44 |
| 20033943 | sodium channel, voltage-gated, type III, β subunit | SCN3B | 1.62* | 2.07 | 1.27 |
| 20083068 | purinergic receptor P2X, ligand-gated ion channel 5 | P2RX5 | 1.19 | 1.76* | 1.47 |
| 20126168 | sodium channel, voltage-gated, type I, β subunit | SCN1B | 1.24* | 1.75* | 1.41* |
| 20099829 | transient receptor potential cation channel, subfamily V, member 4 | TRPV4 | 1.54* | 1.71* | 1.11 |
| 20123770 | calcium channel, voltage-dependent, T type, α1G subunit | CACNA1G | 1.66* | 1.4 | 0.84 |
| 20041090 | potassium voltage-gated channel, shaker-related subfamily, member 3 | KCNA3 | 1.17 | 1.37* | 1.17 |
| 20133876 | phosphoinositide-interacting regulator of transient receptor potential channels | PIRT | 1.33* | 1.37* | 1.03 |
| 19983232 | potassium voltage-gated channel, Isk-related family, member 3 | KCNE3 | 1.07 | 1.31* | 1.23* |
| 20041789 | chloride channel accessory 4 | CLCA4 | 0.87 | 1.31* | 1.51* |
| 20020072 | potassium channel, subfamily K, member 1 | KCNK1 | 1.29 | 1.29* | 1 |
| 20098740 | potassium channel tetramerization domain containing 13 | KCTD13 | 0.95 | 1.28* | 1.34* |
| 20156521 | ATPase, Na+/K+ transporting, β3 polypeptide | ATP1B3 | 1.07 | 1.27* | 1.19 |
| 20068238 | potassium channel tetramerization domain containing 17 | KCTD17 | 1.21* | 1.23* | 1.01 |
| 20062018 | potassium voltage-gated channel, shaker-related subfamily, β member 2 | KCNAB2 | 1.33* | 1.22 | 0.92 |
| 20012481 | chloride intracellular channel 2 | CLIC2 | 1.22 | 1.22* | 1 |
| 20056824 | potassium channel tetramerization domain containing 8 | KCTD8 | 1.34* | 1.20* | 0.89 |
| 20012102 | potassium voltage-gated channel, Isk-related subfamily, member 1 | KCNE1 | 1.01 | 1.19* | 1.17 |
| 20060071 | gap junction protein, β5, 31.1 kDa | GJB5 | 1.3* | 1.18 | 0.9 |
| 19998760 | calcium channel, voltage-dependent, β2 subunit | CACNB2 | 0.96 | 1.16* | 1.20* |
| 19984710 | potassium voltage-gated channel, subfamily G, member 2 | KCNG2 | 1.27* | 1.16 | 0.91 |
| 20060736 | chloride intracellular channel 4 | CLIC4 | 1.04 | 1.15* | 1.11 |
| 20038373 | potassium voltage-gated channel, Shaw-related subfamily, member 4 | KCNC4 | 0.82 | 1.14 | 1.39* |
| 20092226 | potassium channel modulatory factor 1 | KCMF1 | 1.06 | 1.13* | 1.07 |
| 20152309 | transmembrane channel-like 8 | TMC8 | 1.38* | 1.13 | 0.82* |
| 19975667 | potassium channel tetramerization domain containing 9 | KCTD9 | 0.95 | 1.12* | 1.18* |
| 20037512 | sodium channel modifier 1 | SCNM1 | 0.95 | 1.12 | 1.18* |
| 20117862 | potassium channel tetramerization domain containing 12 | KCTD12 | 1.23* | 1.1 | 0.9 |
| 19966992 | transient receptor potential cation channel, subfamily A, member 1 | TRPA1 | 0.93 | 1.1 | 1.19* |
| 20090690 | chloride channel 3 | CLCN3 | 1.17* | 1.09 | 0.93 |
| 19997489 | ATPase, Ca2+ transporting, plasma membrane 4 | ATP2B4 | 1.26* | 1.08 | 0.86 |
| 20124300 | calcium channel, voltage-dependent, β1 subunit | CACNB1 | 0.89 | 1.06 | 1.19* |
| 20030731 | calcium channel, voltage-dependent, N type, α1B subunit | CACNA1B | 1.32* | 1.06 | 0.8 |
| 20107097 | two pore segment channel 2 | TPCN2 | 1.14* | 0.97 | 0.85 |
| 20112569 | potassium channel, subfamily K, member 15 | KCNK15 | 1.13 | 0.93 | 0.83* |
| 20048710 | potassium channel tetramerization domain containing 19 | KCTD19 | 1.12 | 0.93 | 0.83* |
| 20038626 | ATPase, Na+/K+ transporting, α1 polypeptide | ATP1A1 | 0.91* | 0.93 | 1.02 |
| 19969465 | potassium voltage-gated channel, Shab-related subfamily, member 2 | KCNB2 | 0.72* | 0.92 | 1.28 |
| 20003587 | potassium voltage-gated channel, subfamily H (eag-related), member 1 | KCNH1 | 1.22* | 0.9 | 0.74* |
| 19976195 | gap junction protein, α1 | GJA1 | 1.12* | 0.9 | 0.8* |
| 20140559 | gap junction protein, γ1, 45 kDa | GJC1 | 1.05 | 0.87* | 0.83* |
| 20061238 | chloride channel, voltage-sensitive Kb | CLCNKB | 0.87 | 0.86* | 0.99 |
| 19992472 | ATPase, Ca2+ transporting, cardiac muscle, slow twitch 2 | ATP2A2 | 0.91 | 0.86* | 0.94 |
| 20060065 | gap junction protein, α4, 37 kDa | GJA4 | 0.91* | 0.86* | 0.94 |
| 20097353 | potassium channel tetramerization domain containing 5 | KCTD5 | 0.74* | 0.86 | 1.15 |
| 20013102 | ATPase, Ca2+ transporting, plasma membrane 3 | ATP2B3 | 0.71* | 0.86 | 1.21 |
| 19970564 | potassium voltage-gated channel, subfamily H (eag-related), member 8 | KCNH8 | 0.98 | 0.85* | 0.87* |
| 20115178 | potassium large conductance calcium-activated channel, subfamily M, β | KCNMB3 | 0.9 | 0.84* | 0.94 |
| member 3 | |||||
| 19983489 | short transient receptor potential channel 2-like | LOC100715102 | 0.93 | 0.82* | 0.88 |
| 20030467 | potassium voltage-gated channel, subfamily G, member 3 | KCNG3 | 0.99 | 0.82* | 0.83 |
| 20098428 | sodium channel, nonvoltage-gated 1γ | SCNN1G | 0.86 | 0.82* | 0.94 |
| 20082999 | purinergic receptor P2X, ligand-gated ion channel 1 | P2RX1 | 0.82* | 0.81* | 0.99 |
| 20003217 | potassium channel tetramerization domain containing 3 | KCTD3 | 0.94 | 0.81* | 0.86 |
| 20069544 | potassium inwardly rectifying channel, subfamily J, member 8 | KCNJ8 | 0.78* | 0.81 | 1.05 |
| 19999618 | potassium voltage-gated channel, subfamily F, member 1 | KCNF1 | 0.92 | 0.80* | 0.87 |
| 20124749 | potassium voltage-gated channel, subfamily H (eag-related), member 4 | KCNH4 | 0.89 | 0.80* | 0.9 |
| 19994143 | potassium voltage-gated channel, KQT-like subfamily, member 2 | KCNQ2 | 0.87 | 0.79* | 0.9 |
| 20109067 | potassium voltage-gated channel, subfamily Q, member 1 | KCNQ1 | 0.93 | 0.79* | 0.85 |
| 20081931 | acid-sensing (proton-gated) ion channel 3 | ASIC3 | 1 | 0.78* | 0.78* |
| 19975338 | potassium channel, subfamily K, member 18 | KCNK18 | 0.92 | 0.78* | 0.85 |
| 20083093 | transient receptor potential cation channel, subfamily V, member 1 | TRPV1 | 0.75 | 0.76* | 1 |
| 20137866 | potassium voltage-gated channel, subfamily H (eag-related), member 6 | KCNH6 | 0.88 | 0.75* | 0.86 |
| 20074714 | potassium inwardly rectifying channel, subfamily J, member 2 | KCNJ2 | 0.93 | 0.74* | 0.8 |
| 20041088 | potassium voltage-gated channel, shaker-related subfamily, member 2 | KCNA2 | 1.01 | 0.74* | 0.73 |
| 20004743 | transient receptor potential cation channel, subfamily M, member 8 | TRPM8 | 0.89 | 0.74* | 0.83 |
| 20138900 | calcium channel, voltage-dependent, γ subunit 5 | CACNG5 | 0.82 | 0.73* | 0.89 |
| 20020195 | ryanodine receptor 2 (cardiac) | RYR2 | 0.84* | 0.68* | 0.81 |
| 19969815 | calcium channel, voltage-dependent, α2/δ subunit 3 | CACNA2D3 | 0.65* | 0.66* | 1.01 |
| 20138895 | calcium channel, voltage-dependent, γ subunit 4 | CACNG4 | 0.9 | 0.63* | 0.71* |
| 20147496 | calcium channel, voltage-dependent, γ subunit 7 | CACNG7 | 0.87 | 0.61* | 0.7 |
| 20164942 | ATPase, Ca2+ transporting, plasma membrane 2 | ATP2B2 | 0.86 | 0.61* | 0.7* |
| 20034895 | potassium inwardly rectifying channel, subfamily J, member 5 | KCNJ5 | 0.76 | 0.56* | 0.73 |
Asterisks (*) denote p < 0.05.
Several of the most pronounced changes observed were unexpected. For example, Hcn1, a hyperpolarization-activated cyclic nucleotide-gated potassium channel normally associated with the pacemaker cells of the heart or brain, stood out as the most upregulated channel in HYP and HF (>7-fold in HF) despite the ventricular origin of the samples. Another typical atrial pacemaker channel, the acetylcholine G-protein-regulated K+ channel, KAch (Kcnj5; aka GIRK4), was the second most downregulated ion channel in HF (decreased 1.8-fold). Although these changes could potentially contribute to the prolonged QT interval and increased the incidence of arrhythmias in the ACi group,4 other repolarizing voltage-gated K+ channel subunits were increased (e.g., Kcna3, Kcne3; Table 2). Hence, a detailed experimental assessment of each channel subtype’s individual contribution to repolarization defects in HF will be required.
Pathways Inferred from Analysis of the Proteome or Transcriptome
The pathways and networks implicated by genes changing in HYP, HF, or both were assessed using Ingenuity Pathways (Figure 4). Details regarding the interpretation of this figure are presented in the figure legend. Figure 4 shows the pathways implicated in HYP and HF (Figure 4A) and those implicated in HF only (Figure 4B). Briefly, proteins changing in HYP and HF (p < 0.05; Figure 4A) predominantly were associated with catabolic pathways, including degradation of the humoral factors adrenaline, noradrenalin, and serotonin. Metabolism of retinoic acid (RA) and retinoic acid receptor signaling, key determinants of early cardiac development, were implicated, as were enzymes responsible for amino acid and nucleotide metabolism.
Figure 4.

Pathway analysis. (A) Pathway analysis of transcripts and proteins significantly regulated in both HYP and HF. (B) Analysis of transcripts and proteins significantly regulated in HF only. Where sufficient information exists, pathways are colored according to inferred activation or inhibition on the basis of their z scores (see the Supporting Information). Warm colors (orange, brown) denote inferred pathway activation. Cool colors (blue shades) denote inferred pathway inhibition.
By virtue of its depth and sensitivity, microarray analysis showed changes in many signaling pathways in HYP and HF (Figure 4A). Fibrotic and inflammatory pathways such IL-17 signaling and prostanoid synthesis were implicated. Notably, acute phase response signaling was strongly inferred to be activated. As in the proteome, pathways related to retinoic acid signaling were likewise implicated by transcript changes, particularly through the retinoid X receptors. Many of the pathways, including the acute phase response, IL-17, IGF-1, and NRF2-mediated stress response pathways and others, share common elements, in particular, branches of the MAP kinase family pathway (ERK, p38, or JNK signaling). Structural remodeling was evident in the form of metalloprotease pathways and signaling through focal adhesion kinase (FAK).
The number and extent of the changes in protein levels were greater in HF than in HYP (Figure 4B). Thus, analysis of proteins and transcripts regulated in the HF-Only group implicated several prominent pathways that were significantly altered (p < 0.05), and in many cases the direction of the regulation could be determined (z score). Broadly interpreted, the pathway profiles could be classified as spanning from the extracellular matrix/interstitium to the ventricular myocyte. For example, extracellular signaling pathways figured prominently in the transcriptome, including matrix remodeling pathways (fibrosis) and immune cell/inflammatory responses (IL8, NF-κB, acute phase and complement responses), including those normally involved in viral defense, such as viral endocytotic pathways. Endothelin, epidermal growth factor, α-adrenergic, Gαq, and phospholipase C signaling were inferred to be activated, as were a host of inflammatory responses.
In contrast, the proteome, likely dominated by the cardiomyocyte protein abundance, revealed a host of down-regulated pathways (Figure 4B); a number of these were previously associated with HF, including inhibition of calcium cycling, β-adrenergic/cyclic-AMP/PKA, and NOS signaling. Protein networks regulated by PGC1α/PPAR/RXR were strongly inhibited in the proteome, including fatty acid transport and metabolism and mitochondrial dysfunction. Notably, the primary mitochondrial transcription/replication regulator, TFAM, was the second most downregulated protein in the HF-only group (decreased 56%; panel 2 in the Supporting Information). Interestingly, pathways related to cardiac hypertrophic signaling were decreased in the HF-only group relative to sham-operated controls, despite evident hypertrophy and substantial elevation of atrial natriuretic peptide (NPPA) (increased 55% in HF), possibly reffecting the transition from a phase of active hypertrophic growth to one of cardiac decompensation.
Activated processes inferred from the proteome were fewer. As in the transcriptome analysis, the implication was that these could be attributed to the extramyocyte compartment, including a strong acute phase immune response, integrin signaling, the coagulation system, RhoA signaling, and epithelial adherens junction remodeling (Figure 4B).
Upstream Signaling Deduced from the Proteome or Transcriptome
In addition to pathway analysis, which is essentially a form of ontology analysis, inferences can also be made regarding putative upstream regulators or signaling ligands by comparing the directionality of transcript and protein changes in the omic data sets to the IPA database of microarray studies in assorted cell lines in response to specific signaling agonists or gene manipulations. Upstream regulator or causal network analysis18 provides a determination of regulatory factor involvement (p value) as well as projected activation or inhibition (z score) (Figure 5). From proteome changes in HYP and HF (Figure 5A), significant activation of TGFβ and interferon γ (IFNG) signaling was indicated. The extensiveness of the inferred network can be appreciated by a graphical depiction of the levels of TGFβ-responsive proteins (Figure 5A). Specifically, the observation that eight out of 11 TGFβ-responsive proteins were significantly upregulated in HYP and HF is sufficient to make a strong inference (z score) that TGFβ is activated in this model. Other growth factor programs were implicated by analysis of the proteome, including connective tissue growth factor (CTGF), insulin-like growth factor (IGF1), and the neurotrophic growth factors NTF4 and BDNF, though there was insufficient information in either our data set or the IPA database to predict their directionality in the HYP and HF subsets. Mild inhibition of angiotensinogen-related signaling (AGT) was inferred from the proteome; however, AGT as a positive upstream regulator was strongly indicated in the transcriptome, highlighting one example of transcriptome–proteome disparity.
Figure 5.

Upstream signaling. (A) Upstream signaling analysis of transcripts and proteins significantly regulated in both HYP and HF. Exemplar signaling networks are shown. The TNF network was inferred from the transcriptome, whereas the TGFB1 network was inferred from the proteome. (B) Analysis of transcripts and proteins significantly regulated in HF only. The INFG network was inferred from the proteome and the BDNF network was inferred from the proteome. Where sufficient information exists, pathways are colored according to inferred activation or inhibition on the basis of their z scores (see the Supporting Information). The peripheral nodes represent the HF/sham ratios from the Supporting Information. The colors of the peripheral nodes are given by the red/green spectrum, where red denotes upregulation and green denotes downregulation. The central node indicates the inferred upstream signal that would explain the ratios represented in the peripheral nodes. The dotted lines linking the central node to the peripheral nodes indicate indirect relationships between the signal and the ultimate transcript or protein ratios. The colors of the dotted lines indicate inferred activation or inhibition of signaling. Yellow dotted lines indicate a transcript or protein ratio at odds with the predicted effect of signaling.
In addition to the positive correlation with renin-angiotensin as an upstream regulator, the transcriptome changes in HYP and HF (Figure 5A) were consistent with activation of hallmark hypertrophy-associated programs, including TGFβ1–3 and endothelin 1 (EDN1), and the inflammatory response pathways TNF, IFNG, IL1-B, IL5, and possibly IL6. Growth factor programs predicted to be inhibited in HYP and HF include FAS, CCL2, IL17A, and FGF1.
Proteins significantly regulated in HF only (Figure 5B), as in HYP and HF, also implicate TGFβ. Inflammatory programs include predicted activation of TNF, IFNG, IL1B, IL4, IL6, IL11, and IL15. Predicted inhibited signals include BDNF, IGF1, IGFR1, and CXCl12, among others. Signaling programs from HF-only changes in the transcriptome paralleled and extended those of the proteome, again heavily featuring upregulated pathways. Specifically, the panel of inferred interleukin signals included those aforementioned but also IL2, IL10, and IL13. While there was overall concordance between the proteome- and transcriptome-derived predictions, there were also examples of divergence, notably FAS, CXCL12, IGF1, and Leptin (LEP).
Upstream Transcription Factors Deduced from the Proteome or Transcriptome
Similar upstream analysis can be applied to reveal upstream transcriptional programs whose activation or inhibition would yield the resultant transcriptome and proteome changes in the HYP and HF or HF-only groups (Figure 6). Protein changes in HYP and HF (Figure 6A) implicated many transcription programs that were either directly cAMP-responsive (ATF2 and ATF4) or transcriptional binding partners of cAMP-responsive proteins (HIF1A, CEBPB, CEBPG, and DDIT3). Consistent with the pathway analysis, the retinoic acid-dependent transcription factors RXRA and RARG were implicated. Other notable transcription factors implicated in both HYP and HF included MEF2C, FOS, and HMGA1.
Figure 6.

Upstream transcriptional programs. (A) Upstream transcriptional program analysis of transcripts and proteins significantly regulated in both HYP and HF. The top three programs in the transcriptome (according to log(p value)), KLF2, FOS, and NEUROG1, are shown as a network. The top three transcriptional programs inferred from proteomic data are HIF1A, ATF4, and DDIT3. (B) Transcriptional programs inferred from transcripts and proteins significantly regulated in HF only. Where sufficient information exists, pathways are colored according to inferred activation or inhibition on the basis of their z scores (see the Supporting Information). The top 11 activated transcriptional programs (from z scores) based on transcriptome data are shown to illustrate the degree of redundancy between programs. The top six activated programs based on the proteome are shown. It should be noted that the cases of ING1 and NFKB1A illustrate how activation of the program is consistent with repression of downregulation of the protein (blue lines). The network specifications are the same as in Figure 5, with the exception that the solid lines between the central and peripheral nodes indicate direct regulatory relationships.
Changes in the transcriptome in HYP and HF (Figure 6A) likewise implicated cAMP- and RA-dependent programs (e.g., CREB1, CEBPA and RXRA, PPARD, PPARG). In addition, TGFβ-responsive gene regulation is predicted through SMADs 2, 3, and 4. MYC-, NFKB1A-, and CTNNB1-dependent transcription is also inferred. Among the most strongly inhibited programs are those associated with the KLF family, KLF2 and KLF15. In contrast, KLF4 action is predicted to be activated.
The upstream regulators driving the proteins whose levels change in the HF-Only group (Figure 6B) implicate many of the same pathways identified in the HYP and HF group. The major PGC1α axis controlling mitochondrial fatty acid metabolism and mitochondrial gene expression, including PPARGC1A, PPARGC1B, PPARA, PPARD, and PPARG, were inhibited, as was the orphan estrogen receptor, ESRRA, which also participates in mitochondrial biogenesis. Notably, MEF2C, HNF4A, MYC, and TP53,22 which are implicated in mitochondrial gene expression and/or mitochondrial integrity, were also inferred to be inhibited on the basis of proteomic analysis. The most strongly activated program was XBP1, which is responsible for controlling genes of the unfolded protein response (UPR). Other activated programs include NFKBIA, an inhibitor of NFKB, NRIP1, a broad specificity transcriptional corepressor of metabolic genes,23 and ING1, an inhibitor of growth factor 1. Finally, transcriptome changes strongly implicated activation of the CTNNB1, SP1, and NOTCH3 pathways.
The strong indication that PGC1α-regulated mitochondrial metabolic and antioxidant enzymes (e.g., TXNRD2, SOD2, PRDX3, and PRDX5) were decreased in HF motivated us to further examine whether defective signaling through the crucial upstream regulators of PGC1α, CREB1/CREBBP, could partly explain the progressive loss of these enzymes (Figure 7). Although a few CREB/CREBBP-associated proteins were, in fact, increased rather than decreased in HF, remarkably, many of the key proteins involved in the altered acute ion/redox imbalance observed in the model could be traced back to impaired CREB signaling. This of course includes PGC1α itself and its downstream protein network. Moreover, the known dependence of BDNF expression24 and PGC1α on CREB25 further focuses attention on CRE-modulated transcriptional coupling (Figure 7).
Figure 7.

Emerging network underlying guinea pig HF. Pathway analysis and upstream activator analysis predicted cAMP and retinoic acid deficiencies in guinea pig HF. Here we indicate the inferred impact on cAMP- and RA-responsive transcriptional programs, including Creb, CREBBP, RXRA, PGC1a, BDNF, and MEF2C. Inhibition of the programs (top; blue) is consistent with the proteomic profile observed in HF (downregulation in green, upregulation in red). CP denotes canonical pathway involvement. Tx denotes inferred toxic or pathological sequelae.
Characterization of Transcriptome/Proteome Concordance and Divergence
Although there was noticeable overlap between the proteome-and transcriptome-derived pathway and upstream regulator analyses, there was also a degree of divergence. This prompted us to compare the magnitudes of transcript and protein changes in HF (Figure 8). For 2722 genes to which proteins and transcripts could be easily mapped, their log2(fold change) values are plotted in Figure 8A. The immediately striking observation is the weak correlation between the transcript and protein fold changes (R2 = 0.23). Allowing for differences in platforms and comparing proteins and transcripts on a rank basis did not improve the correlation. We found that for one-quarter of genes, the difference between the fold changes for transcript and protein exceeded 20% (not shown). Finally, perhaps the simplest comparison of concordance was to tally the number of entries for transcripts and proteins for which the directionality of the fold changes concurred or diverged (Figure 8B). Two-thirds of transcript/protein pairs showed concordant fold changes, both positive and negative. For the remaining third of the entries, the directions of the fold changes for the transcripts and proteins diverged. A certain level of discordance is to be expected, particularly for those genes whose regulation in HF is marginal and therefore not statistically significant. However, there are others for which the differences between protein and transcript levels are more dramatic. In these cases, divergence may be a source of novel mechanistic insight and point to genes subject to post-transcriptional regulation. Pathway analysis and inferred microRNA activity that might explain the divergences are found in panels 18–22 in the Supporting Information.
Figure 8.

Concordance and divergence between the transcriptome and proteome in HF. (A) Fold changes in HF for the proteome and transcriptome exhibit a weak correlation (Pearson’s R = 0.48). (B) Concordant/divergent directions of fold changes. One-third of genes display divergent fold-change directions in HF (see panel 18 in the Supporting Information).
Overview of Metabolome Changes in the Heart
Metabolomic analysis identified 288 analytes. Of these, 275 could be reasonably quantified, whereas 13 low-abundance metabolites were characterized by missing signals in >50% of samples. The metabolites spanned multiple classes from lipids, amino acids, and carbohydrates to nucleotides, vitamins, and cofactors. Data are summarized in panel 4 in the Supporting Information.
The metabolite profile of the HF group was most distinctive compared with the sham group, according to partial least-squares discriminant analysis (Figure 9A). The magnitudes of metabolite changes tended to be greater in HF than in HYP and in many cases changed in a different direction. Examples include amino acids, which trended higher in HYP but lower than sham in the HF group. By comparison, long-chain fatty acid (LCFA) levels trended lower in HYP but were elevated in HF (panel 4 in the Supporting Information).
Figure 9.

Characterization of the metabolome in HYP and HF. (A) Partial least-squares discriminant analysis reveals the distinctive nature of the metabolome in HF. The metabolome in HYP was less differentiated relative to the sham group. (B) Box plots representing the metabolite trajectories in HYP and HF, including metabolites up- or downregulated in HF only and metabolites progressively downregulated in HYP and HF. (C) Metabolite set enrichment analysis (MSEA) of metabolite regulation in HF. The x axis shows fold enrichment, and the color spectrum represents the span of Holm’s FWER-corrected p values. (D) Metabolite pathway analysis (MetPA) incorporating MSEA (y axis) and pathway topology (x axis). The size of the circles is proportional to the number of compounds identified in a given pathway, and the color reffects the Holm’s FWER-corrected p value. Selected pathways are highlighted. The entire set of pathways identified by MSEA and MetPA can be found in panels 23 and 24 in the Supporting Information.
To determine which metabolic pathways were most impacted in HF, the matrix of integrated peak intensities for metabolites was subjected to metabolite set enrichment analysis (MSEA).26 Implicated pathways are shown in Figure 9C. Pathways at the top of the list are likely to be most profoundly influenced in HF. MSEA showed that lipid pathways were also among the most dynamically regulated species in the data set. Specifically, arachidonic acid metabolism, branched-chain fatty acid (FA) metabolism, β-oxidation of very long chain FAs, steroid biosynthesis, and phospholipid biosynthesis were implicated. Select amino acid pathways were also heavily implicated in HF, among them taurine/hypotaurine, D-arginine/D-ornithine, glycine/serine/threonine, and glutamate as well as the sulfur-containing amino acids cysteine and methionine. A full table of enriched pathways is found in panel 23 in the Supporting Information.
Beyond changes in metabolite concentration and their relative over-representation, directed metabolic pathways are also influenced by the position of the metabolite within a pathway. For instance, large changes in upstream metabolites often, but not always, tend to impact the flux through those pathways. Other metabolites intersect several upstream or downstream paths and likewise may be influential. Metabolites at the end of defined pathways may reveal less information about a pathway, particularly if they are downstream of multiple branches. This is the basis of topological analysis,27 which is assessed in Figure 9D. The y axis, −log(p), encapsulates the main findings of Figure 9C, i.e., the prominence of arachidonic, taurine, and glycerophosphate metabolism. The x axis provides an index of likely pathway impact by taking metabolite topology into account. The analysis provides a rational basis for further investigation and hypothesis prioritization. Taurine/hypotaurine and glycerophospholipid metabolism pathways are characterized by both metabolite enrichment and potentially high impact on the basis of topology. Linoleic metabolism, by comparison, may have fewer metabolites regulated in HF, but the impact of that regulation may be substantial. Conversely, biotin metabolism is highly enriched on the basis of elevated lysine levels, yet lysine is downstream of biotin in the metabolic pathway (actually the terminal metabolite) and provides little information about biotin levels without ancillary information. Pathways of broad interest to the cardiac community, such as glutathione, FA, and TCA metabolism, land near the middle of this plot (see panel 24 in the Supporting Information for a tabular representation of Figure 9D).
Proteome/Metabolome Integration
At present, metabolite coverage from existing platforms lags the coverage from more mature transcriptomic and proteomic pipelines. As a result, metabolomic pathway analyses are susceptible to biases, particularly toward more abundant analytes and against recalcitrant (volatile, labile) compounds. To strengthen inference from metabolomic studies, we performed integrated pathway analysis, which takes changes in both protein and metabolite levels in HF into account, using pathways in the KEGG database of reference pathways (Figure 10A). Metabolic pathways implicated by both changes in protein and metabolite levels are prioritized, while lower priority is assigned to pathways implicated by relatively few total metabolites and proteins or by analytes found solely in either the proteome or metabolome. It should be noted, however, that though the proteome coverage extends to >3000 proteins, it is by no means complete and therefore is subject to its own biases.
Figure 10.

Integration of the proteome and metabolome. (A) Combined GSEA/MSEA analysis of protein (mapped to the gene) and metabolite ratios in HF relative to sham. Dark gray bars indicate relative fold enrichment, and light gray bars indicate the impact of pathway topology. The composite score is simply the sum of the enrichment score (−log(p value)) and the topology score. (B) Schematic representation of proteins and metabolites underlying the fatty acid metabolism pathway. Squares denote metabolites, and ovals indicate gene names of proteins implicated in HF. Red indicates upregulation, and green denotes downregulation. The combined data suggest a bottleneck immediately prior to mitochondrial fatty-acylcarnitine import. (C) Schematic representation of proteins and metabolites of the citrate (TCA) cycle. ** denotes p < 0.05, and * denotes p < 0.075. The combined protein and metabolite data imply TCA cycle flux and/or anaplerosis may be inhibited in guinea pig HF.
Integrated analysis reaffirmed the prominence of the TCA cycle, propanoate, FA, and glutathione metabolism on the basis of both protein and metabolite enrichment and topological considerations. A few pathways that scored well in Figure 9C, including the arachidonic acid and taurine/hypotaurine pathways, are not prioritized in Figure 10A. This is likely because although arachidonic acid was significantly downregulated in HF, coverage of enzymes responsible for arachidonic acid was sparse in the proteome. Other pathways with middling scores in Figure 9C, such as valine/leucine/isoleucine metabolism and arginine/proline metabolism, figure more prominently in Figure 10A because of buttressing information from the proteome. The complete list of pathways, p values, and topological scores is provided in panel 25 in the Supporting Information.
Fatty Acid Metabolism
In Figure 10A, FA metabolism distinguishes itself both for its enrichment of protein and metabolites and its high topology score, whose basis is illustrated in Figure 10B. First, metabolome analysis showed that several LCFAs were statistically significantly elevated in HF relative to HYP, while levels of the long-chain acylcarnitines trended down in HF. Figure 10B indicates how these observations dovetail with proteomic data. First, acyl-CoA ligase, ACSL3, which is responsible for activation of fatty acids to acyl-CoA intermediates, is significantly downregulated in HF. Moreover, the carnitine palmitoyl transferases, CPT1B and CPT1C, which are responsible for the conversion of fatty-acyl-CoAs to fatty-acylcarnitines are likewise downregulated by 44% and 24%, respectively. Acylcarnitine transport into the mitochondria is also likely compromised, as levels of the carnitine/acylcarnitine translocase (CACT) declined significantly in HF (19%). Once inside the mitochondria, reconversion of the acylcarnitines to acyl-CoA is effectuated by CPT2, whose levels were marginally lower. However, many of the enzymes responsible for β-oxidation of LCFAs (EHHADH, HADHA, and HADHB) were downregulated. Taken together, one can see that bottlenecks of FA activation (ASCL3/CPT1B) and transport (CACT) could account for the observed increase in the ratio of FA to fatty-acylcarnitines.
TCA Cycle and Anaplerosis
The integrated analysis in Figure 10A revealed that the TCA cycle species were highly enriched and had the highest topology score in the analysis. Figure 10C indicates the basis for this robust inference. Three out of eight of the enzyme complexes responsible for the TCA reactions harbored a subunit that was significantly downregulated in HF (IDH3G, SUCLG1, and SDHC; p < 0.05). Moreover, ACO2 (responsible for two more reactions) and α-ketoglutarate dehydrogenase subunit, DHTKD1, were substantially downregulated (p = 0.07 and 0.06, respectively). Supporting metabolomic evidence shows that citrate, 2-methylcitrate, and acetyl-CoA are elevated in HF relative to the sham group (1.70-, 2.03-, and 1.29-fold, respectively), suggestive of inhibition in the upper span of the TCA cycle. Citrate participates in product inhibition of citrate synthase, and acetyl-CoA is a feedback inhibitor of pyruvate dehydrogenase. Interestingly, 2-methylcitrate, a high-potency inhibitor of citrate synthase, aconitase, and isocitrate dehydrogenase,28 was also significantly increased. Finally, two out of three of the enzymes that replenish TCA cycle intermediates from amino acid, nucleotide, and odd-chain fatty acid metabolism (anaplerotic enzymes), glutamate dehydrogenase (GLUD1) and methylmalonyl-CoA mutase (MUT), were also statistically downregulated.
DISCUSSION
Despite advances in HF treatment, little progress has been made with respect to prevention of HF-associated sudden cardiac death (SCD),29 apart from defibrillator implantation, and the relatively few treatments for cardiac decompensation are palliative, not curative.30 The multifactorial nature of HF/SCD requires an approach that takes into consideration the integrative physiology of the organ, including both myocyte and nonmyocyte compartments. Animal models of HYP and HF have made important contributions to understanding the changes in the electrophysiology, excitation–contraction coupling, and signaling mechanisms during adaptive muscle growth and cardiac decompensation, yet relatively few models display spontaneous arrhythmogenic SCD.31 Moreover, the striking differences in the electrophysiology and Ca2+-handling properties of mice compared with larger animals and humans raise questions about the translational applicability of potential antiarrhythmic strategies based on findings in this species. Because the guinea pig more closely mimics the electro-physiological5 and Ca2+-cycling32 properties of humans, the HF/SCD model studied here provides a relevant platform for detailed mechanistic investigation.
This study revealed a number of insights informed by the unique outputs of the three methods employed. The transcriptome provided the broadest coverage of target remodeling in the HYP and HF conditions. In many cases, particularly for fibrosis- and inflammation-related pathways, the transcriptome and proteome were concordant. However, for roughly one-third of the changes, discordance between mRNA and the proteome was observed. The proteomic analysis yielded robust information about the impact of key upstream regulatory factors on the primary effectors of function/dysfunction in the heart, whereas the metabolome both reinforced the inferences made from the protein quantitation data and added new information about potentially important inhibitory molecules. The findings converged on regulatory nodes impacting the metabolic network that were strongly correlated with the functional decline during HF progression, whereas extramyocyte signaling (growth factor and extracellular matrix remodeling) and immunomodulation (acute phase response) were prominent from the onset of HYP and persisted through end-stage HF.
Strengths of Each “Ome”
The transcriptome, assessed by microarray or RNA sequencing, is the most mature of the omes presented and has, by a long measure, the greatest depth of coverage. This advantage is most evident for genes whose protein products are either recalcitrant to proteomic analysis (e.g., transmembrane-located) or of low abundance, resulting in their under-representation. In view of the interesting HF/SCD phenotype of this model, the transcriptome is particularly useful to assess the levels of ion channel transcripts that may provide candidate mechanisms for altered excitability, propensity to arrhythmia, and SCD. Early candidates identified include the pacemaker channel, Hcn1, and the inward rectifier K+ channels Kir2.1 (Kcnj2) or GIRK4 (Kcnj5). Hcn1 mRNA levels were elevated 7-fold in HF over controls and increased markedly in going from HYP to HF. When these results are considered together with a decrease in background K+ conductance and impaired repolarization reserve (due to decreased delayed and inward rectifier currents), it is tempting to speculate that ectopic HCN expression could increase the probability of spontaneous ectopic depolarization and triggered arrhythmia, such as the premature ventricular beats we frequently observe in the ACi model.4 An increase in ventricular HCN1 expression was observed previously in a mouse model of pressure-overload-induced hypertrophy;33 however, it was not directly linked to increased If current, as double knockout of Hcn2 and Hcn4 was sufficient to attenuate the arrhythmias and eliminate all hyperpolarization-activated current in ventricular myocytes from the hypertrophied hearts. In another study, increasing ventricular If by transgenic overexpression of Hcn2 or a dominant negative Nrsf 2 resulted in an increase in arrhythmias during β-adrenergic stimulation that could be suppressed by the HCN channel inhibitor ivabradine.34 Interestingly, ivabradine was recently approved to reduce the risk of hospitalization for worsening heart failure in patients with stable, symptomatic chronic heart failure with left ventricular ejection fraction <35% and bradycardia.35 Whether the beneficial effects are solely due to heart rate reduction or to possible effects on ventricular or conduction system electrophysiology remains to be investigated. Concerning GIRK4, a recent study suggested that these channels are present in ventricular myocytes and can hasten repolarization via adenosine- or muscarinic- receptor-mediated activation.36 In addition to ion channels and transporters, the transcriptome uniquely provided a direct assessment of the message levels of low-abundance growth factors, cytokines, and transcription factors.
The proteome presented here quantifies >3000 proteins, comparing favorably with recent studies in mice.13c While less comprehensive than the transcriptome, the proteomic approach provides valuable information that cannot be obtained otherwise. First, it provides an index of the levels of the ultimate executors of cellular function. Second, it permits evaluation of post-translational modifications that modulate protein activity. Third, analysis of the networks of proteins altered in HF permits one to infer which transcriptional pathways were most strongly regulated, even when the changes in the mRNAs of the transcription factors themselves were more subtle. The latter could result from the effect of post-transcriptional RNA editing/degradation or the requirement for several cis- or trans-regulatory elements to be active in combination (e.g., joint regulation by CREB and PPARγ). Reassuringly, we showed that the protein level biosignatures recapitulate the accepted HF canon as well as functional data from our lab, including deficits in Ca2+ handling, impaired repolarization, energetics, redox modulation, and extracellular remodeling in the failing hearts. Notwithstanding differences in species, proteomic platforms, methods of protein quantitation, and subsequent statistical analysis, our results in the guinea pig model appear to be consistent with a recent proteomic analysis of pressure-overload-induced hypertrophy in mouse hearts (961 proteins),13b particularly with respect to downregulation of many enzymes of the TCA cycle and FA metabolism, including proteins like the highly downregulated CPT1B. CPT1B is particularly notable since modeling of upstream regulators showed that it is subject to regulation by up to 10 of 12 transcriptional programs likely inhibited in HF, including PGC1a, MEF2C, and KLF15, among others.
Notably, a number of proteins not previously associated with heart failure were markedly and significantly changed in our HF model. Some of the most downregulated proteins have unknown or poorly characterized functions, especially in the heart, including DIRAS2, a ras GTPase family member, CHTOP, which may be involved in mRNA transport and estrogen signaling, calmegin (CLGN), an endoplasmic reticulum chaperone involved in spermatogenesis, and the serine/threonine-protein kinase SBK2, of unknown function.
Integration of the Metabolomic Data
The metabolome consisted of 288 metabolites spanning the lipids, carbohydrates, and nucleotides and is therefore similar in scope to recently published HF metabolomes using mouse models.37 Work over the last several years has suggested that metabolic dysfunction associated with the onset of heart failure may be a causal factor in the transition rather than an epiphenomenon.38 If so, then the key to developing new therapies lies in establishing the landscape of cardiac metabolism and the state of the enzymes that govern them. A key finding of this study is that the levels of LCFA are dramatically increased upon transition to HF. This has been noted previously in recent metabolomic analyses of mouse models of heart failure.37b Interestingly, fatty acid accumulation is also a hallmark of the diabetic heart, where the mechanism is believed to involve hyperactivation of the PGC1α/PPAR axis that increases the levels of plasma membrane fatty acid transporters, leading to lipid accumulation, notwithstanding activation of fatty acid oxidation (see ref 39 for review). In our guinea pig model of pressure overload and persistent adrenergic stimulation, though fatty acids also accumulate, low levels of acylcarnitines and proteins associated with mitochondrial FA activation, transport, and oxidation indicate that the PGC1α/PPAR axis is downregulated. The lipid accumulation, therefore, likely arises from a choke point at the level of carnitine palmitoyl transferase (CPT), the enzyme responsible for the conversion of acyl-CoAs into acylcarnitines for transport from the cytosol to the mitochondria; CPT1B was among the most down regulated proteins in the HF proteome.
With respect to glucose metabolism, dynamic changes were noted at the proteome level. Cardiac forms of glycolytic enzymes declined, while ratios of brain isoforms increased. Despite these changes, which might suggest a priming of the heart for higher glycolytic flux, our metabolomics snapshot reveals no significant changes in levels of glycolytic intermediates in heart failure relative to control hearts. Moreover, oxidative glycolytic flux ultimately depends on the downstream conversion of pyruvate to acetyl-CoA and TCA cycle flux. Here, we report that in heart failure, every single enzyme complex of the TCA cycle trended downward, three of which were substantially downregulated and statistically significant. Moreover, two of three TCA-cycle-replenishing anaplerotic enzymes were, likewise, downregulated. Proteomic data alone would, therefore, suggest an impingement on TCA cycle flux in HF. The metabolomic data further show that the problem is compounded by the accumulation of citrate, likely due to oxidatively damaged aconitase. Citrate is a potent feedback inhibitor two enzymes, citrate synthase from the TCA cycle and cytosolic phosphofructokinase, a rate-determining step in glycolysis.
We also noted the accumulation of 2-methylcitrate, which is a potent inhibitor of three TCA cycle enzymes, namely, citrate synthase, aconitase, and isocitrate dehydrogenase.28 In humans, it is rarely detected, except in the case of inborn errors of metabolism associated with profound cardiomyopathy, including methylmalonyl-CoA and propionyl-CoA acidemia.40 Specifically, 2-methylcitrate is produced from the reaction of oxaloacetate with elevated propionyl-CoA40b that arises from defects in odd-chain fatty acid (OCFA), amino acid, or vitamin B12 metabolism.41 Our proteome shows that the enzyme common to each of these processes, methylmalonyl-CoA mutase (MUT), declined 22%, while integrated proteome/metabolome pathway analysis implicated altered propionyl-CoA metabolism in HF. Taken together, these results suggest a bottleneck for anaplerosis via impaired OCFA or amino acid metabolism that favors the accumulation of propionyl-CoA and the TCA cycle toxin 2-methylcitrate. It remains to be determined whether elevated 2-methylcitrate or propionyl-CoA is detectable in human heart failure.
Limitations of the Model, Methods, and Analyses
The primary utility of the guinea pig model of HF/SCD is that it is one of very few small-animal models of heart failure that exhibit the hallmarks of the progression of systolic heart failure together with clinically relevant sudden cardiac death, and it will likely provide insight into human heart failure arising from hypertensive heart disease or aortic stenosis. However, the combination of aortic constriction and β-adrenergic stimulation may not be representative of other forms of heart failure arising from different etiologies, which would include ischemic, idiopathic, familial, and chemotherapy-induced cardiomyopathies. With respect to proteomic methodology, we have used the iTRAQ shotgun strategy, in which multiplexing has the advantage of limiting technical variability. Nevertheless, iTRAQ quantitation is subject to well-documented compression of fold changes stemming from factors such as peptide coisolation. Coisolation interference was minimal in our study because of extensive front-end peptide fractionation by basic reversed-phase HPLC combined with a concatenated pooling strategy. Moreover, median summarization of the protein abundances in each iTRAQ channel minimizes the influence of outlier spectra on fold-change ratios. Finally, the analyses presented implicate certain pathways, signals, or transcriptional programs on the basis of Fisher’s exact test, which yields a p value. The reader is reminded that the magnitude the p value is not a measure of biological significance or importance, but simply a reffection of the likelihood that coordinate regulation in this study occurred by chance.
Concluding Remarks and Model of Excitation–Transcription Coupling in HF Progression
In the context of known hallmarks of heart failure, a broad integrated picture of crosstalk between acute inotropic/redox impairment and chronic cardiac remodeling during decompensation emerges from the pathway analyses described herein and encapsulated in Figure 7. This integrative view allows us to generate a hypothesis to explain the systems pathobiology of HF. In this scheme (Figure 11), desensitization of β-adrenergic signaling/cyclic AMP generation contributes to blunted Ca2+ transients, Na+ overload, and insufficient mitochondrial Ca2+ signal under conditions of high metabolic demand. Loss of Ca2+-dependent dehydrogenase regulation, along with other defects in the Krebs cycle, impairs the ability of mitochondria to maintain the pyridine nucleotides NADH and NADPH in the reduced state, limiting maximal ATP production and ROS scavenging, respectively. Chronic impairment of cyclic AMP (and possibly CaM kinase) signaling to the nucleus through CREB, an essential driver of PGC1α and a number of other Ca2+ regulatory and antioxidant proteins that are decreased in HF, contributes to a cascading depression of mitochondrial protein expression and biogenesis as PPAR-, NRF1- and NRF2-regulated genes are suppressed. Parallel transcriptional pathways linked to activation of mitochondrial metabolism are also suppressed, including BDNF, MEF2C, and MYC, whose expression has been shown to be regulated by CREB and/or PPAR, which would further contribute to a vicious circle leading to progressive metabolic, redox, and Ca2+-handling failures.
Figure 11.

Model for excitation–transcription coupling responsible for maladaptive metabolic and antioxidant remodeling in HF. Deficits in β-adrenergic signaling and Ca2+ handling are hallmarks of HF that are recapitulated in the guinea pig model. These deficits are expected to diminish the activity of protein kinase A (PKA) and Ca2+ calmodulin-dependent kinases. Pathway analysis suggests an analogy to neuronal signaling, in which PKA and CAMK activity have been shown to govern the phosphorylation state and activation status of the cAMP-responsive element (CRE) binding protein (CREB), a transcriptional coactivator. Since CREB is a documented transcriptional coactivator of PGC1α (itself a coactivator) and other genes (e.g., RYR2, BDNF), impaired CREB activation by CaMK/PKA would impinge on PGC1α-dependent gene programs, among them PPAR/RXR-mediated activation of genes for fatty acid metabolism (e.g., CPT1B, β-oxidation enzymes). PGC1α also participates in NRF 1- and 2-mediated activation of genes responsible for mitochondrial homeostasis (e.g., TFAM) and antioxidant function (e.g., SOD2 and PRDX3). Finally, antioxidant defenses suffer a double blow. Not only are antioxidant proteins downregulated, but also, acute Ca2+/Na2+ dysregulation abrogates mitochondrial TCA-cycle-dependent NADPH production, which is required to sustain the activity of thiol-bearing antioxidant enzymes.
The unifying feature of this model is that it incorporates many of the accepted mechanisms that have been implicated in hypertrophy and heart failure in the past but ties them together in a new way. In an attempt to maintain cardiac output, early adaptation to stress likely involves a parallel increase in cell growth, metabolic capacity, and catecholamine drive, but ultimately, impaired Ca2+ handling and β-adrenergic desensitization could disrupt homeostatic nuclear transcriptional programs, hitting hardest at control nodes for the critical metabolic, Ca2+, and redox pathways. Understanding the nature of this off switch and how to delay it from flipping should be fertile areas for further research. Moreover, therapeutic intervention may depend on whether this process is irreversible or whether the defect can be bypassed in novel ways in the future.
Supplementary Material
Acknowledgments
This work was supported by NIH Grant R01HL101235 and Contract HHSN268201000032C (to B.O.) as well as R21HL108052 and AHA 12SDG12060056 (to D.B.F.). The authors thank Joshua Betz and Lisa Rein for early consultation on implementing the median sweep algorithm.
Footnotes
Author Contributions
D.B.F., T.L., and B.O. designed the study. D.B.F., R.N.C., and B.O. contributed resources. D.B.F., T.L., N.Y., and R.O. performed the experiments. Data were analyzed by D.B.F., K.K., K.N.P., N.Y., C.C.T., and B.O. D.B.F. and B.O. wrote the manuscript with contributions from K.N.P. and N.Y. All of the authors edited the manuscript.
Notes
The authors declare no competing financial interest.
The microarray data discussed in this publication have been deposited in NCBI’s Gene Expression Omnibus (GEO)42 and are accessible through GEO series accession number GSE78077 (http://www.ncbi.nlm.nih.gov/geo/query/acc.cgi?acc=GSE78077). Proteomic data sets, including spectral data files (.RAW), peak lists (.mgf), search results (.msf), and the Cavia porcellus protein sequence database (.FASTA), have been deposited with the ProteomeXchange Consortium via the PRIDE43 partner repository with the data set identifier PXD003980
The Supporting Information is available free of charge on the ACS Publications website at DOI: 10.1021/acs.jproteo-me.6b00149.
Extended materials and methods (embedded pdf file) and 31 panels of tabulated data from which Figures 2–11 were drawn (XLS)
References
- 1.Go AS, Mozaffarian D, Roger VL, Benjamin EJ, Berry JD, Blaha MJ, Dai S, Ford ES, Fox CS, Franco S, Fullerton HJ, Gillespie C, Hailpern SM, Heit JA, Howard VJ, Huffman MD, Judd SE, Kissela BM, Kittner SJ, Lackland DT, Lichtman JH, Lisabeth LD, Mackey RH, Magid DJ, Marcus GM, Marelli A, Matchar DB, McGuire DK, Mohler ER, 3rd, Moy CS, Mussolino ME, Neumar RW, Nichol G, Pandey DK, Paynter NP, Reeves MJ, Sorlie PD, Stein J, Towfighi A, Turan TN, Virani SS, Wong ND, Woo D, Turner MB. Executive summary: heart disease and stroke statistics–2014 update: a report from the American heart association. Circulation. 2014;129(3):399–410. doi: 10.1161/01.cir.0000442015.53336.12. [DOI] [PubMed] [Google Scholar]
- 2.Heidenreich PA, Albert NM, Allen LA, Bluemke DA, Butler J, Fonarow GC, Ikonomidis JS, Khavjou O, Konstam MA, Maddox TM, Nichol G, Pham M, Pina IL, Trogdon JG. Forecasting the impact of heart failure in the United States: a policy statement from the American Heart Association. Circ: Heart Failure. 2013;6(3):606–19. doi: 10.1161/HHF.0b013e318291329a. [DOI] [PMC free article] [PubMed] [Google Scholar]
- 3.(a) Cohn JN. Prognosis in congestive heart failure. J Card Failure. 1996;2(Suppl 1):S225–9. doi: 10.1016/s1071-9164(96)80081-9. [DOI] [PubMed] [Google Scholar]; (b) Cohn JN, Archibald DG, Ziesche S, Franciosa JA, Harston WE, Tristani FE, Dunkman WB, Jacobs W, Francis GS, Flohr KH, et al. Effect of vasodilator therapy on mortality in chronic congestive heart failure. Results of a Veterans Administration Cooperative Study. N Engl J Med. 1986;314(24):1547–52. doi: 10.1056/NEJM198606123142404. [DOI] [PubMed] [Google Scholar]
- 4.Liu T, Takimoto E, Dimaano VL, DeMazumder D, Kettlewell S, Smith G, Sidor A, Abraham TP, O’Rourke B. Inhibiting mitochondrial Na+/Ca2+ exchange prevents sudden death in a Guinea pig model of heart failure. Circ Res. 2014;115(1):44–54. doi: 10.1161/CIRCRESAHA.115.303062. [DOI] [PMC free article] [PubMed] [Google Scholar]
- 5.Rosati B, Dong M, Cheng L, Liou SR, Yan Q, Park JY, Shiang E, Sanguinetti M, Wang HS, McKinnon D. Evolution of ventricular myocyte electrophysiology. Physiol Genomics. 2008;35(3):262–72. doi: 10.1152/physiolgenomics.00159.2007. [DOI] [PMC free article] [PubMed] [Google Scholar]
- 6.Suckow MA, Stevens KA, Wilson RP, editors. The Laboratory Rabbit, Guinea Pig, Hamster and Other Rodents. Academic Press; Waltham, MA: 2012. [Google Scholar]
- 7.Bers D. Excitation–Contraction Coupling and Cardiac Contractile Force. Kluwer Academic Publishers; Dordrecht, The Netherlands: 2001. [Google Scholar]
- 8.(a) Kembro JM, Aon MA, Winslow RL, O’Rourke B, Cortassa S. Integrating mitochondrial energetics, redox and ROS metabolic networks: a two-compartment model. Biophys J. 2013;104(2):332–343. doi: 10.1016/j.bpj.2012.11.3808. [DOI] [PMC free article] [PubMed] [Google Scholar]; (b) Zhou L, Aon MA, Almas T, Cortassa S, Winslow RL, O’Rourke B. A reaction-diffusion model of ROS-Induced ROS release in a mitochondrial network. PLoS Comput Biol. 2010;6(1):e1000657. doi: 10.1371/journal.pcbi.1000657. [DOI] [PMC free article] [PubMed] [Google Scholar]; (c) Wei AC, Aon MA, O’Rourke B, Winslow RL, Cortassa S. Mitochondrial energetics, pH regulation, and ion dynamics:a computational-experimental approach. Biophys J. 2011;100(12):2894–2903. doi: 10.1016/j.bpj.2011.05.027. [DOI] [PMC free article] [PubMed] [Google Scholar]
- 9.(a) Liew CC, Dzau VJ. Molecular genetics and genomics of heart failure. Nat Rev Genet. 2004;5(11):811–25. doi: 10.1038/nrg1470. [DOI] [PubMed] [Google Scholar]; (b) Margulies KB, Bednarik DP, Dries DL. Genomics, transcriptional profiling, and heart failure. J Am Coll Cardiol. 2009;53(19):1752–9. doi: 10.1016/j.jacc.2008.12.064. [DOI] [PMC free article] [PubMed] [Google Scholar]
- 10.(a) Agnetti G, Husberg C, Van Eyk JE. Divide and conquer: the application of organelle proteomics to heart failure. Circ Res. 2011;108(4):512–26. doi: 10.1161/CIRCRESAHA.110.226910. [DOI] [PMC free article] [PubMed] [Google Scholar]; (b) Franklin S, Chen H, Mitchell-Jordan S, Ren S, Wang Y, Vondriska TM. Quantitative analysis of the chromatin proteome in disease reveals remodeling principles and identifies high mobility group protein B2 as a regulator of hypertrophic growth. Mol Cell Proteomics. 2012;11(6):M111.014258. doi: 10.1074/mcp.M111.014258. [DOI] [PMC free article] [PubMed] [Google Scholar]; (c) Agnetti G, Kaludercic N, Kane LA, Elliott ST, Guo Y, Chakir K, Samantapudi D, Paolocci N, Tomaselli GF, Kass DA, Van Eyk JE. Modulation of mitochondrial proteome and improved mitochondrial function by biventricular pacing of dyssynchronous failing hearts. Circ: Cardiovasc Genet. 2010;3(1):78–87. doi: 10.1161/CIRCGENETICS.109.871236. [DOI] [PMC free article] [PubMed] [Google Scholar]; (d) Banfi C, Brioschi M, Wait R, Begum S, Gianazza E, Fratto P, Polvani G, Vitali E, Parolari A, Mussoni L, Tremoli E. Proteomic analysis of membrane microdomains derived from both failing and non-failing human hearts. Proteomics. 2006;6(6):1976–88. doi: 10.1002/pmic.200500278. [DOI] [PubMed] [Google Scholar]; (e) Bugger H, Schwarzer M, Chen D, Schrepper A, Amorim PA, Schoepe M, Nguyen TD, Mohr FW, Khalimonchuk O, Weimer BC, Doenst T. Proteomic remodelling of mitochondrial oxidative pathways in pressure overload-induced heart failure. Cardiovasc Res. 2010;85(2):376–84. doi: 10.1093/cvr/cvp344. [DOI] [PubMed] [Google Scholar]; (f) Baseler WA, Dabkowski ER, Williamson CL, Croston TL, Thapa D, Powell MJ, Razunguzwa TT, Hollander JM. Proteomic alterations of distinct mitochondrial subpopulations in the type 1 diabetic heart: contribution of protein import dysfunction. American journal of physiology. Regulatory, integrative and comparative physiology. 2011;300(2):R186–200. doi: 10.1152/ajpregu.00423.2010. [DOI] [PMC free article] [PubMed] [Google Scholar]; (g) Jullig M, Hickey AJ, Chai CC, Skea GL, Middleditch MJ, Costa S, Choong SY, Philips AR, Cooper GJ. Is the failing heart out of fuel or a worn engine running rich? A study of mitochondria in old spontaneously hypertensive rats. Proteomics. 2008;8(12):2556–72. doi: 10.1002/pmic.200700977. [DOI] [PubMed] [Google Scholar]; (h) Monte E, Mouillesseaux K, Chen H, Kimball T, Ren S, Wang Y, Chen JN, Vondriska TM, Franklin S. Systems proteomics of cardiac chromatin identifies nucleolin as a regulator of growth and cellular plasticity in cardiomyocytes. American journal of physiology. Heart and circulatory physiology. 2013;305(11):H1624–38. doi: 10.1152/ajpheart.00529.2013. [DOI] [PMC free article] [PubMed] [Google Scholar]
- 11.(a) Heinke MY, Wheeler CH, Chang D, Einstein R, Drake-Holland A, Dunn MJ, dos Remedios CG. Protein changes observed in pacing-induced heart failure using two-dimensional electrophoresis. Electrophoresis. 1998;19(11):2021–30. doi: 10.1002/elps.1150191122. [DOI] [PubMed] [Google Scholar]; (b) Buscemi N, Doherty-Kirby A, Sussman MA, Lajoie G, Van Eyk JE. Proteomic analysis of Rac1 transgenic mice displaying dilated cardiomyopathy reveals an increase in creatine kinase M-chain protein abundance. Mol Cell Biochem. 2003;251(1–2):145–51. [PubMed] [Google Scholar]; (c) Chu G, Kerr JP, Mitton B, Egnaczyk GF, Vazquez JA, Shen M, Kilby GW, Stevenson TI, Maggio JE, Vockley J, Rapundalo ST, Kranias EG. Proteomic analysis of hyperdynamic mouse hearts with enhanced sarcoplasmic reticulum calcium cycling. FASEB J. 2004;18(14):1725–7. doi: 10.1096/fj.04-2025fje. [DOI] [PubMed] [Google Scholar]; (d) Sawicki G, Jugdutt BI. Detection of regional changes in protein levels in the in vivo canine model of acute heart failure following ischemia-reperfusion injury: functional proteomics studies. Proteomics. 2004;4(7):2195–202. doi: 10.1002/pmic.200300746. [DOI] [PubMed] [Google Scholar]
- 12.Geiger T, Velic A, Macek B, Lundberg E, Kampf C, Nagaraj N, Uhlen M, Cox J, Mann M. Initial Quantitative Proteomic Map of 28 Mouse Tissues Using the SILAC Mouse. Mol Cell Proteomics. 2013;12(6):1709–1722. doi: 10.1074/mcp.M112.024919. [DOI] [PMC free article] [PubMed] [Google Scholar]
- 13.(a) Hammer E, Goritzka M, Ameling S, Darm K, Steil L, Klingel K, Trimpert C, Herda LR, Dorr M, Kroemer HK, Kandolf R, Staudt A, Felix SB, Volker U. Characterization of the human myocardial proteome in inflammatory dilated cardiomyopathy by label-free quantitative shotgun proteomics of heart biopsies. J Proteome Res. 2011;10(5):2161–71. doi: 10.1021/pr1008042. [DOI] [PubMed] [Google Scholar]; (b) Dai DF, Hsieh EJ, Chen T, Menendez LG, Basisty NB, Tsai L, Beyer RP, Crispin DA, Shulman NJ, Szeto HH, Tian R, MacCoss MJ, Rabinovitch PS. Global proteomics and pathway analysis of pressure-overload-induced heart failure and its attenuation by mitochondrial-targeted peptides. Circ: Heart Failure. 2013;6(5):1067–76. doi: 10.1161/CIRCHEARTFAILURE.113.000406. [DOI] [PMC free article] [PubMed] [Google Scholar]; (c) Gramolini AO, Kislinger T, Alikhani-Koopaei R, Fong V, Thompson NJ, Isserlin R, Sharma P, Oudit GY, Trivieri MG, Fagan A, Kannan A, Higgins DG, Huedig H, Hess G, Arab S, Seidman JG, Seidman CE, Frey B, Perry M, Backx PH, Liu PP, MacLennan DH, Emili A. Comparative proteomics profiling of a phospholamban mutant mouse model of dilated cardiomyopathy reveals progressive intracellular stress responses. Mol Cell Proteomics. 2008;7(3):519–33. doi: 10.1074/mcp.M700245-MCP200. [DOI] [PubMed] [Google Scholar]; (d) Isserlin R, Merico D, Alikhani-Koupaei R, Gramolini A, Bader GD, Emili A. Pathway analysis of dilated cardiomyopathy using global proteomic profiling and enrichment maps. Proteomics. 2010;10(6):1316–27. doi: 10.1002/pmic.200900412. [DOI] [PMC free article] [PubMed] [Google Scholar]
- 14.(a) Wittel B, Spann JF., Jr Defective lipid metabolism in the failing heart. J Clin Invest. 1968;47(8):1787–94. doi: 10.1172/JCI105868. [DOI] [PMC free article] [PubMed] [Google Scholar]; (b) Bishop SP, Altschuld RA. Increased glycolytic metabolism in cardiac hypertrophy and congestive failure. Am J Physiol. 1970;218(1):153–9. doi: 10.1152/ajplegacy.1970.218.1.153. [DOI] [PubMed] [Google Scholar]; (c) Taegtmeyer H, Overturf ML. Effects of moderate hypertension on cardiac function and metabolism in the rabbit. Hypertension. 1988;11(5):416–26. doi: 10.1161/01.hyp.11.5.416. [DOI] [PubMed] [Google Scholar]; (d) Christe ME, Rodgers RL. Altered glucose and fatty acid oxidation in hearts of the spontaneously hypertensive rat. J Mol Cell Cardiol. 1994;26(10):1371–5. doi: 10.1006/jmcc.1994.1155. [DOI] [PubMed] [Google Scholar]; (e) Osorio JC, Stanley WC, Linke A, Castellari M, Diep QN, Panchal AR, Hintze TH, Lopaschuk GD, Recchia FA. Impaired myocardial fatty acid oxidation and reduced protein expression of retinoid X receptor-alpha in pacing-induced heart failure. Circulation. 2002;106(5):606–12. doi: 10.1161/01.cir.0000023531.22727.c1. [DOI] [PubMed] [Google Scholar]
- 15.Irizarry RA, Hobbs B, Collin F, Beazer-Barclay YD, Antonellis KJ, Scherf U, Speed TP. Exploration, normalization, and summaries of high density oligonucleotide array probe level data. Biostatistics. 2003;4(2):249–264. doi: 10.1093/biostatistics/4.2.249. [DOI] [PubMed] [Google Scholar]
- 16.(a) Kammers K, Cole RN, Tiengwe C, Ruczinski I. Detecting Significant Changes in Protein Abundance. EuPa Open Proteomics. 2015;7:11–19. doi: 10.1016/j.euprot.2015.02.002. [DOI] [PMC free article] [PubMed] [Google Scholar]; (b) Schwammle V, Leon IR, Jensen ON. Assessment and improvement of statistical tools for comparative proteomics analysis of sparse data sets with few experimental replicates. J Proteome Res. 2013;12(9):3874–83. doi: 10.1021/pr400045u. [DOI] [PubMed] [Google Scholar]
- 17.(a) Storey JD. A direct approach to false discovery rates. Journal of the Royal Statistical Society: Series B (Statistical Methodology) 2002;64(3):479–498. [Google Scholar]; (b) Storey JD, Tibshirani R. Statistical significance for genomewide studies. Proc Natl Acad Sci U S A. 2003;100(16):9440–9445. doi: 10.1073/pnas.1530509100. [DOI] [PMC free article] [PubMed] [Google Scholar]
- 18.Kramer A, Green J, Pollard J, Jr, Tugendreich S. Causal analysis approaches in Ingenuity Pathway Analysis. Bioinformatics. 2014;30(4):523–30. doi: 10.1093/bioinformatics/btt703. [DOI] [PMC free article] [PubMed] [Google Scholar]
- 19.Herbrich SM, Cole RN, West KP, Jr, Schulze K, Yager JD, Groopman JD, Christian P, Wu L, O’Meally RN, May DH, McIntosh MW, Ruczinski I. Statistical inference from multiple iTRAQ experiments without using common reference standards. J Proteome Res. 2013;12(2):594–604. doi: 10.1021/pr300624g. [DOI] [PMC free article] [PubMed] [Google Scholar]
- 20.Dias P, Terracciano CM. Hyperpolarization-activated cyclic nucleotide-gated channels and ventricular arrhythmias in heart failure: a novel target for therapy? J Am Heart Assoc. 2013;2(3):e000287. doi: 10.1161/JAHA.113.000287. [DOI] [PMC free article] [PubMed] [Google Scholar]
- 21.(a) Kuwahara K, Wang Y, McAnally J, Richardson JA, Bassel-Duby R, Hill JA, Olson EN. TRPC6 fulfills a calcineurin signaling circuit during pathologic cardiac remodeling. J Clin Invest. 2006;116(12):3114–3126. doi: 10.1172/JCI27702. [DOI] [PMC free article] [PubMed] [Google Scholar]; (b) Onohara N, Nishida M, Inoue R, Kobayashi H, Sumimoto H, Sato Y, Mori Y, Nagao T, Kurose H. TRPC3 and TRPC6 are essential for angiotensin II-induced cardiac hypertrophy. EMBO J. 2006;25(22):5305–5316. doi: 10.1038/sj.emboj.7601417. [DOI] [PMC free article] [PubMed] [Google Scholar]
- 22.Berkers CR, Maddocks OD, Cheung EC, Mor I, Vousden KH. Metabolic regulation by p53 family members. Cell Metab. 2013;18(5):617–33. doi: 10.1016/j.cmet.2013.06.019. [DOI] [PMC free article] [PubMed] [Google Scholar]
- 23.(a) Izzo A, Manco R, Bonfiglio F, Cali G, De Cristofaro T, Patergnani S, Cicatiello R, Scrima R, Zannini M, Pinton P, Conti A, Nitsch L. NRIP1/RIP140 siRNA-mediated attenuation counteracts mitochondrial dysfunction in Down syndrome. Hum Mol Genet. 2014;23(16):4406–19. doi: 10.1093/hmg/ddu157. [DOI] [PubMed] [Google Scholar]; (b) Nautiyal J, Christian M, Parker MG. Distinct functions for RIP140 in development, inflammation, and metabolism. Trends Endocrinol Metab. 2013;24(9):451–9. doi: 10.1016/j.tem.2013.05.001. [DOI] [PubMed] [Google Scholar]; (c) Seth A, Steel JH, Nichol D, Pocock V, Kumaran MK, Fritah A, Mobberley M, Ryder TA, Rowlerson A, Scott J, Poutanen M, White R, Parker M. The transcriptional corepressor RIP140 regulates oxidative metabolism in skeletal muscle. Cell Metab. 2007;6(3):236–45. doi: 10.1016/j.cmet.2007.08.004. [DOI] [PMC free article] [PubMed] [Google Scholar]
- 24.Shieh PB, Hu SC, Bobb K, Timmusk T, Ghosh A. Identification of a signaling pathway involved in calcium regulation of BDNF expression. Neuron. 1998;20(4):727–40. doi: 10.1016/s0896-6273(00)81011-9. [DOI] [PubMed] [Google Scholar]
- 25.(a) Herzig S, Long F, Jhala US, Hedrick S, Quinn R, Bauer A, Rudolph D, Schutz G, Yoon C, Puigserver P, Spiegelman B, Montminy M. CREB regulates hepatic gluconeo-genesis through the coactivator PGC-1. Nature. 2001;413(6852):179–83. doi: 10.1038/35093131. [DOI] [PubMed] [Google Scholar]; (b) Yoon JC, Puigserver P, Chen G, Donovan J, Wu Z, Rhee J, Adelmant G, Stafford J, Kahn CR, Granner DK, Newgard CB, Spiegelman BM. Control of hepatic gluconeogenesis through the transcriptional coactivator PGC-1. Nature. 2001;413(6852):131–8. doi: 10.1038/35093050. [DOI] [PubMed] [Google Scholar]
- 26.Xia J, Wishart DS. MSEA: a web-based tool to identify biologically meaningful patterns in quantitative metabolomic data. Nucleic Acids Res. 2010;38(WebServer issue):W71–7. doi: 10.1093/nar/gkq329. [DOI] [PMC free article] [PubMed] [Google Scholar]
- 27.Xia J, Wishart DS. MetPA: a web-based metabolomics tool for pathway analysis and visualization. Bioinformatics. 2010;26(18):2342–4. doi: 10.1093/bioinformatics/btq418. [DOI] [PubMed] [Google Scholar]
- 28.Cheema-Dhadli S, Leznoff CC, Halperin ML. Effect of 2-methylcitrate on citrate metabolism: implications for the management of patients with propionic acidemia and methylmalonic aciduria. Pediatr Res. 1975;9(12):905–8. doi: 10.1203/00006450-197512000-00008. [DOI] [PubMed] [Google Scholar]
- 29.Cohn JN, Archibald DG, Ziesche S, Franciosa JA, Harston WE, Tristani FE, Dunkman WB, Jacobs W, Francis GS, Flohr KH, et al. Effect of vasodilator therapy on mortality in chronic congestive heart failure. Results of a Veterans Administration Cooperative Study. N Engl J Med. 1986;314(24):1547–52. doi: 10.1056/NEJM198606123142404. [DOI] [PubMed] [Google Scholar]
- 30.Braunwald E. The war against heart failure: the Lancet lecture. Lancet. 2015;385(9970):812–24. doi: 10.1016/S0140-6736(14)61889-4. [DOI] [PubMed] [Google Scholar]
- 31.Stengl M. Experimental models of spontaneous ventricular arrhythmias and of sudden cardiac death. Physiol Res. 2010;59(Suppl 1):S25–31. doi: 10.33549/physiolres.932001. [DOI] [PubMed] [Google Scholar]
- 32.Bers DM, Bassani JW, Bassani RA. Na-Ca exchange and Ca fluxes during contraction and relaxation in mammalian ventricular muscle. Ann N Y Acad Sci. 1996;779:430–42. doi: 10.1111/j.1749-6632.1996.tb44818.x. [DOI] [PubMed] [Google Scholar]
- 33.Hofmann F, Fabritz L, Stieber J, Schmitt J, Kirchhof P, Ludwig A, Herrmann S. Ventricular HCN channels decrease the repolarization reserve in the hypertrophic heart. Cardiovasc Res. 2012;95(3):317–26. doi: 10.1093/cvr/cvs184. [DOI] [PubMed] [Google Scholar]
- 34.Kuwabara Y, Kuwahara K, Takano M, Kinoshita H, Arai Y, Yasuno S, Nakagawa Y, Igata S, Usami S, Minami T, Yamada Y, Nakao K, Yamada C, Shibata J, Nishikimi T, Ueshima K, Nakao K. Increased expression of HCN channels in the ventricular myocardium contributes to enhanced arrhythmicity in mouse failing hearts. J Am Heart Assoc. 2013;2(3):e000150. doi: 10.1161/JAHA.113.000150. [DOI] [PMC free article] [PubMed] [Google Scholar]
- 35.(a) Ceconi C, Freedman SB, Tardif JC, Hildebrandt P, McDonagh T, Gueret P, Parrinello G, Robertson M, Steg PG, Tendera M, Ford I, Fox K, Ferrari R. Effect of heart rate reduction by ivabradine on left ventricular remodeling in the echocardiographic substudy of BEAUTIFUL. Int J Cardiol. 2011;146(3):408–14. doi: 10.1016/j.ijcard.2010.10.125. [DOI] [PubMed] [Google Scholar]; (b) Fox K, Ferrari R, Tendera M, Steg PG, Ford I. Rationale and design of a randomized, double-blind, placebo-controlled trial of ivabradine in patients with stable coronary artery disease and left ventricular systolic dysfunction: the morBidity-mortality EvAlUaTion of the I(f) inhibitor ivabradine in patients with coronary disease and left ventricULar dysfunction (BEAUTIFUL) study. Am Heart J. 2006;152(5):860–6. doi: 10.1016/j.ahj.2006.01.013. [DOI] [PubMed] [Google Scholar]; (c) U.S. Food and Drug Administration. [accessed Feb 18, 2016];FDA approves Corlanor to treat heart failure. 2015 Apr 15; http://www.fda.gov/NewsEvents/Newsroom/PressAnnouncements/ucm442978.htm.
- 36.Liang B, Nissen JD, Laursen M, Wang X, Skibsbye L, Hearing MC, Andersen MN, Rasmussen HB, Wickman K, Grunnet M, Olesen SP, Jespersen T. G-protein-coupled inward rectifier potassium current contributes to ventricular repolarization. Cardiovasc Res. 2014;101(1):175–84. doi: 10.1093/cvr/cvt240. [DOI] [PMC free article] [PubMed] [Google Scholar]
- 37.(a) Sansbury BE, DeMartino AM, Xie Z, Brooks AC, Brainard RE, Watson LJ, DeFilippis AP, Cummins TD, Harbeson MA, Brittian KR, Prabhu SD, Bhatnagar A, Jones SP, Hill BG. Metabolomic analysis of pressure-overloaded and infarcted mouse hearts. Circ: Heart Failure. 2014;7(4):634–42. doi: 10.1161/CIRCHEARTFAILURE.114.001151. [DOI] [PMC free article] [PubMed] [Google Scholar]; (b) Lai L, Leone TC, Keller MP, Martin OJ, Broman AT, Nigro J, Kapoor K, Koves TR, Stevens R, Ilkayeva OR, Vega RB, Attie AD, Muoio DM, Kelly DP. Energy metabolic reprogramming in the hypertrophied and early stage failing heart: a multisystems approach. Circ: Heart Failure. 2014;7(6):1022–31. doi: 10.1161/CIRCHEARTFAILURE.114.001469. [DOI] [PMC free article] [PubMed] [Google Scholar]
- 38.(a) Gupta A, Akki A, Wang Y, Leppo MK, Chacko VP, Foster DB, Caceres V, Shi S, Kirk JA, Su J, Lai S, Paolocci N, Steenbergen C, Gerstenblith G, Weiss RG. Creatine kinase-mediated improvement of function in failing mouse hearts provides causal evidence the failing heart is energy starved. J Clin Invest. 2012;122(1):291–302. doi: 10.1172/JCI57426. [DOI] [PMC free article] [PubMed] [Google Scholar]; (b) Finck BN, Kelly DP. Peroxisome Proliferator–Activated Receptor γ Coactivator-1 (PGC-1) Regulatory Cascade in Cardiac Physiology and Disease. Circulation. 2007;115(19):2540–2548. doi: 10.1161/CIRCULATIONAHA.107.670588. [DOI] [PubMed] [Google Scholar]; (c) Arany Z, Novikov M, Chin S, Ma Y, Rosenzweig A, Spiegelman BM. Transverse aortic constriction leads to accelerated heart failure in mice lacking PPAR-γ coactivator 1α. Proc Natl Acad Sci U S A. 2006;103(26):10086–10091. doi: 10.1073/pnas.0603615103. [DOI] [PMC free article] [PubMed] [Google Scholar]
- 39.Schilling JD. The Mitochondria in Diabetic Heart Failure: From Pathogenesis to Therapeutic Promise. Antioxid Redox Signaling. 2015;22(17):1515–1526. doi: 10.1089/ars.2015.6294. [DOI] [PMC free article] [PubMed] [Google Scholar]
- 40.(a) Ando T, Rasmussen K, Nyhan WL, Hull D. 3-hydroxypropionate: significance of -oxidation of propionate in patients with propionic acidemia and methylmalonic acidemia. Proc Natl Acad Sci U S A. 1972;69(10):2807–11. doi: 10.1073/pnas.69.10.2807. [DOI] [PMC free article] [PubMed] [Google Scholar]; (b) Ando T, Rasmussen K, Wright JM, Nyhan WL. Isolation and identification of methylcitrate, a major metabolic product of propionate in patients with propionic acidemia. J Biol Chem. 1972;247(7):2200–4. [PubMed] [Google Scholar]
- 41.(a) Cowan MJ, Wara DW, Packman S, Ammann AJ, Yoshino M, Sweetman L, Nyhan W. Multiple biotin-dependent carboxylase deficiencies associated with defects in T-cell and B-cell immunity. Lancet. 1979;314(8134):115–8. doi: 10.1016/s0140-6736(79)90002-3. [DOI] [PubMed] [Google Scholar]; (b) Ampola MG, Mahoney MJ, Nakamura E, Tanaka K. Prenatal therapy of a patient with vitamin-B12-responsive methylmalonic acidemia. N Engl J Med. 1975;293(7):313–7. doi: 10.1056/NEJM197508142930701. [DOI] [PubMed] [Google Scholar]
- 42.Edgar R, Domrachev M, Lash AE. Gene Expression Omnibus: NCBI gene expression and hybridization array data repository. Nucleic Acids Res. 2002;30(1):207–210. doi: 10.1093/nar/30.1.207. [DOI] [PMC free article] [PubMed] [Google Scholar]
- 43.Vizcaino JA, Csordas A, Del-Toro N, Dianes JA, Griss J, Lavidas I, Mayer G, Perez-Riverol Y, Reisinger F, Ternent T, Xu QW, Wang R, Hermjakob H. 2016 update of the PRIDE database and its related tools. Nucleic Acids Res. 2016;44(D1):D447–56. doi: 10.1093/nar/gkv1145. [DOI] [PMC free article] [PubMed] [Google Scholar]
Associated Data
This section collects any data citations, data availability statements, or supplementary materials included in this article.