

SUMMARY
Cognitive abilities, such as volitional attention, operate under top-down, executive frontal cortical control of hierarchically lower structures. The circuit mechanisms underlying this process are unresolved. The claustrum possesses interconnectivity with many cortical areas and, thus, is hypothesized to orchestrate the cortical mantle for top-down control. Whether the claustrum receives top-down input and how this input may be processed by the claustrum have yet to be formally tested, however. We reveal that a rich anterior cingulate cortex (ACC) input to the claustrum encodes a preparatory top-down information signal on a five-choice response assay that is necessary for optimal task performance. We further show that ACC input monosynaptically targets claustrum inhibitory interneurons and spiny glutamatergic projection neurons, the latter of which amplify ACC input in a manner that is powerfully constrained by claustrum inhibitory microcircuitry. These results demonstrate ACC input to the claustrum is critical for top-down control guiding action.
In Brief
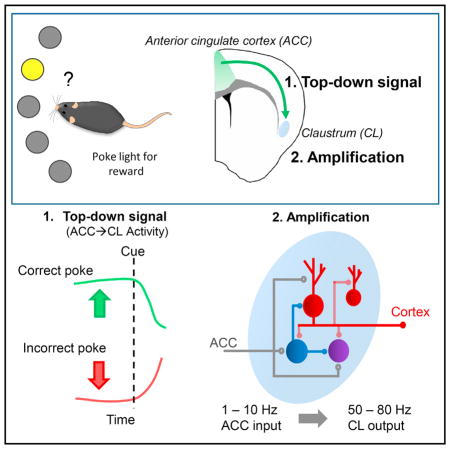
White et al. show that anterior cingulate cortex (ACC) input to the claustrum encodes a top-down preparatory signal on a 5-choice response assay that is critical for task performance. Claustrum microcircuitry amplifies top-down ACC input in a frequency-dependent manner for eventual propagation to the cortex for cognitive control of action.
INTRODUCTION
Top-down cognitive processing is critical for identifying and responding to stimuli relating to reward in a largely irrelevant sensory world (Fuster and Jervey, 1982; Chelazzi et al., 1993, 1998; Miller et al., 1993; Desimone, 1998). Top-down processing initiates in frontal executive cortices that modulate activity in downstream brain regions that are necessary for short-term memory and attention (Kastner and Ungerleider, 2000; Buschman and Miller, 2007; Miller and Buschman, 2013; Morishima et al., 2009; Moore and Armstrong, 2003; Zhang et al., 2014; Crowe et al., 2013). The neural circuit mechanisms underlying top-down control are, however, poorly understood. Identified candidate top-down circuits arising from frontal cortices include direct inputs to posterior sensory cortices, thalamus, and claustrum (Miller and Buschman, 2013; Zhang et al., 2014; Mathur, 2014). Given that prefrontal cortex neurons can encode task performance differentially based on projection target (Otis et al., 2017), it is critical to determine which signals are being propagated to claustrum, for instance, and how these signals (Zhang et al., 2016).
Owing to its elongated shape and proximity to white matter structures, the claustrum is an anatomically and functionally poorly described structure. It is known that the claustrum is highly interconnected with many areas of cortex (Mathur, 2014; Crick and Koch, 2005; Torgerson et al., 2015; Mathur et al., 2009), including prefrontal, parietal, and visual cortices in monkey (Druga et al., 1990; Pearson et al., 1982; Reser et al., 2014; Riche and Lanoir, 1978; Tanné-Gariépy et al., 2002; Gattass et al., 2014; Ungerleider et al., 1984), as well as prelimbic and cingulate cortices of the rat (White et al., 2017; Wang et al., 2017; Atlan et al., 2017; Smith and Alloway, 2010; Smith et al., 2012). However, it is unknown whether claustrum mediates top-down or bottom-up information flow (Mathur, 2014), sits atop the information processing hierarchy to bind sensory information for conscious perception (Crick and Koch, 2005), or exists solely as a satellite processer for cortices (Olson and Graybiel, 1980). Based on recent work showing that the rat claustrum receives a dense innervation from the anterior cingulate cortex (ACC; White et al., 2017), an area implicated in top-down attention (Zhang et al., 2014, 2016), we hypothesize that the claustrum is positioned to receive top-down input for cognitive control (Mathur, 2014). Testing this, we found that ACC input to the mouse claustrum encodes an anticipatory top-down signal that is proportional to task load and required for optimal performance accuracy. We find that ACC input is reshaped by a complex claustral microcircuitry. These findings provide critical functional evidence supporting the hypothesis that the claustrum functions as part of top-down executive networks.
RESULTS
Top-Down Cortical Input from the ACC, but Not Bottom-Up Cortical Input, Drives Claustrum Output
Using validated claustrum markers in rat (Mathur et al., 2009), guanine nucleotide-binding protein gamma 2 (GNG2) and isomorphic parvalbumin (PV) immunostaining, we anatomically delineated mouse claustrum (Figures 1A–1D). Using this anatomical definition, we found that inputs arising from the ACC were rich in the claustrum relative to surrounding structures (Figures 1E–1H). To test the functional consequence of ACC afferent stimulation for claustrum output, we performed whole-cell patch-clamp recordings in acute slices from spiny glutamatergic projection neurons in the claustrum (Brand, 1981; Braak and Braak, 1982). While recording, we activated ACC afferents virally expressing channelrhodopsin-2 (AAV [adeno-associated virus]-ChR2) with 470-nm light. Dendritic spines were identified post hoc. Stimulation at 20 Hz of ACC afferents consistently elicited action potential (AP) generation in spiny claustrum neurons (Figure 1I; Table 1), suggesting that top-down ACC inputs to the claustrum drive the output of the structure. In contrast, bottom-up cortical inputs arising from the primary visual cortex (V1) and somatosensory cortex (S1) were sparse (Figures 1J–1M). In addition, optogenetic activation of ChR2-expressing afferents from various primary, secondary, and association cortices, individually or in combination, only elicited small excitatory post-synaptic potentials and not AP firing in claustrum projection neurons (Figure 1N; Table 1). As such, bottom-up cortical inputs to the claustrum may only provide modulatory excitation in contrast to top-down input arising from the ACC.
Figure 1. Top-Down ACC Inputs Drive Claustrum Output, whereas Bottom-Up Cortical Inputs from Primary Sensory and Motor Cortices Only Modulate Output.

(A–D) Identification and validation of mouse claustrum anatomical boundaries.
(A) Parvalbumin (PV) immunostaining revealed the location of the mouse claustrum (white box): lateral to the external capsule (EC) and medial to insular cortex (IC).
(B–D) PV immunostaining was isomorphic with immunostaining for guanine nucleotide binding protein gamma 2 (GNG2; B) and PV (C) were isomorphic (D) and delineated claustrum borders (dotted line).
(E–H) Injection of the anterograde tracer biotinylated dextran amine (BDA; 10,000 MW) into the ACC (E) labeled axon terminals in the claustrum (F). PV immunostaining (G) was isomorphic with labeled terminals (H).
(I) Schematic and representative trace of a claustrum (CL) spiny projection neuron that fired action potentials (APs) in response to 20-Hz optogenetic activation of ACC afferents expressing channelr-hodopsin-2 (AAV-ChR2).
(J and K) Injection of BDA into primary visual cortex (V1; J) resulted in sparse labeling terminals in the claustrum (K).
(L and M) Injection of BDA into primary somatosensory cortex (S1; L) resulted in sparse labeling of terminals in the claustrum (M).
(N) Representative traces of excitatory post-synaptic potentials recorded from claustrum neurons in response to 20 Hz optogenetic activation primary auditory (A1) and V1 cortical afferents (top) or primary motor (M1) and S1 cortical afferents (bottom).
Horizontal scale bars, 200 μm in (B)–(D), (F)–(H), (K), and (M); and 2 s in (I) and (N). Vertical scale bars, 30 mV in (I) and (N).
Table 1.
Summary of Claustrum Spiny Projection Neuron Responses to Optogenetic Activation of Afferents from Various Cortical Sources
| Circuit | % Responsive | % Firing/ Responsive | n |
|---|---|---|---|
| ACC →CL | 100 | 100 | 14 |
| M1 + S1 →CL | 33.3*** | 0** | 9 |
| A1 + V1 →CL | 40** | 0*** | 10 |
| S2 + V2 →CL | 81.8 | 0**** | 11 |
| PtA →CL | 0**** | N/A | 5 |
For each cortical afferent source to claustrum (CL), the percentage of spiny projection neurons that exhibited PSPs or APs (% Responsive), the percentage of these responsive neurons that fire APs (% Firing/ Responsive), and the total number of neurons recorded are presented (n). The proportion of responsive neurons and responsive neurons that fire APs was compared between ACC afferent stimulation and each other afferent source tested.
Fisher’s exact test:
p < 0.01;
p < 0.005;
p < 0.0001.
S2, secondary somatosensory cortex; V2, secondary visual cortex; PtA, parietal association cortex; N/A, not applicable.
ACC →Claustrum Circuitry Encodes a Top-Down Expectation Signal that Is Proportional to Task Load
To test whether ACC afferents to the claustrum encode top-down signals, we used the five-choice serial reaction time task (5CSRTT; Muir et al., 1996; Passetti et al., 2002; Dalley et al., 2004; Robinson et al., 2008), a cognitively demanding task that requires top-down processing (Kastner and Ungerleider, 2000; Desimone and Duncan, 1995; Robbins, 2002; Mesulam, 1990; Awh and Jonides, 2001). We first assessed whether the fixed inter-trial interval (ITI) version or the randomized ITI version of the task more effectively recruits top-down processing by displaying a light distractor immediately prior to the cue onset. Mouse performance accuracy was greater on the fixed ITI version of the task in the presence of a visual distractor, as compared to performance accuracy on the random ITI version of the task with a visual distractor. This suggests that a degree of top-down filtering of the distractor is occurring on the fixed ITI 5CSRTT (Figures S1A–S1C). As such, we used the standard fixed ITI version of the task (without visual distractors) for subsequent experiments. While mice performed the fixed ITI 5CSRTT task, we monitored the calcium-dependent activity of ACC afferents transfected with GCaMP6f (AAV-GCaMP6f) in the claustrum using fiber photometry (Figure 2A). We examined the signal from the channel corresponding to the peak GCaMP6f signal and from an off-peak channel to detect artifactual signal changes (Figure 2B). We confirmed the location of the multimode fiber implantation and light path in the claustrum post hoc (Figure 2B). Activity of the ACC → claustrum afferents on correct trials was selectively increased prior to presentation of the cue compared to incorrect and omission trials (Figure 2C), supporting a role in top-down signaling. Signals from the off-peak channel were unchanged in all trial types (Figure S2). To test whether the elevated circuit activity is specific to the cognitive demand or, rather, the sensory/motor integration aspect of the task, mice were trained to perform a one-choice serial reaction time task (1CSRTT) in which the same aperture is illuminated on every trial. Relative to correct 5CSRTT trials, ACC afferents in the claustrum exhibited significantly less activity on 1CSRTT correct trials (Figure 2D), suggesting that the circuit likely encodes task components relating to the cognitive demand.
Figure 2. ACC Inputs to Claustrum Encode a Top-Down Expectation Signal Proportional to Task Load.

(A) Experimental schematic showing the five-choice serial reaction time task (5CSRTT) with a fixed inter-trial interval (ITI) and AAV-GCaMP6f injection into ACC for monitoring of calcium-dependent activity of ACC afferents in the claustrum using fiber photometry.
(B) Left: representative section showing the multimode fiber implant (white box) and estimated light path (dotted lines) that targeted claustrum. Right: GCaMP6f peak and off-peak (control) signals were monitored during trials. Pink represents highest photon counts.
(C) Averaged traces are shown of percent fluorescence changes of ACC afferents in claustrum during 5CSRTT performance normalized to baseline (%ΔF/F) for correct, incorrect, and omission trials. During the 2-s interval preceding the cue onset, %ΔF/F was greater on correct trials relative to incorrect and omission trials (Friedman test, p < 0.01; post hoc Dunn’s test, *p < 0.05 and **p < 0.01; n = 7).
(D) Averaged trace is shown of ACC afferent %ΔF/F activity for correct trials performed during the one-choice serial reaction time task, a sensory-motor control task. ACC afferent activity 2 s prior to light cue delivery during correct trials on the 5CSRTT was greater relative to the 1CSRTT (Wilcoxon rank-sum test, *p < 0.05; n = 7).
Horizontal scale bars, 200 μm. Vertical scale bar, 1% ΔF/F.
ACC →Claustrum Circuitry Is Critical for Top-Down Cognitive Control of Action
To causally test a role for the ACC → claustrum circuit in 5CSRTT performance, we optogenetically manipulated this circuit using either viral expression of ChR2 (AAV-ChR2) or halorhodopsin (AAV-eNpHR3.0) in the ACC. Control mice solely expressed a fluorophore in the ACC (AAV-enhanced yellow fluorescent protein [AAV-eYFP]; Figure 3A). We confirmed the placement of the fiber optic implant and light path in the claustrum post hoc (Figure 3B). We found that spiny projection neurons exhibited faithful activation in response to low-frequency (10-Hz) optogenetic stimulation of ACC afferents and a loss of AP generation in response to high-frequency (40-Hz) stimulation (Figure 3C). Notably, 40-Hz light delivery did not alter the ability of claustrum neurons to fire in response to an electrical stimulus delivered by a stimulating electrode placed near the recorded neurons, suggesting that the 40-Hz optogenetic activation was specific to altered ACC terminal function (Figure S3A).
Figure 3. Optogenetic Disruption of ACC →Claustrum Circuitry Impairs 5CSRTT, but Not 1CSRTT, Performance.

(A) Enhanced yellow fluorescent protein (AAV-eYFP), ChR2 (AAV-ChR2), or halorhodopsin (AAV-eNPhR3.0) were virally expressed in the ACC, and fiber optic implants were placed in the claustrum (n = 7, n = 9, and n = 7, respectively).
(B) Representative section showing the optical fiber implant (white box) and estimated light path (dotted lines) in the claustrum.
(C) Claustrum projection neurons did not faithfully fire to 0.5 s of 40-Hz light delivery (n = 10 of 10).
(D) For AAV-eYFP and AAV-ChR2 mice, 0.5 s of 10- or 40-Hz light train was delivered 0.5 s prior to cue onset. For AAV-eNPhR3.0 mice, continuous light was delivered for 1 s prior to the light cue.
(E) Choice accuracy, omission rate, and correct response latency of AAV-eYFP mice were not different on 40-Hz stimulation trials (blue symbols), compared to those on control trials (gray symbols).
(F) Choice accuracy, omission rate, and correct response latency of AAV-ChR2 mice were not different on 10-Hz stimulation trials (blue symbols), compared to those on control trials (gray symbols).
(G) Choice accuracy, but not omission rate or correct response latency, of AAV-ChR2 mice was reduced on 40-Hz stimulation trials (blue symbols), compared to that on control trials (gray symbols).
(H) In AAV-ChR2 mice, the decrease in choice accuracy on 40-Hz stimulation trials (blue symbols) was similar to the decrease in accuracy on trials paired with a blinking visual distractor in separate sessions (0.5 s pre-cue; gray symbols; n = 9).
(I) Left: in AAV-eYFP mice, the change in accuracy on trials with paired 40-Hz stimulation did not differ between the 5CSRTT and 1CSRTT. Right: in AAV-ChR2 mice, the reduction in accuracy on 40-Hz stimulation trials was greater during the 5CSRTT compared to the 1CSRTT.
(J) In acute slices, continuous 470-nm light delivery (blue bar) abolished firing of a neuron expressing eNPhR3.0 (n = 3 of 3) during a +30-mV voltage step.
(K) Choice accuracy, but not omission rate or correct response latency, of AAV-eNPhR3.0 mice was reduced on 1-s continuous stimulation trials (blue symbols) compared to that on control trials (gray symbols).
(L) In AAV-eNPhR3.0 mice, the reduction in accuracy on 1-s continuous stimulation trials was greater during the 5CSRTT compared to that during the 1CSRTT. Wilcoxon rank-sum test: *p < 0.05, and ***p < 0.005.
Horizontal scale bars, 200 μm in (B), 200 ms in (C), and 500 ms in (J). Vertical scale bars, 30 mV in (C) and (J).
Therefore, we used 0.5 s of 10- or 40-Hz, 470-nm stimulation of ACC afferents to achieve bidirectional control of the ACC → claustrum circuit prior to cue onset in the 5CSRTT (Figure 3D), a method similar to that established by Liske et al. (2013). In AAV-eYFP control mice, we also delivered 0.5 s of 40-Hz light to the claustrum prior to the onset of the cue (Figure 3D), which did not alter choice accuracy, omission rate, or correct response latency relative to within-session trials on which light was not delivered (Figure 3E). Stimulation of ACC afferents in the claustrum at 10 Hz in AAV-ChR2 mice also did not result in any changes in any of these metrics relative to within-session control trials (Figure 3F). In contrast, stimulation of ACC afferents at 40 Hz in AAV-ChR2 mice led to a specific deficit in choice accuracy, the working metric definition for attention on 5CRSTT (Muir et al., 1996; Passetti et al., 2002; Dalley et al., 2004; Robinson et al., 2008), compared to within-session control trials, while omission rate and correct response latency were unchanged (Figure 3G). To understand the extent of the temporal window of ACC →claustrum circuit activity critical for optimal 5CSRTT performance, we also delivered 0.5 s of 40-Hz stimulation at 0.75, 1, or 3 s prior to the cue. Choice accuracy was also reduced with 40-Hz stimulation at 0.75 and 1 s prior to the cue but not at 3 s (Figure S3B). At 0.75 s prior to the cue, 40-Hz stimulation also increased omission rate and correct response latency (Figure S3B). Light delivery prior to the cue did not affect choice accuracy, omission rate, or correct response latency in AAV-eYFP control mice at any time point (Figure S3C).
We next examined the deficit in nose-poke accuracy from a visual distractor presented 0.5 s prior to the cue and found it was comparable to the deficit in poke accuracy induced by optogenetic disruption in the AAV-ChR2 group (Figure 3H). Thus, poke accuracy is consistent with the operational definition of attention from past reports (Muir et al., 1996; Passetti et al., 2002; Dalley et al., 2004; Robinson et al., 2008). Consistent with the concept that the claustrum encodes the cognitive load of the task, 40-Hz light delivery in AAV-ChR2 mice during the 1CSRTT was less detrimental to choice accuracy compared to the 5CSRTT (Figure 3I). In AAV-eYFP mice, the effect of 40-Hz blue light delivery on choice accuracy was not different between 5CSRTT and 1CSRTT (Figure 3I). Optogenetic manipulations had no impact on movement velocity or real-time place preference/aversion in any group (Figures S4A–S4F), underscoring the cognitive specificity of the deficits.
To control for possible antidromic spiking induced by 40-Hz ChR2 activation, we used mice injected with AAV-eNPhR3.0 into the ACC to inactivate the ACC → claustrum circuit with 470-nm light for 1 s prior to the cue. We demonstrate that 470-nm light is sufficient to abolish AP generation in eNPhR3.0-expressing neurons (Figure 3J); we used blue light, as red-shifted light frequencies led to choice accuracy deficits in control mice (data not shown). Consistent with our prior findings, the activation of eNPhR3.0 in ACC terminals of claustrum prior to the cue led to a selective deficit in choice accuracy relative to within-session control trials and did not alter omission rate or correct response latency (Figure 3K). In addition, the deficit in accuracy on inactivation trials was greater during the 5CSRTT task than during the 1CSRTT control task (Figure 3L).
ACC Afferent Activation Recruits Diverse Claustral Microcircuits
If the claustrum functions as part of a top-down executive network, it is critical to understand how the claustrum processes top-down input. We used whole-cell patch-clamp recordings to first examine the responsivity of claustrum microcircuit components to optogenetic ACC afferent stimulation (Figure 4A). Microcircuit components consisted of spiny neurons, which are known excitatory projection neurons, and aspiny neurons, which are known inhibitory interneurons (Brand, 1981; Braak and Braak, 1982). Aspiny neurons were further subdivided into PV+ and PV− subtypes, which is consistent with the finding that the claustrum is richly PV immunopositive (Mathur et al., 2009).
Figure 4. Claustrum Neuron Responsivity to ACC Input.

(A) Experimental schematic showing postsynaptic responses of claustrum spiny projection neurons (red), as well as PV− (purple) and PV+ (blue) aspiny interneurons that were recorded in response to optogenetic ACC stimulation.
(B) Normalized postsynaptic currents (PSCs) recorded at −60 mV from spiny projection neurons before (black trace) and after application of tetrodotoxin (TTX; 500 nM) with 4-aminopyridine (4-AP; 100 μM; red trace). Most spiny neurons (n = 14 of 18; dark red bar) received a monosynaptic (m) input from the ACC, and fewer (n = 4 of 18; light red bar) received exclusively a polysynaptic (p) input.
(C) TTX with 4-AP application (red bar) resulted in faster PSC decay kinetics (white bar; n = 10). Wilcoxon rank-sum test, *p < 0.05.
(D) Polysynaptic PSC magnitude was larger with a CsCl-based, high-chloride internal recording pipette solution (red trace: −1,616 ± 359 pA; mean ± SEM; n = 4) compared to a CsMeSO3-based, low-chloride internal solution (black trace: −445 ± 54 pA; mean ± SEM; n = 5). Mann-Whitney U test, p < 0.05.
(E) Representative traces of spiny neurons responses to ACC afferent stimulation in current-clamp (top) and voltage-clamp (bottom) configurations. A majority of spiny neurons exhibited synaptic depression during stimulation (n = 12 of 14).
(F) Excitatory postsynaptic potentials (EPSPs) from an aspiny PV− claustrum neuron in response to ACC afferent stimulation. A majority of PV− neurons received a monosynaptic ACC input (purple trace: n = 7 of 9; dark purple bar).
(G) Robust AP generation in a PV+ neuron during ACC afferent stimulation. A majority of PV+ neurons received a monosynaptic ACC input (n = 8 of 9; dark blue).
(H) Optogenetic activation of PV+ interneurons rapidly abolished AP firing of claustrum spiny neurons that was elicited by current injection (n = 14 of 14).
(I) Frequent spontaneous inhibitory postsynaptic current (sIPSC) events recorded at a holding potential of −60 mV from spiny neurons in the presence of NBQX (5 μM) and APV (50 μM; black trace) were abolished in the presence the GABAA blocker GABAzine (10 μM; red trace; n = 10 of 10).
Horizontal scale bars, 100 ms in (B), (D), (F [right]), and(G [right]); 200 ms in (F [left]), (G [left]), and (H); and 10 s in (I). Vertical scale bars, 500 pA in (B); 30 mV in (F), (G), and (H); and 100 pA in (I).
We recorded data from spiny neurons and observed two types of responses to ACC afferent stimulation: a predominantly monosynaptic input with a polysynaptic component (Figure 4B) and a purely polysynaptic response. In neurons with a monosynaptic input, we observed faster post-synaptic current (PSC) decay times after the application of tetrodotoxin (TTX) and 4-aminopyridine (4-AP; Figure 4C). A high-chloride internal pipette solution magnified polysynaptic PSCs in spiny neurons, suggesting that polysynaptic PSCs have an inhibitory component (Figure 4D). Also, we observed multiple fast inward PSCs followed by a slow outward PSC at holding potentials beyond ECl− (Figures S5A and S5B), suggesting that the polysynaptic component is derived from both excitatory and inhibitory microcircuits. PV− and PV+ aspiny neurons also exhibited multiple fast inward PSCs beyond ECl− (Figure S5B). These lines of evidence suggest that the ACC recruits excitatory and inhibitory claustral microcircuits, which elaborates upon previous work (Kim et al., 2016).
We next recorded data from PV− and PV+ aspiny interneurons. Firing of claustral PV− interneurons was seldom observed in response to ACC afferent stimulation. PSCs were predominantly monosynaptic in nature (Figure 4F). In contrast, PV+ inter-neurons exhibited burst firing in response to ACC stimulation; monosynaptic input onto these cells was also prevalent (Figure 4G). These results suggest that PV+ neurons may provide feed-forward inhibition. Supporting this, we found that PV+ inter-neuron optogenetic activation abolishes the firing of spiny neurons (Figure 4H) and aspiny PV− interneurons (n = 3 of 3). Interestingly, we observed large, frequent spontaneous inhibitory PSCs in spiny neurons that were mediated by GABAA receptors (Figure 4I), which suggests that spiny claustrum neurons are under a strong inhibitory tone. A summary depiction of claustrum macro- and micro-circuitry findings is presented in Figure S6.
Claustrum Transformation of ACC Signals Is Frequency and Inhibitory Microcircuitry Dependent
We next explored how the claustrum transforms ACC input. We initially observed that claustrum projection neurons burst fired in excess of 100 Hz in response to a fixed frequency of ACC afferent stimulation (Figures 1I and 5A). We measured the AP burst frequency and the number of APs generated by claustrum spiny projection neurons in response to optogenetic activation of ACC afferents for 4 s of 1-, 5-, 10-, or 20-Hz stimulation trains (Figure 5B). Throughout 1-Hz and 5-Hz ACC afferent stimulation trains, claustrum spiny projection neurons generated high-frequency bursts of APs at 1-Hz or 5-Hz input frequencies. At 10-or 20-Hz input, claustrum spiny neurons initially amplified but underwent a subsequent decay in firing output (Figure 5B). At 20-Hz ACC input, claustrum output was mostly abolished by the end of stimulation.
Figure 5. Frequency- and Microcircuit-Dependent Transformation of ACC Input to Claustrum.

(A) Representative trace showing frequency of a claustrum projection neuron burst fire in response to 20 Hz ACC optogenetic stimulation.
(B) Left: average of burst firing frequency and frequency of APs between light pulses of claustrum spiny projection neurons over time in response to 1-, 5-, 10-, or 20-Hz trains of ACC afferent stimulation (n = 10). Right: average number of APs elicited at each light pulse over time in response to 1-, 5-, 10-, or 20-Hz trains of ACC afferent stimulation (n = 10).
(C) Left: representative trace of epileptiform response to a single optogenetic ACC afferent stimulation in the presence of GABAzine (10 μM). Middle: epileptiform response persisted for multiple pulses during a 20-Hz train. Right: representative trace of an enlarged PSC recorded in the presence of GABAzine.
(D) Average frequency of projection neuron AP output generated by the first (filled bars) or last (unfilled bars) light pulses during ACC afferent stimulation in normal aCSF (black) or in GABAzine (10 μM; red). Averages are shown for 1-, 5-, 10-, and 20-Hz trains (n = 10). Two-way repeated-measures ANOVA revealed a significant interaction between ACC stimulation frequency and GABAzine treatment (p < 0.0001). Post hoc Holm-Sidak test: *p < 0.05, **p < 0.01, ***p < 0.001, and ****p < 0.0001.
(E) The average AP output of claustrum spiny projection neurons as a percent change from ACC input (e.g., 1) plotted as either the response to the first (filled bars) or last (unfilled bars) light pulses in normal aCSF (black) or in the presence of GABAzine (10 μM; red). Two-way repeated-measures ANOVA revealed a significant interaction between ACC stimulation frequency and GABAzine treatment (p < 0.0001). Post hoc Holm-Sidak test: *p < 0.05, **p < 0.01, ***p < 0.001, and ****p < 0.0001.
Horizontal scale bars, 50 ms in (A) and (C [middle]); 200 ms in (C [left]); and 500 ms in (C [right]). Vertical scale bars, 30 mV in (A) and (C [left and middle]); and 2 nA in (C [right]).
To determine how GABAergic microcircuitry shapes these responses, we delivered the various ACC afferent stimulation frequencies in the presence of the GABAA blocker GABAzine. GABAzine elicited prolonged epileptiform-like responses in these neurons (Figure 5C) and prolonged PSCs (Figure 5C). Comparing frequencies of AP firing with and without GABAzine treatment at the first pulse and at the last light pulse across the ACC stimulation frequencies using a two-way repeated-measures ANOVA (Figure 5D), we observed a main effect of GABAzine treatment: increased output frequency at the first light pulse (p = 0.004) but not the last (p = 0.4). Post hoc analyses revealed that this effect was preserved at every stimulation frequency (Figure 5D). This suggests that GABAergic microcircuits constrain the claustrum signal transformation at stimulation onset. Analysis of the number of claustrum spiny-projection neuron APs in response to each light pulse as a percent change of the input revealed largely similar effects (Figure 5E). We observed a main effect of GABAzine wherein treatment increased the percent change in APs at the first light pulse (p < 0.0001) but not at the last pulse (p = 0.6). This effect was consistent across all ACC stimulation frequencies, but notably, at 1 Hz GABAzine treatment maintained an increased AP output as a percentage of the ACC input even at the last pulse compared to baseline (Figure 5E).
DISCUSSION
We found that the claustrum receives a rich innervation from the ACC that drives claustrum output and encodes a preparatory signal prior to cue delivery on the 5CSRTT task, consistent with known ACC function (Totah et al., 2009). On the 1CSRTT, ACC input to the claustrum prior to the signal is relatively diminished. This suggests that this expectation signal is proportional to cognitive load. Disruption of ACC →claustrum signaling prior to cue onset decreases nose-poke accuracy on 5CSRTT. ACC input is processed by a microcircuitry that is composed of spiny projection neurons and two distinct inhibitory interneuron populations within claustrum: PV− and PV+ aspiny neurons. These data demonstrate a circuit mechanism by which the claustrum amplifies top-down inputs for the purpose of cognitive control over action.
That the claustrum preferentially propagates input from ACC and not from sensorimotor cortices suggests that the claustrum is subservient to top-down circuit function rather than an integrator of sensory cortical information. The lack of claustrum spiny-projection neuron APs generated by sensorimotor input activation is likely not explained by truncation of particular portions of the dendritic arbor specifically receiving sensorimotor input, as this input to claustrum is relatively sparse (Figures 1J–1M). We also detect small excitatory postsynaptic potentials in response to stimulation of sensorimotor afferents, suggesting the relevant dendritic areas are present. Moreover, claustrum dendrites extend radially in all directions (Watakabe et al., 2014), which prevents systematic truncation of particular portions of dendrite. It is possible that the claustrum may serve to propagate processed top-down input to cortical areas lower in the cortical hierarchy, such as visual cortex and parietal association cortex (PtA). Alternatively, the claustrum may primarily provide feedback to the ACC, consistent with a previously indicated view of claustrum (Olson and Graybiel, 1980). Our results do not distinguish between these different circuit configurations, and further work is necessary to determine whether ACC inputs to claustrum drive neurons projecting to other cortices, provide feedback to ACC, or both.
While it is difficult to distinguish attentional mechanisms from other cognitive processes such as short-term memory in the 5CSRTT, our data could be interpreted to suggest that the ACC → claustrum circuit is involved in the attentional component of the 5CSRTT. Optogenetic disruption of ACC terminals in claustrum results in a decrease in poke accuracy, the standard metric of attention on the 5CSRTT (Muir et al., 1996; Passetti et al., 2002; Dalley et al., 2004; Robinson et al., 2008). Moreover, nose-poke accuracy is the only metric disrupted when mice were challenged with a visual distractor on 5CSRTT. As the claustrum receives input from the prelimibic prefrontal cortex, the claustrum may also subserve top-down signaling for short-term memory (Smith and Alloway, 2010; Yoon et al., 2008; Delatour and Gisquet-Verrier, 2000; Gisquet-Verrier and Delatour, 2006). If claustrum output coordinates frontal and parietal cortices, the claustrum may be a key node in the frontoparietal network active during attention and short-term memory tasks (Kastner and Ungerleider, 2000; Buschman and Miller, 2007; Miller and Buschman, 2013; Crowe et al., 2013). Further work is necessary to explore the possible role of the claustrum in frontoparietal network activation in animal models and human subjects.
Thalamic nuclei, reciprocally connected with frontal and visual cortices, are critical for attention and working memory (Saalmann and Kastner, 2011; Pinault, 2004; Sherman and Guillery, 2011; Parnaudeau et al., 2013) and direct connections between cortical areas enhance processing of salient visual stimuli (Zhang et al., 2014). These findings beg the question of why claustra process frontal input. Corticocortical inputs from ACC predominantly innervate layers II and III of cortices lower in the cortical hierarchy (Barbas and Rempel-Clower, 1997), and thalamic nuclei innervate layers II/III and IV (Herkenham, 1980). In contrast, claustral inputs predominantly target deeper layers such as IV, V, and VI (LeVay and Sherk, 1981), and this may depend on the cortical area being innervated by claustrum (Wang et al., 2017). These differences in cortical layer innervation suggest that claustral afferents’ effects on cortical activity may differ significantly from those of cortical and thalamic afferents. The claustrum may also uniquely process top-down input. Our data demonstrate that ACC monosynaptically drives claustrum microcircuitry consisting of spiny projection neurons that target cortex, PV− interneurons, and PV+ interneurons. These findings confirm and elaborate upon previous work (Kim et al., 2016). In addition, we found that claustrum amplifies 1- to 10-Hz ACC input persistently but 20-Hz ACC input only transiently and that claustrum inhibitory microcircuits critically constrain this amplification. The input frequencies undergoing optimal amplification by claustrum are in the 1- to 10-Hz range, which closely aligns with sustained firing rates of ACC neurons in a modified 5CSRTT (Totah et al., 2009).
The top-down circuitry described herein positions the claustrum as a critical node for executive control that ultimately guides action. While further work is needed to fully understand how claustrum neurons modulate cortical areas, the present data provide evidence for a top-down cognitive control system that may undergo perturbation in neuropsychiatric illness (Morys et al., 1996; Cascella et al., 2011).
EXPERIMENTAL PROCEDURES
Animals
113 C57BL/6J wild-type mice, transgenic mice encoding cre recombinase in the PV gene (PV-cre; Tanahira et al., 2009; Mathur et al., 2013), and transgenic mice encoding TdTomato flanked by loxP sites (Madisen et al., 2010) crossed with PV-cre mice (PV-cre x FloxTdTom) of both sexes were used. Mice used for electrophysiology were 10–34 weeks of age at the time of experiments and were group housed, with food and water available ad libitum. In contrast, mice used for behavioral experiments were 16–76 weeks of age at the time of experiments. These mice were singly housed, weighed daily, and fed daily to maintain 90% of their ad libitum weight. All mice were on a 12-hr:12-hr light: dark cycle beginning at 0700, and 5CSRTT experiments were performed during the light cycle. This study was performed in accordance with the NIH Guide for Care and Use of Laboratory Animals and the University of Maryland School of Medicine Animal Care and Use Committee.
Neuronal Tract Tracing
For anterograde injections, 100 nL of a 15% solution of 10,000 MW (molecular weight) biotinylated dextran amine (BDA; Life Technologies, Grand Island, NY, USA) was pressure injected into the cortical area of interest.
Histochemistry and Immunohistochemistry
Mice were transcardially perfused with room-temperature 0.1 M PBS, pH 7.3, followed by ice-cold 4% (w/v) paraformaldehyde in PBS. After extraction, brains were post-fixed with 4% paraformaldehyde in PBS overnight at 4°C. Coronal sections were cut using an Integraslice 7550 MM vibrating microtome (Campden Instruments, Loughborough, England) at a thickness of 50 μm. Sections were either immediately processed or were stored at −20°C in a solution of 30% sucrose and 30% ethylene glycol in 0.1 M PBS. Rabbit or goat anti-PV antibodies (Swant, Bellinoza, Switzerland) were used at a 1:800 dilution, and rabbit anti-GNG2 antibody (Sigma-Aldrich, St. Louis, MO) was used at a 1:300 dilution. A chicken anti-GFP (1:2,000; Abcam, Cambridge, MA) antibody was used for GCaMP6f and eYFP immunohistochemistry. Secondary donkey anti-rabbit, anti-goat, or anti-chicken antibodies conjugated to either Cy3 or Alexa Fluor 488 were used at 1:500 dilutions (Jackson ImmunoResearch, West Grove, PA, USA). Sections from animals receiving BDA anterograde tracer injections were incubated with streptavidin protein conjugated with Cy3 or Alexa Fluor 488 (1:1,000; Jackson ImmunoResearch) during secondary antibody incubation.
For post hoc histochemistry and immunohistochemistry of acute brain slices used in whole-cell electrophysiology, Brain BLAQ, a specialized protocol to minimize lipid and aldehyde auto-fluorescence, was utilized (Kupferschmidt et al., 2015). For these slices, the same chicken anti-GFP antibody described earlier and streptavidin (1:1,000; Jackson ImmunoResearch) were used for labeling of eYFP-tagged ChR2 and neurobiotin-filled neurons, respectively.
Ex Vivo Brain Slice Preparation for Electrophysiology
Following anesthetization, mice were decapitated, and 250-μm coronal sections from the extracted brains were cut using a vibrating microtome in ice-cold, carbogen (95% O2, 5% CO2)-bubbled, high-sucrose artificial cerebrospinal fluid (aCSF), which contained 194 mM sucrose, 30 mM NaCl, 4.5 mM KCl, 1 mM MgCl2, 26 mM NaHCO3, 1.2 mM NaH2PO4, and 10 mM D-glucose. Subsequently, sections were incubated for 30 min at 33°C in carbogen-bubbled aCSF (315–320 mOsm), which contained 124 mM NaCl, 4.5 mM KCl, 2 mM CaCl2, 1 mM MgCl2, 26 mM NaHCO3, 1.2 mM NaH2PO4, and 10 mM D-glucose. Sections were incubated at room temperature until use for whole-cell patch-clamp recordings, which were performed in the same aCSF formulation used for incubation unless otherwise indicated.
Whole-Cell Current and Voltage-Clamp Recordings
Whole-cell recordings were performed at 29°C–31°C using borosilicate glass recording pipettes of 3–7 MΩ resistance. For recordings performed in a current-clamp configuration, recording pipettes were filled with a potassium-based solution (290–295 mOsm; pH 7.3) composed of 126 mM potassium gluconate, 4 mM KCl, 10 mM HEPES, 4 mM ATP-Mg, 0.3 mM GTP-Na, and 10 mM phosphocreatine. For recordings performed in a voltage-clamp configuration, recording pipettes were filled with a CsMeSO3-based internal solution (300–310 mOsm; pH 7.3) composed of 114 mM CsMeSO3, 5 mM NaCl, 1 mM tetraethylammonium (TEA)-Cl, 10 mM HEPES, 5 mM QX-314, 1.1 mM EGTA, 0.3 mM Na-GTP, and 4 mM Mg-ATP. To measure spontaneous inhibitory post-synaptic currents (sIPSCs) in a voltage-clamp configuration, recording pipettes were filled with a CsCl-based internal solution (300–310 mOsm; pH 7.3) composed of 150 mM CsCl, 10 mM HEPES, 2 mM MgCl2, 0.3 mM Na-GTP, 5 mM QX-314, 3 mM Mg-ATP, and 0.2 mM BAPTA. Clampex software (v10.4; Molecular Devices, Sunnyvale, CA) was used for electrophysiological recordings, which were filtered at 2 kHz and digitized at 10 kHz. A gravity perfusion system was used to deliver drugs to brain slices. GABAzine, tetrodotoxin, NBQX, and APV were purchased from Abcam.
Internal pipette solutions also contained hydrazide dye conjugated with Alexa Fluor 488 or 555 (40 μM) to visualize dendritic spines immediately following recordings. Alternatively, internal pipette solutions contained 3%–5% neurobiotin to co-localize recorded neurons with ChR2 expression in ACC terminals and visualize dendritic spines using the Brain BLAQ technique. For patch-clamp recordings of PV+ interneurons labeled in PV-cre × FloxTdTom mice or PV-cre mice injected with viral constructs expressing an eYFP tag in a cre-dependent manner, no hydrazide dye or neuro-biotin was included in the internal pipette.
For determination of chloride equilibrium (Ecl−), a CsMeSO3-based internal pipette solution and aCSF containing NBQX (5 μM) and APV (50 μM) were used. PSC decay time was defined as the time elapsed from 90% of the peak current to 10% of the peak current. This value was averaged over 10 sweeps for each condition for each cell.
For optogenetic excitation of cortical afferents in the claustrum, which was identified via the fluorescence of virally transfected axon terminals, an external LED was used to field-illuminate the entire claustrum to maximally excite any terminals in the claustrum. 470-nm light was delivered as a single 4- to 6-ms pulse or in 1-, 5-, 10-, 20-, or 40-Hz trains for 0.5–5 s. Repeated optogenetic stimulations, such as those used to evoke PSCs, occurred every 20 s.
Viral Vectors and Stereotaxic Procedures
For ex vivo and in vivo optogenetic stimulation of ACC afferents in the claustrum, 150–185 nL of an AAV-ChR2 H134R mutation under the hSyn promoter with an eYFP fluorescent tag (AAV5-hSyn-ChR2-eYFP; University of Pennsylvania Vector Core) was injected bilaterally at two rostrocaudal levels of the ACC (4 total injections). Relative to bregma (dorsal-ventral coordinates were measured from the brain surface), the coordinates for injections were as follows: (1) anterior (A)-posterior (P), +1.34 mm; medial (M)-lateral (L), ± 0.3 mm; and dorsal (D)-ventral (V), −1.25 mm; and (2) A–P, +0.74 mm; M–L, ± 0.3 mm; and D–V, −1.00 mm. For in vivo optogenetic inhibition of ACC afferents in the claustrum, a similar AAV vector expressing halorhodopsin (AAV5-hSyn-eNPhR3.0-eYFP; University of Pennsylvania Vector Core) was injected at the same ACC coordinates using the same volume. Control mice for in vivo optogenetic experiments were injected with an AAV vector expressing only eYFP (AAV5-hSyn-eYFP; University of Pennsylvania Vector Core) at the same ACC coordinates using the same volume. AAV5-hSyn-GCaMP6f (University of Pennsylvania Vector Core) was injected bilaterally into the ACC at the same coordinates and using the same volume in mice used for in vivo fiber photometry.
For targeted whole-cell recordings and ex vivo optogenetic activation of PV+ interneurons, 80–110 nL of AAV vectors expressing loxP-flanked double-inverted open reading frames (DIOs) of eYFP (AAV5-eF1a-DIO-eYFP; University of Pennsylvania Vector Core) or ChR2 (AAV9-EF1a-DIO-ChR2-eYFP; University of Pennsylvania Vector Core), respectively, were injected bilaterally at two rostrocaudal levels of the claustrum (4 injections) in PV-cre mice. Relative to bregma, claustrum coordinates were as follows: (1) anterior-posterior, +1.34 mm; medial-lateral, ±2.3 mm; and dorsal-ventral (from the brain surface), −2.35 mm; and (2) anterior-posterior, +0.86 mm; medial-lateral, ±2.75 mm; and dorsal-ventral (from the brain surface), −2.55 mm.
For ex vivo optogenetic activation of afferents from combinations of primary and secondary sensory cortices in the claustrum, 185 nL of the same ChR2-expressing AAV described earlier for ACC afferent stimulation was injected bilaterally into two different primary sensory cortices at two different rostrocaudal levels of each targeted brain area (8 total injections). For all experiments using viral injections, viral incubation was no fewer than 4 weeks.
Mice used for in vivo optogenetics experiments were implanted bilaterally with chronic indwelling fiber optic implants into either ACC or claustrum. Fiber optic implants were custom made using high numerical aperture (NA) (0.66) fiber (Prizmatix; Giv’at Shmuel, Israel) epoxied into ceramic ferrules (ThorLabs; Newton, NJ) and affixed to the skull with dental cement. Mice used for in vivo fiber photometry received a unilateral implant into claustrum, which was custom made from low (0.22) NA fiber and ceramic ferrules (ThorLabs; Newton, NJ). Fiber implant placement relative to ACC afferents expressing ChR2 or GCaMP6f in the claustrum was confirmed post hoc using immunohistochemistry. The light path angle (θ) was approximated to ensure accurate implantation, using the known refractive index (n) of cortical tissue (Sun et al., 2012) and the respective fiber NA according to the following formula: NA = nsinθ. The distance of light penetration for GCaMP6f detection and ChR2 activation was approximated using previous estimates for each technique (Cui et al., 2013; Al-Juboori et al., 2013).
5CSRTT
5CSRTT (Muir et al., 1996; Passetti et al., 2002; Dalley et al., 2004; Robinson et al., 2008) was performed in four mouse operant chambers equipped with the 5CSRTT wall module (Med Associates; St. Albans, VT) and housed within sound-attenuating cabinets. Briefly, the 5CSRTT required a mouse to nose poke into one of five illuminable apertures mounted into a curved wall. On each trial, the correct aperture was pseudo-randomly selected (cue) and illuminated for 1 s after a 5-s ITI had elapsed. Responses could be made during the cue and up to 5 s after the cue. Correct nose pokes resulted in the dispensation of a sucrose pellet and illumination of the pellet receptacle recessed within the wall opposite the 5CSRTT wall module. A new trial did not begin until the reward was retrieved and a fixed 5-s reward consumption period elapsed. Nose pokes into the incorrect aperture, omissions, and nose pokes during the ITI resulted in a 5-s time-out period, during which the house light was extinguished. Any nose poke during the time-out period restarted the 5-s time-out.
For optogenetic experiments, 470-nm light was delivered bilaterally during experimental sessions using an LED system (Plexon; Dallas, TX); light delivery occurred pseudo-randomly on 33% of trials during the ITI period for 0.5 s and was delivered at a frequency of 40 or 10 Hz. Stimulation was delivered at 0.5, 0.75, 1, or 3 s before the onset of the cue, with the time of delivery fixed within a session. A session ended after 100 trials or 30 min, whichever occurred first. For each experimental manipulation, data were averaged across five sessions.
On sessions in which a visual distractor was presented, an LED was placed 2.5 in above the middle aperture of the five-choice wall. Distractor delivery, in the form of 40-Hz blinking of the LED, also occurred pseudo-randomly on 33% of trials during the ITI period 0.5 s pre-cue and for a duration of 0.5 s. Data were averaged across five sessions. For randomized ITI sessions, the ITI was pseudo-randomly selected to be 3, 4, 5, 6, or 7 s. The unpredictable presentation of a distractor before the onset of the cue was used previously to assess attentional deficits (Carli et al., 1983; Gendle et al., 2004).
Before experiments, mice progressed through the habituation, shaping, and training stages. In the habituation phase, mice were placed within the operant chamber for two 15-min sessions. Sucrose pellets were available in the receptacle. All of the chamber lights (i.e., house, receptacle, and 5CSRTT wall lights) remained on for the duration of the sessions. Mice were then shaped in two phases. In the first phase, all 5CSRTT apertures were active and remained illuminated indefinitely. Any nose poke was rewarded. Apertures were initially loaded with reward sucrose pellets. After 30 nose pokes in a 30-min session, mice progressed to the second phase of shaping. In the second phase, only one aperture was illuminated, and only a nose poke into the illuminated aperture was rewarded. Incorrect pokes did not result in a time-out, and the aperture was illuminated indefinitely. After 30 correct nose pokes in a 30-min session, mice progressed to the 5CSRTT training stage. 5CSRTT training used the same timing and response contingencies described earlier in the final 5CSRTT task, except for the cue-duration/limited-hold period. In the first training phase, the cue duration was 10 s, with a 15-s limited hold. After achieving 60% choice accuracy and 30 responses within a session, mice progressed to the second training phase, in which the cue duration was 5 s, with a limited hold of 5 s. After achieving 60% accuracy and 30 responses within a session, mice progressed to the final 5CSRTT task used for experiments (i.e., 1-s cue with 5-s limited hold). Mice were over-trained on the final task until choice accuracy reached a stable baseline before manipulations Subsequent to 5CSRTT experimental sessions, mice were trained to perform the 1CSRTT. All aspects of the task remained the same, except the middle aperture was illuminated and active on every trial. Mice were over-trained until performance stabilized before beginning experimental sessions. In experimental sessions, 470-nm light was delivered as described earlier for the 5CSRTT at 0.5 s before the onset of the cue.
In Vivo Fiber Photometry
Activity-dependent calcium signals of ACC afferents in the claustrum were monitored using time-correlated single-photon counting-based fiber photometry (Cui et al., 2013, 2014). In brief, photons emitted from a 470-nm pico-second pulsed laser (Becker and Hickl; Berlin, Germany) were transmitted through a multimode fiber connected to a chronic fiber implant in claustrum. Green photons emitted from GCaMP6f expressed in ACC afferents were collected through the multimode fiber, band-pass filtered, and relayed to a multi-spectral detector (Becker and Hickl). Data collection was controlled by a transistor-transistor logic (TTL) interface with the operant box. Data collection was triggered to start at the beginning of each trial (ITI) and lasted for 7 s. For each timepoint in a trial, percent fluorescence changes relative to baseline (% ΔF/F) were calculated using the median signal of the trial as a baseline. %ΔF/F was calculated for the GCaMP6f peak signal channel and an off-peak channel spectrally distinct from GCaMP6f. Data for each trial type (correct, incorrect, and omission) were averaged for an individual session, across sessions (10 for 5CSRTT and 9 for 1CSRTT), and across mice for peak and off-peak signals.
Real-Time Place Preference Assay
The real-time place preference (RTPP) apparatus consisted of a two-sided chamber connected with a narrow corridor. The RTPP assay consisted of habituation and test sessions. In the habituation session, mice were placed initially in the narrow corridor of the chamber and allowed free exploration for 20 min. On the following day, mice performed the test session, which paired one side of the chamber with 0.5 s of 10- or 40-Hz, 470-nm light bouts. These bouts were repeated, at most, every 20 s in order to approximate the amount of stimulation that occurred during the 5CSRTT sessions. The amount of time spent in each side of the chamber during sessions and ambulatory velocity was recorded with EthoVision XT v11.5 (Noldus, Wageningen, the Netherlands). The velocity during the 0.5 s of light delivery and the subsequent 2 s was compared to the 2.5 s preceding light delivery to determine any effect of light delivery on movement.
Data Analysis and Statistics
Electrophysiology data were analyzed using Clampex software (v10.4). Statistical analyses were performed in the GraphPad (Prism) or R (v3.2.3) statistical package. For this study, data distributions were assumed to be non-normal, and nonparametric tests were predominantly utilized, including Wilcoxon rank-sum, Mann-Whitney U, and Friedman tests as indicated. For in vivo fiber photometry data, a Friedman test with trial type as the factor of interest was utilized. Post hoc Dunn’s test compared omission and incorrect trial signal to correct trial signal.
Supplementary Material
Highlights.
ACC afferents to claustrum encode top-down signals on a five-choice response assay
Inactivation of ACC inputs to claustrum reduces five-choice task performance accuracy
Claustrum amplifies ACC input in an inhibitory microcircuitry-dependent fashion
Acknowledgments
This work has been supported by National Institute on Alcohol Abuse and Alcoholism grants K22AA021414 and R01AA024845 (to B.N.M.), Whitehall Foundation grant 2014-12-68 (to B.N.M.), National Institute of Mental Health grant F31MH112350, National Institute of General Medical Sciences grant T32GM008181 (to M.G.W.), and National Institute of Neurological Disorders and Stroke grant T32NS063391 (to M.G.W.).
Footnotes
Supplemental Information includes six figures and can be found with this article online at https://doi.org/10.1016/j.celrep.2017.12.023.
AUTHOR CONTRIBUTIONS
B.N.M. and M.G.W. designed experiments. M.G.W., M.P., A.M.C., C.M., and P.A.D. performed and analyzed behavioral experiments. M.G.W. performed and analyzed electrophysiological experiments. M.G.W. and B.M.R. performed and analyzed neuronal tract tracing experiments. M.G.W. and B.N.M. wrote the manuscript.
DECLARATION OF INTERESTS
The authors declare no competing interests.
References
- Al-Juboori SI, Dondzillo A, Stubblefield EA, Felsen G, Lei TC, Klug A. Light scattering properties vary across different regions of the adult mouse brain. PLoS ONE. 2013;8:e67626. doi: 10.1371/journal.pone.0067626. [DOI] [PMC free article] [PubMed] [Google Scholar]
- Atlan G, Terem A, Peretz-Rivlin N, Groysman M, Citri A. Mapping synaptic cortico-claustral connectivity in the mouse. J Comp Neurol. 2017;525:1381–1402. doi: 10.1002/cne.23997. [DOI] [PubMed] [Google Scholar]
- Awh E, Jonides J. Overlapping mechanisms of attention and spatial working memory. Trends Cogn Sci. 2001;5:119–126. doi: 10.1016/s1364-6613(00)01593-x. [DOI] [PubMed] [Google Scholar]
- Barbas H, Rempel-Clower N. Cortical structure predicts the pattern of corticocortical connections. Cereb Cortex. 1997;7:635–646. doi: 10.1093/cercor/7.7.635. [DOI] [PubMed] [Google Scholar]
- Braak H, Braak E. Neuronal types in the claustrum of man. Anat Embryol (Berl) 1982;163:447–460. doi: 10.1007/BF00305558. [DOI] [PubMed] [Google Scholar]
- Brand S. A serial section Golgi analysis of the primate claustrum. Anat Embryol (Berl) 1981;162:475–488. doi: 10.1007/BF00301872. [DOI] [PubMed] [Google Scholar]
- Buschman TJ, Miller EK. Top-down versus bottom-up control of attention in the prefrontal and posterior parietal cortices. Science. 2007;315:1860–1862. doi: 10.1126/science.1138071. [DOI] [PubMed] [Google Scholar]
- Carli M, Robbins TW, Evenden JL, Everitt BJ. Effects of lesions to ascending noradrenergic neurones on performance of a 5-choice serial reaction task in rats; implications for theories of dorsal noradrenergic bundle function based on selective attention and arousal. Behav Brain Res. 1983;9:361–380. doi: 10.1016/0166-4328(83)90138-9. [DOI] [PubMed] [Google Scholar]
- Cascella NG, Gerner GJ, Fieldstone SC, Sawa A, Schretlen DJ. The insula-claustrum region and delusions in schizophrenia. Schizophr Res. 2011;133:77–81. doi: 10.1016/j.schres.2011.08.004. [DOI] [PubMed] [Google Scholar]
- Chelazzi L, Miller EK, Duncan J, Desimone R. A neural basis for visual search in inferior temporal cortex. Nature. 1993;363:345–347. doi: 10.1038/363345a0. [DOI] [PubMed] [Google Scholar]
- Chelazzi L, Duncan J, Miller EK, Desimone R. Responses of neurons in inferior temporal cortex during memory-guided visual search. J Neurophysiol. 1998;80:2918–2940. doi: 10.1152/jn.1998.80.6.2918. [DOI] [PubMed] [Google Scholar]
- Crick FC, Koch C. What is the function of the claustrum? Philos Trans R Soc Lond B Biol Sci. 2005;360:1271–1279. doi: 10.1098/rstb.2005.1661. [DOI] [PMC free article] [PubMed] [Google Scholar]
- Crowe DA, Goodwin SJ, Blackman RK, Sakellaridi S, Sponheim SR, MacDonald AW, 3rd, Chafee MV. Prefrontal neurons transmit signals to parietal neurons that reflect executive control of cognition. Nat Neurosci. 2013;16:1484–1491. doi: 10.1038/nn.3509. [DOI] [PMC free article] [PubMed] [Google Scholar]
- Cui G, Jun SB, Jin X, Pham MD, Vogel SS, Lovinger DM, Costa RM. Concurrent activation of striatal direct and indirect pathways during action initiation. Nature. 2013;494:238–242. doi: 10.1038/nature11846. [DOI] [PMC free article] [PubMed] [Google Scholar]
- Cui G, Jun SB, Jin X, Luo G, Pham MD, Lovinger DM, Vogel SS, Costa RM. Deep brain optical measurements of cell type-specific neural activity in behaving mice. Nat Protoc. 2014;9:1213–1228. doi: 10.1038/nprot.2014.080. [DOI] [PMC free article] [PubMed] [Google Scholar]
- Dalley JW, Cardinal RN, Robbins TW. Prefrontal executive and cognitive functions in rodents: neural and neurochemical substrates. Neurosci Biobehav Rev. 2004;28:771–784. doi: 10.1016/j.neubiorev.2004.09.006. [DOI] [PubMed] [Google Scholar]
- Delatour B, Gisquet-Verrier P. Functional role of rat prelimbic-infralimbic cortices in spatial memory: evidence for their involvement in attention and behavioural flexibility. Behav Brain Res. 2000;109:113–128. doi: 10.1016/s0166-4328(99)00168-0. [DOI] [PubMed] [Google Scholar]
- Desimone R. Visual attention mediated by biased competition in extrastriate visual cortex. Philos Trans R Soc Lond B Biol Sci. 1998;353:1245–1255. doi: 10.1098/rstb.1998.0280. [DOI] [PMC free article] [PubMed] [Google Scholar]
- Desimone R, Duncan J. Neural mechanisms of selective visual attention. Annu Rev Neurosci. 1995;18:193–222. doi: 10.1146/annurev.ne.18.030195.001205. [DOI] [PubMed] [Google Scholar]
- Druga R, Rokyta R, Benes V., Jr Claustro-neocortical projections in the rhesus monkey (projections to area 6) J Hirnforsch. 1990;31:487–494. [PubMed] [Google Scholar]
- Fuster JM, Jervey JP. Neuronal firing in the inferotemporal cortex of the monkey in a visual memory task. J Neurosci. 1982;2:361–375. doi: 10.1523/JNEUROSCI.02-03-00361.1982. [DOI] [PMC free article] [PubMed] [Google Scholar]
- Gattass R, Soares JGM, Desimone R, Ungerleider LG. Connectional subdivision of the claustrum: two visuotopic subdivisions in the macaque. Front Syst Neurosci. 2014;8:63. doi: 10.3389/fnsys.2014.00063. [DOI] [PMC free article] [PubMed] [Google Scholar]
- Gendle MH, White TL, Strawderman M, Mactutus CF, Booze RM, Levitsky DA, Strupp BJ. Enduring effects of prenatal cocaine exposure on selective attention and reactivity to errors: evidence from an animal model. Behav Neurosci. 2004;118:290–297. doi: 10.1037/0735-7044.118.2.290. [DOI] [PubMed] [Google Scholar]
- Gisquet-Verrier P, Delatour B. The role of the rat prelimbic/infralimbic cortex in working memory: not involved in the short-term maintenance but in monitoring and processing functions. Neuroscience. 2006;141:585–596. doi: 10.1016/j.neuroscience.2006.04.009. [DOI] [PubMed] [Google Scholar]
- Herkenham M. Laminar organization of thalamic projections to the rat neocortex. Science. 1980;207:532–535. doi: 10.1126/science.7352263. [DOI] [PubMed] [Google Scholar]
- Kastner S, Ungerleider LG. Mechanisms of visual attention in the human cortex. Annu Rev Neurosci. 2000;23:315–341. doi: 10.1146/annurev.neuro.23.1.315. [DOI] [PubMed] [Google Scholar]
- Kim J, Matney CJ, Roth RH, Brown SP. Synaptic organization of the neuronal circuits of the claustrum. J Neurosci. 2016;36:773–784. doi: 10.1523/JNEUROSCI.3643-15.2016. [DOI] [PMC free article] [PubMed] [Google Scholar]
- Kupferschmidt DA, Cody PA, Lovinger DM, Davis MI. Brain BLAQ: Post-hoc thick-section histochemistry for localizing optogenetic constructs in neurons and their distal terminals. Front Neuroanat. 2015;9:6. doi: 10.3389/fnana.2015.00006. [DOI] [PMC free article] [PubMed] [Google Scholar]
- LeVay S, Sherk H. The visual claustrum of the cat. I Structure and connections. J Neurosci. 1981;1:956–980. doi: 10.1523/JNEUROSCI.01-09-00956.1981. [DOI] [PMC free article] [PubMed] [Google Scholar]
- Liske H, Qian X, Anikeeva P, Deisseroth K, Delp S. Optical control of neuronal excitation and inhibition using a single opsin protein, ChR2. Sci Rep. 2013;3:3110. doi: 10.1038/srep03110. [DOI] [PMC free article] [PubMed] [Google Scholar]
- Madisen L, Zwingman TA, Sunkin SM, Oh SW, Zariwala HA, Gu H, Ng LL, Palmiter RD, Hawrylycz MJ, Jones AR, et al. A robust and high-throughput Cre reporting and characterization system for the whole mouse brain. Nat Neurosci. 2010;13:133–140. doi: 10.1038/nn.2467. [DOI] [PMC free article] [PubMed] [Google Scholar]
- Mathur BN. The claustrum in review. Front Syst Neurosci. 2014;8:48. doi: 10.3389/fnsys.2014.00048. [DOI] [PMC free article] [PubMed] [Google Scholar]
- Mathur BN, Caprioli RM, Deutch AY. Proteomic analysis illuminates a novel structural definition of the claustrum and insula. Cereb Cortex. 2009;19:2372–2379. doi: 10.1093/cercor/bhn253. [DOI] [PMC free article] [PubMed] [Google Scholar]
- Mathur BN, Tanahira C, Tamamaki N, Lovinger DM. Voltage drives diverse endocannabinoid signals to mediate striatal microcircuit-specific plasticity. Nat Neurosci. 2013;16:1275–1283. doi: 10.1038/nn.3478. [DOI] [PMC free article] [PubMed] [Google Scholar]
- Mesulam MM. Large-scale neurocognitive networks and distributed processing for attention, language, and memory. Ann Neurol. 1990;28:597–613. doi: 10.1002/ana.410280502. [DOI] [PubMed] [Google Scholar]
- Miller EK, Buschman TJ. Cortical circuits for the control of attention. Curr Opin Neurobiol. 2013;23:216–222. doi: 10.1016/j.conb.2012.11.011. [DOI] [PMC free article] [PubMed] [Google Scholar]
- Miller EK, Gochin PM, Gross CG. Suppression of visual responses of neurons in inferior temporal cortex of the awake macaque by addition of a second stimulus. Brain Res. 1993;616:25–29. doi: 10.1016/0006-8993(93)90187-r. [DOI] [PubMed] [Google Scholar]
- Moore T, Armstrong KM. Selective gating of visual signals by microstimulation of frontal cortex. Nature. 2003;421:370–373. doi: 10.1038/nature01341. [DOI] [PubMed] [Google Scholar]
- Morishima Y, Akaishi R, Yamada Y, Okuda J, Toma K, Sakai K. Task-specific signal transmission from prefrontal cortex in visual selective attention. Nat Neurosci. 2009;12:85–91. doi: 10.1038/nn.2237. [DOI] [PubMed] [Google Scholar]
- Morys J, Bobinski M, Wegiel J, Wisniewski HM, Narkiewicz O. Alzheimer’s disease severely affects areas of the claustrum connected with the entorhinal cortex. J Hirnforsch. 1996;37:173–180. [PubMed] [Google Scholar]
- Muir JL, Everitt BJ, Robbins TW. The cerebral cortex of the rat and visual attentional function: dissociable effects of mediofrontal, cingulate, anterior dorsolateral, and parietal cortex lesions on a five-choice serial reaction time task. Cereb Cortex. 1996;6:470–481. doi: 10.1093/cercor/6.3.470. [DOI] [PubMed] [Google Scholar]
- Olson CR, Graybiel AM. Sensory maps in the claustrum of the cat. Nature. 1980;288:479–481. doi: 10.1038/288479a0. [DOI] [PubMed] [Google Scholar]
- Otis JM, Namboodiri VM, Matan AM, Voets ES, Mohorn EP, Kosyk O, McHenry JA, Robinson JE, Resendez SL, Rossi MA, Stuber GD. Prefrontal cortex output circuits guide reward seeking through divergent cue encoding. Nature. 2017;543:103–107. doi: 10.1038/nature21376. [DOI] [PMC free article] [PubMed] [Google Scholar]
- Parnaudeau S, O’Neill PK, Bolkan SS, Ward RD, Abbas AI, Roth BL, Balsam PD, Gordon JA, Kellendonk C. Inhibition of mediodorsal thalamus disrupts thalamofrontal connectivity and cognition. Neuron. 2013;77:1151–1162. doi: 10.1016/j.neuron.2013.01.038. [DOI] [PMC free article] [PubMed] [Google Scholar]
- Passetti F, Chudasama Y, Robbins TW. The frontal cortex of the rat and visual attentional performance: dissociable functions of distinct medial prefrontal subregions. Cereb Cortex. 2002;12:1254–1268. doi: 10.1093/cercor/12.12.1254. [DOI] [PubMed] [Google Scholar]
- Pearson RC, Brodal P, Gatter KC, Powell TP. The organization of the connections between the cortex and the claustrum in the monkey. Brain Res. 1982;234:435–441. doi: 10.1016/0006-8993(82)90883-6. [DOI] [PubMed] [Google Scholar]
- Pinault D. The thalamic reticular nucleus: structure, function and concept. Brain Res Brain Res Rev. 2004;46:1–31. doi: 10.1016/j.brainresrev.2004.04.008. [DOI] [PubMed] [Google Scholar]
- Reser DH, Richardson KE, Montibeller MO, Zhao S, Chan JM, Soares JG, Chaplin TA, Gattass R, Rosa MG. Claustrum projections to prefrontal cortex in the capuchin monkey (Cebus apella) Front Syst Neurosci. 2014;8:123. doi: 10.3389/fnsys.2014.00123. [DOI] [PMC free article] [PubMed] [Google Scholar]
- Riche D, Lanoir J. Some claustro-cortical connections in the cat and baboon as studied by retrograde horseradish peroxidase transport. J Comp Neurol. 1978;177:435–444. doi: 10.1002/cne.901770306. [DOI] [PubMed] [Google Scholar]
- Robbins TW. The 5-choice serial reaction time task: behavioural pharmacology and functional neurochemistry. Psychopharmacology (Berl) 2002;163:362–380. doi: 10.1007/s00213-002-1154-7. [DOI] [PubMed] [Google Scholar]
- Robinson ES, Eagle DM, Mar AC, Bari A, Banerjee G, Jiang X, Dalley JW, Robbins TW. Similar effects of the selective noradrenaline reuptake inhibitor atomoxetine on three distinct forms of impulsivity in the rat. Neuropsychopharmacology. 2008;33:1028–1037. doi: 10.1038/sj.npp.1301487. [DOI] [PubMed] [Google Scholar]
- Saalmann YB, Kastner S. Cognitive and perceptual functions of the visual thalamus. Neuron. 2011;71:209–223. doi: 10.1016/j.neuron.2011.06.027. [DOI] [PMC free article] [PubMed] [Google Scholar]
- Sherman SM, Guillery RW. Distinct functions for direct and transthalamic corticocortical connections. J Neurophysiol. 2011;106:1068–1077. doi: 10.1152/jn.00429.2011. [DOI] [PubMed] [Google Scholar]
- Smith JB, Alloway KD. Functional specificity of claustrum connections in the rat: interhemispheric communication between specific parts of motor cortex. J Neurosci. 2010;30:16832–16844. doi: 10.1523/JNEUROSCI.4438-10.2010. [DOI] [PMC free article] [PubMed] [Google Scholar]
- Smith JB, Radhakrishnan H, Alloway KD. Rat claustrum coordinates but does not integrate somatosensory and motor cortical information. J Neurosci. 2012;32:8583–8588. doi: 10.1523/JNEUROSCI.1524-12.2012. [DOI] [PMC free article] [PubMed] [Google Scholar]
- Sun J, Lee SJ, Wu L, Sarntinoranont M, Xie H. Refractive index measurement of acute rat brain tissue slices using optical coherence tomography. Opt Express. 2012;20:1084–1095. doi: 10.1364/OE.20.001084. [DOI] [PMC free article] [PubMed] [Google Scholar]
- Tanahira C, Higo S, Watanabe K, Tomioka R, Ebihara S, Kaneko T, Tamamaki N. Parvalbumin neurons in the forebrain as revealed by parvalbumin-Cre transgenic mice. Neurosci Res. 2009;63:213–223. doi: 10.1016/j.neures.2008.12.007. [DOI] [PubMed] [Google Scholar]
- Tanné-Gariépy J, Boussaoud D, Rouiller EM. Projections of the claustrum to the primary motor, premotor, and prefrontal cortices in the macaque monkey. J Comp Neurol. 2002;454:140–157. doi: 10.1002/cne.10425. [DOI] [PubMed] [Google Scholar]
- Torgerson CM, Irimia A, Goh SY, Van Horn JD. The DTI connectivity of the human claustrum. Hum Brain Mapp. 2015;36:827–838. doi: 10.1002/hbm.22667. [DOI] [PMC free article] [PubMed] [Google Scholar]
- Totah NK, Kim YB, Homayoun H, Moghaddam B. Anterior cingulate neurons represent errors and preparatory attention within the same behavioral sequence. J Neurosci. 2009;29:6418–6426. doi: 10.1523/JNEUROSCI.1142-09.2009. [DOI] [PMC free article] [PubMed] [Google Scholar]
- Ungerleider LG, Desimone R, Galkin TW, Mishkin M. Subcortical projections of area MT in the macaque. J Comp Neurol. 1984;223:368–386. doi: 10.1002/cne.902230304. [DOI] [PubMed] [Google Scholar]
- Wang Q, Ng L, Harris JA, Feng D, Li Y, Royall JJ, Oh SW, Bernard A, Sunkin SM, Koch C, Zeng H. Organization of the connections between claustrum and cortex in the mouse. J Comp Neurol. 2017;525:1317–1346. doi: 10.1002/cne.24047. [DOI] [PMC free article] [PubMed] [Google Scholar]
- Watakabe A, Ohsawa S, Ichinohe N, Rockland KS, Yamamori T. Characterization of claustral neurons by comparative gene expression profiling and dye-injection analyses. Front Syst Neurosci. 2014;8:98. doi: 10.3389/fnsys.2014.00098. [DOI] [PMC free article] [PubMed] [Google Scholar]
- White MG, Cody PA, Bubser M, Wang HD, Deutch AY, Mathur BN. Cortical hierarchy governs rat claustrocortical circuit organization. J Comp Neurol. 2017;525:1347–1362. doi: 10.1002/cne.23970. [DOI] [PMC free article] [PubMed] [Google Scholar]
- Yoon T, Okada J, Jung MW, Kim JJ. Prefrontal cortex and hippocampus subserve different components of working memory in rats. Learn Mem. 2008;15:97–105. doi: 10.1101/lm.850808. [DOI] [PMC free article] [PubMed] [Google Scholar]
- Zhang S, Xu M, Kamigaki T, Hoang Do JP, Chang WC, Jenvay S, Miyamichi K, Luo L, Dan Y. Selective attention. Long-range and local circuits for top-down modulation of visual cortex processing. Science. 2014;345:660–665. doi: 10.1126/science.1254126. [DOI] [PMC free article] [PubMed] [Google Scholar]
- Zhang S, Xu M, Chang WC, Ma C, Hoang Do JP, Jeong D, Lei T, Fan JL, Dan Y. Organization of long-range inputs and outputs of frontal cortex for top-down control. Nat Neurosci. 2016;19:1733–1742. doi: 10.1038/nn.4417. [DOI] [PMC free article] [PubMed] [Google Scholar]
Associated Data
This section collects any data citations, data availability statements, or supplementary materials included in this article.