Abstract
Purpose
To develop NTCP models for hepatocellular cancer (HCC) patients who receive liver radiotherapy and to evaluate the potential role of pre- and during treatment functional imaging and blood-based circulating biological markers to improve the performance of these models.
Methods
192 HCC patients treated with radiation between 2005–2014 were evaluated: 146 received SBRT and 46 received conventional radiation to median physical tumor doses of 49.8 Gy and 50.4 Gy, respectively. Physical doses were converted into EQD2 for analysis. Two approaches were investigated for modeling NTCP: (a) a generalized Lyman-Kutcher-Burman (LKB) model; and (b) a generalization of the parallel architecture (PA) model. Three clinical endpoints were considered: change in ALBI, change in Child-Pugh (C-P) score and grade 3 or higher liver enzymatic changes. Local DCE-MRI portal venous perfusion information was used as an imaging biomarker for local liver function. Four candidate inflammatory cytokines were considered as biological markers. Imaging and cytokines were incorporated into NTCP modeling and their role was evaluated using goodness-of-fit metrics.
Results
Using dosimetric information only, the LKB model for ALBI/C-P change had a steeper response curve compared to grade3+ enzymatic changes. Incorporating portal venous perfusion imaging information into the PA model to represent functional reserve resulted in relatively steeper dose response curves compared to using dose only models. Larger loss of perfusion function was needed for enzymatic changes compared to ALBI/C-P changes. Increased TGF-β1 and Eotaxin expression increased the trend of expected risk in both NTCP modeling approaches but did not reach statistical significance.
Conclusions
The incorporation of imaging and biological markers into NTCP modeling of liver toxicity improves estimates of expected NTCP risk compared to using dose only models. In addition, such generalized NTCP models should contribute to better understanding of normal tissue response in HCC SBRT patients and facilitate personalized treatment.
Introduction
Stereotactic Body radiotherapy (SBRT) for liver tumors has recently been widely adopted due to excellent local control [1–5] and the potential benefits of shorter radiation courses [6]. The use of advanced delivery systems of SBRT has resulted in a sharp dose gradient and limited dose to surrounding normal tissues. However, with varying prescription regimens and the drive towards treating larger tumors with SBRT, there is an increased risk of toxicity in the uninvolved liver. This requires better understanding of normal tissue complication probabilities (NTCP) for prescribing new regimens of radiation or designing future clinical trials.
The Quantitative Analysis of Normal Tissue Effects in the Clinic (QUANTEC) effort has provided recommendations for liver toxicity primarily based on conventional regimens and the small SBRT series available at the time [7]. It recommended that a critical volume of 700 cc, estimated from partial hepatectomy series, of uninvolved liver receive <15 Gy in 3 fractions, following institutional experiences in liver metastases [8]. On the other hand, in the case of primary liver cancers such as hepatocellular cancer (HCC), efforts have been directed towards minimizing the risk of liver function deterioration such as Child-Pugh (C-P) class [9–11]. A critical volume of 800 cc of uninvolved liver was recommended to receive <18 Gy/3 fractions in patients presenting with C-P class A function [12]. In contrast, in patients with C-P class B, a 5-fraction regimen is recommended with the dose to one-third of the uninvolved liver <18Gy/5 fractions and a critical volume of 500 cc of uninvolved liver to receive <12 Gy/5 fractions [13]. However, many of these studies had small number of patients and did not differentiate between metastatic cancer, where the liver is normal, and HCC patients, where liver function is compromised [10].
Liver toxicity used in NTCP models has been assessed using several different endpoints. Traditionally, radiation-induced liver disease (RILD) with its classical and non-classical forms has been the main subject of NTCP in the liver [14–16]. The CTCAE version 4.0 defines liver toxicity as grade ≥3 clinically if the patient develops mild to severe encephalopathy that would interfere with activities of daily living (ADL) or enzymatically by elevated levels of alkaline phosphatase (ALP), alanine aminotransferase (ALT), aspartate aminotransferase (AST), or gamma-glutamyl transpeptidase (GGT) 5–20 times above the upper limit of normal [17]. In addition to the CTCAE scale, liver function measurements such as the Child-Pugh (C-P) scoring system (based on ascites, encephalopathy, albumin, bilirubin and the international normalized ratio (INR) or prothrombin time) [7] and Albumin-Bilirubin (ALBI) grade [18] have been proposed to grade the prognosis of liver toxicity from radiation. Another non-enzymatic measure of liver function is using indocyanine green retention at 15 min (ICG-R15), which is an intravenously administrated fluorescent dye for measuring liver perfusion in HCC patients [19]. ICG-R15 has been correlated with RILD [20] but not with C-P change [21]. Recently, it was shown that baseline C-P scores and higher liver doses are associated with liver function decline in HCC patients 3 months after SBRT [22].
Circulating inflammatory proteins have been shown to be associated with radiation-induced normal tissue toxicity [23]. These cytokines have been extensively investigated in lung disease but not so in case of liver injury. Several biomarkers of veno-occlusive disease (VOD) have been suggested for RILD including serum levels of hyaluronic acid, plasminogen activator inhibitor, thrombomodulin, transforming growth factor (TGF)-β, and others [24].
Imaging could provide a very useful resource of information not only for assessment but also for prediction of radiation-induced toxicity. An approach that has been successfully applied to studying RILD and liver function is using portal venous perfusion imaging by dynamic contrast enhanced (DCE) CT [25] or MRI [26,27]. These studies have shown that mean liver portal venous perfusion is associated with ICG-R15 retention. In addition, several single-photon emission computed tomography (SPECT) tracers have been proposed to image liver fibrosis. These include using SPECT with asialoglycoprotein receptor (ASGPR) [28], iminodiacetic acid (IDA) [29] or albumin [30] Technetium-99m tagged tracers. However, the incorporation of such valuable imaging information into NTCP modeling of the liver remains limited with the focus being on dose-volume modeling [31].
Stratifications of patients by clinical status such as being hepatitis B carriers [15] or having C-P class B [32] seem to reveal different patients’ tolerances to conventional liver radiotherapy. Recently, it has been shown that the addition of dose modifying factors to the classical Lyman model such as incorporation of clinical [33,34] and biological information [35,36] would improve risk stratification by NTCP modeling.
In the current study, we develop and evaluate new NTCP models with liver SBRT/RT that utilize functional imaging information and biological markers using extended functional reserve and Lyman models for potential application in radiotherapy planning and adaptation.
Methods and Materials
Patients Characteristics
The patient population was retrospectively collected institutionally on IRB approved protocols. The cohort consisted of 146 HCC patients who received SBRT between 2005–2014. Median prescribed physical tumor dose was 49.8 (18.6–60.0) Gy typically delivered in 3 (47%) or 5 (51%) fractions. All 3 fraction and 43% of the 5 fraction treatments were delivered in an adaptive split course (3+2) with 1 month break based on a ICG-R15 test [20]. In our cohort, 70% (n=102) of the SBRT patients underwent the ICG-R15 test pre- and during therapy. Median age was 64 (range 26–86), with 20% female patients and 85% cirrhotics. In addition, 46 HCC patients who received conventional IMRT treatment and had restorable records during the same period were added to the SBRT cohort to expand the range of liver dose response and reduce uncertainties associated with the estimation of model parameters. This population had a median prescribed tumor dose of 50.4 (30.0–90.0) Gy given in median fraction sizes of 2.0 (1.8–3.5) Gy. Median age was 64 (range 43–84), with 26% female patients and 67% cirrhotics. The median follow-up was 11 (3–62) months in the whole population. A summary of characteristics is given in Table 1. Radiation dose distributions for total uninvolved liver exclusive of gross tumor volume (Liver-GTV) were computed within the Varian Eclipse treatment planning system using the AAA dose algorithm. All total dose values were converted to their 2 Gy equivalents (EQD2) by the linear-quadratic linear (LQL) model with an α/β = 2.5 Gy and mean doses of Liver-GTV were calculated [37].
Table 1.
Patient characteristics.
| Characteristic | SBRT (n=146) | Conventional (n=46) |
|---|---|---|
|
| ||
| Age (y) | ||
| Median | 64 | 64 |
| Range | 25–86 | 43–84 |
|
| ||
| Gender | ||
| Female | 44 (20%) | 12 (26%) |
| Male | 172 (80%) | 34 (74%) |
|
| ||
| Cirrhotic Status | 124 (85%) | 31 (67%) |
|
| ||
| Liver-GTV volume (cc) | ||
| Median | 1534.7 | 1542.5 |
| Range | 674.7–3516.0 | 699.3–3321.5 |
|
| ||
| Mean liver EQD2 dose (Gy) | ||
| Median | 9.4 | 24.4 |
| Range | 1.6–36.1 | 9.6–30.3 |
Imaging acquisition and processing
DCE-MRI scans from a subpopulation of 23 HCC patients, part of the adaptive SBRT study, were acquired on 3T scanners and pre-processed as described previously [26]. The DCE scans had a total of 60 dynamic volumes in a coronal or oblique-coronal orientation with 2.4 to 3.0 seconds per volume. The DCE-MRI scans were acquired within 2 weeks before RT (pre-RT), after delivery of approximately 60% of the planned dose, and 1 month after completion of RT (post-RT). To mitigate the effects of respiratory breathing on the portal-venous input function, images were registered with respect to the liver using an overdetermined system of transformation equations between the image volumes in the DCE series to improve robustness, and the portal-venous input function was rescaled to so that its tail matched the amplitude of the tail of the arterial input function [38]. Liver arterial and portal-venous perfusion maps were quantified by fitting the DCE data to a dual-input single-compartment kinetic model [39].
Local DCE-MRI portal venous perfusion maps were used as an imaging biomarker for local liver function. The subvolumes were extracted using an automated segmentation approach based on the optimal Otsu’s multi-threshold histogram decomposition into 4 levels: high, medium, low, and background perfusion clusters [40]. The resulting subvolumes were post-processed using morphological operators based on opening to remove small and isolated clusters in the perfusion map using a spherical structure element.
Biological markers
Inflammatory cytokines were collected from peripheral blood samples prior to radiation and one month after completing the first 3 fractions on about half of the SBRT patients (n=72). As mentioned above, about 43% (n=31) of these patients received an additional 2 fractions after the second blood draw as part of an adaptive split course SBRT protocol with a one month break. The expression of these cytokines was measured using enzyme-linked immunosorbent assay (ELISA). The candidate list of cytokines considered included TGF-β1, which has been long implicated in promoting radiation-induced liver injury [41]; Eotaxin (CCL11), which is upregulated in liver injury [42]; HGF, which is involved in liver regeneration [43]; and CD40 ligand which has been shown in anti-fibrotic effects [44].
Toxicity Criteria
Three clinical endpoints were selected for the study. One endpoint was liver toxicity based on elevated enzymatic changes in which grade 3 (grade3+) or higher hepatic toxicity was defined as ≥ 5 times the upper limit of the normal level for ALT/AST according to the CTCAE 4.0. This endpoint is closely related to RILD [45]. Enzymatic changes had an event rate of 2% (n=3) in the SBRT group and 4% (n=2) in the conventional group.
The two other endpoints are related to preserving liver function, and for this purpose, we chose a one grade change in ALBI score and a two-point change in C-P score (measured every 3 months over a period of 12 months). ALBI has been suggested to be a less subjective and a more stable endpoint than C-P [18]. Changes in ALBI score had an event rate of 36% (n=53) in the SBRT group and 20% (n=9) in the conventional group, while C-P changes ≥ 2 had an event rate of 31% (n=45) in the SBRT group and 35% (n=16) in the conventional group. Patients with terminal baseline toxicity (n=16), i.e., C-P class C or ALBI score of 3, were excluded from NTCP modeling.
NTCP modeling and calculation
Two approaches are investigated for modeling of NTCP. One approach is based on the generalized Lyman-Kutcher-Burman (LKB) model [35,36] and the other one is based on a generalization of the parallel architecture model [16].
The generalized LKB model is given by the following Probit function:
| (1) |
It includes the same three-parameters as the standard LKB model (TD50: denoting the dose position corresponding to 50% complication probability rate; m/γ50 represents the slope of the dose-response curve, and the volume effect parameter is set to unity (mean dose effect) given the parallel architecture nature of the liver. The DMF represents the dose modifying factor of selected risk variable (R) and is given by:
| (2) |
where δ is risk-factor weights and R is the risk variable. Maximum likelihood methods were used to estimate Probit parameters.
The generalized parallel architecture model is based on estimating the cumulative functional reserve [16]:
| (3) |
In our case, the cumulative functional reserve H is modeled using a generalized Probit formalism similar to Eq. (1), where f represents the loss of function (or increase in damage fraction) with an f50 denoting the position corresponding to 50% complication probability rate. The loss of function is assumed to be represented by the local reduction in portal venous perfusion within a fractional volume (vi) due to dose (di) and is given by:
| (4) |
The probability of reduction in portal venous perfusion is estimated by a logistic function [16]:
| (5) |
where d50 is dose at which 50% of the perfusion is reduced and the slope parameter k determines the rate at which the probability of losing perfusion increases with dose.
The 95% error bars of binned data were calculated using Agresti’s approximation [46]. Model confidence intervals were calculated using profile likelihood. Deviance (profile likelihood ratio test) goodness-of-fit was used for comparing nested models. The p-values are estimated using chi-squared statistics [47].
Results
NTCP modeling using dosimetric parameters of liver SBRT
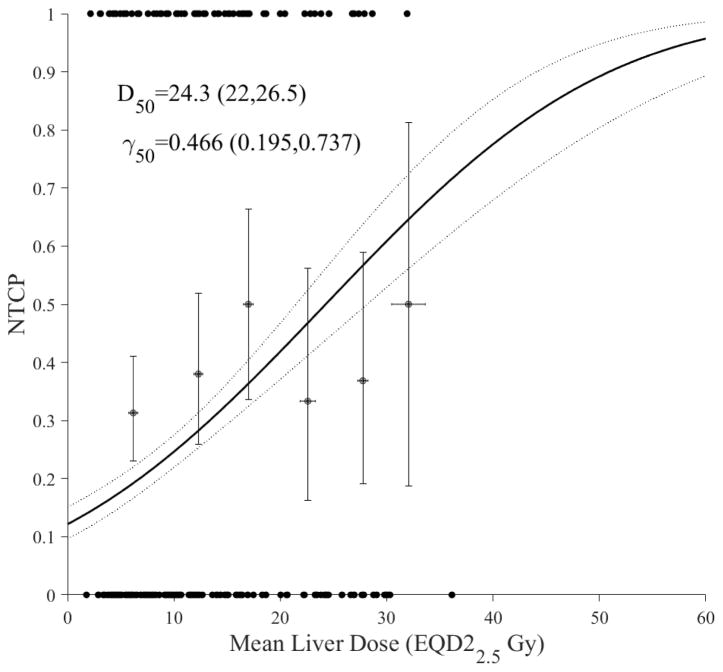
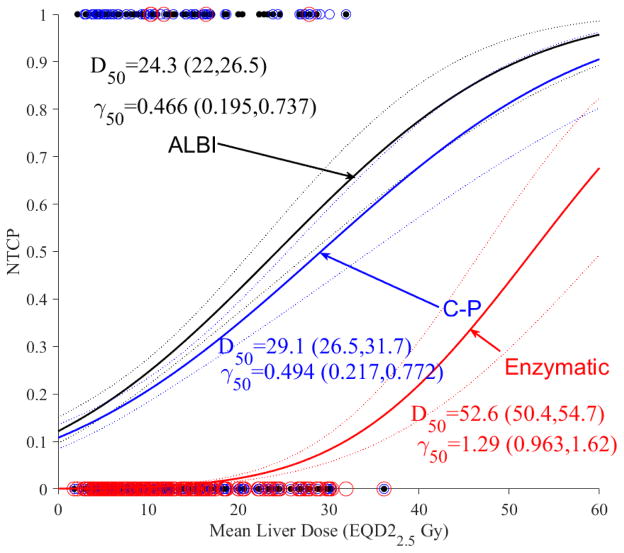
The modeling approach is based on using the classical LKB model [48]. In Figure 1a, we show the dose response curve with ALBI as the toxicity endpoint. In Figure 1b, NTCP of ALBI is compared with a two-point change in C-P score and grade3+ enzymatic change as toxicity endpoints. It is noted that ALBI and C-P had a similar dose response, while they had a shallower response curve with the slope (γ50=0.47 and 0.49) compared to liver enzymatic changes (γ50=1.29), but higher sensitivity with the D50 increasing from 24.3 Gy (CI 95%: 22.0–26.5 Gy) in case of ALBI into 52.6 Gy (CI 95%: 50.4–54.7 Gy) in case of liver enzymatic change. The Spearman rank correlation between ALBI and C-P was 0.366 (p<0.0001) while the rank correlation between ALBI and enzymatic changes was insignificant. This may indicate that ALBI/C-P are more radiosensitive endpoints and could potentially act as precursors to subsequent enzymatic changes occurring at higher doses.
Figure 1.
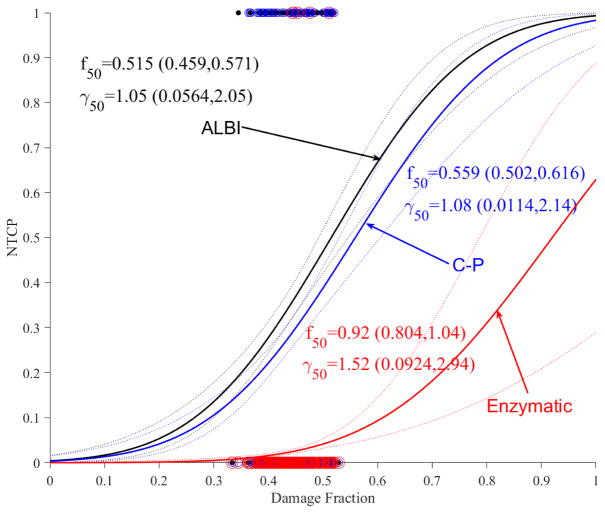
Dosimetric NTCP modeling using LKB. (a) ALBI change modeling with dots representing the original data (black). (b) ALBI model in conjunction with C-P (blue) and liver grade3+ enzymatic changes (red) with circles representing the original data. The solid lines represent the optimal fits and the dotted lines represent the 95% confidence band.
Incorporation of imaging into NTCP modeling of liver SBRT
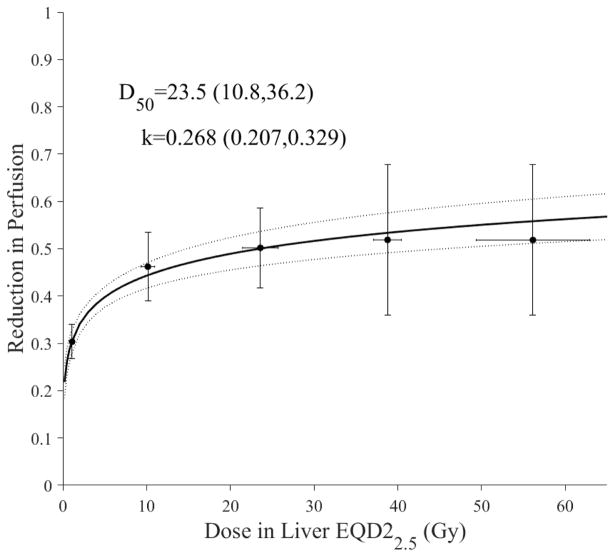
We assumed that fractional reduction in liver function could be expressed in terms of changes in portal vein perfusion from MRI-DCE, as demonstrated in earlier studies [26,27]. Using a logistic function (Eq. 5), the fraction of liver perfusion loss as a function of subregional liver dose is shown in Figure 2. Moreover, it is noticed that livers with HCC (D50= 23.5 Gy) seem to be more susceptible to local perfusion changes in response to irradiation than the general intrahepatic malignancies [26].
Figure 2.
Subregional modeling of liver loss of function using portal venus perfusion using the logistic model. The blue dots represent original data and the error bars represent 95% confidence levels of binned data. The solid line represents best fit with the dotted lines representing 95% confidence band. Note that the curve is calculated to near zero dose only (logistic model predicts zero effect at 0 dose). This may indicate possible residual perfusion changes at no dose by less than healthy liver.
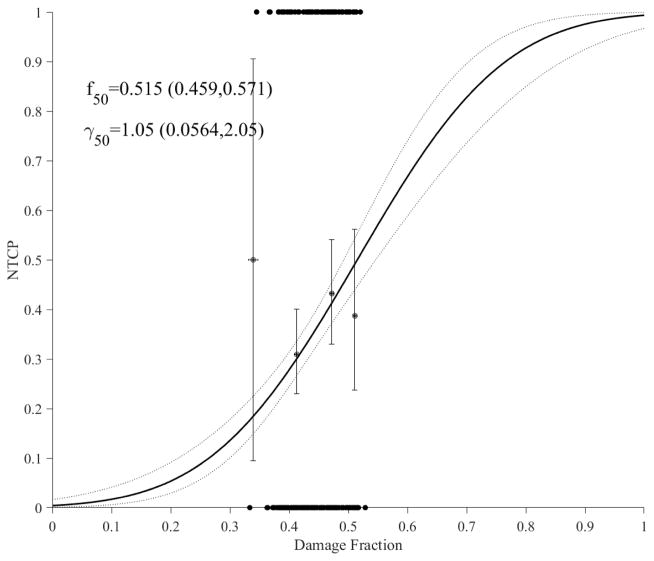
Using the cumulative functional reserve model (Eq. 3), the estimated NTCP model with ALBI is shown in Figure 3a and the NTCP models for C-P and grade3+ enzymatic changes are shown in Figure 3b. Again, it is noticed that larger loss of liver perfusion function (damage fraction) is needed for enzymatic changes (f50=0.920) compared to C-P (f50=0.559) and ALBI (f50=0.515). In comparison to LKB dosimetric modeling, it is noted that the addition of imaging resulted in relatively steeper response curves (higher γ50), which could indicate stronger relationships in the case of functional reserve models; this is particularly noticeable in the case of C-P. In terms of goodness-of-fit comparisons, cumulative functional reserve had lower deviances than the corresponding LKB models by 186.5, 149.3, 282.2 for ALBI, C-P, enzymatic changes, respectively, but the p-values were close to 1, i.e., the increase in the number of parameters (from 2 to 4) offset the reduction in deviances.
Figure 3.
Accumulative functional reserve NTCP PA model using portal venous perfusion. (a) ALBI changes with dots representing the original data (black). (b) ALBLI along with C-P (blue) and liver enzymatic changes (red) with circles representing the original data. The solid lines represent the optimal fits and the dotted lines represent the 95% confidence band.
Incorporation of biological markers into NTCP modeling of liver SBRT
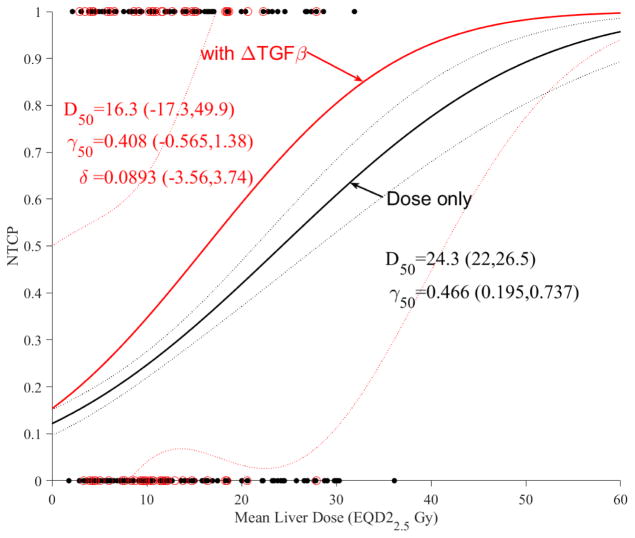
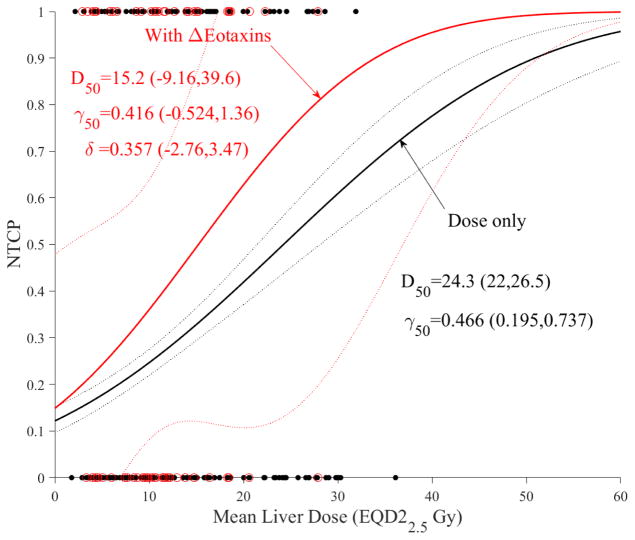
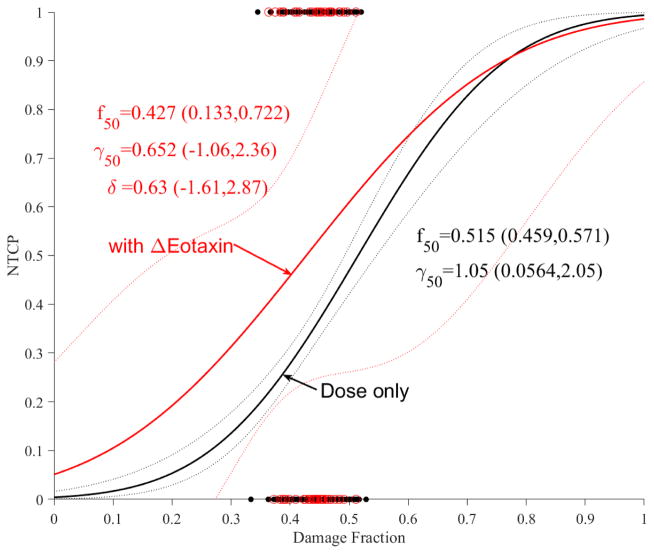
We investigated the action of cytokines as dose modifying factors of liver function using change in ALBI as the clinical endpoint in the subset of patients who had ELISA analysis (n=72). Only changes in TGF-β1 and Eotaxin influenced the likelihood function. The results in case of dosimetric LKB modeling are shown for TGF-β1 in Figure 4a and Eotaxin in Figure 4b. It is noticed that increased TGF-β1 or Eotaxin expressions would increase the trend risk of NTCP almost in a similar fashion compared to using dose-only by almost a factor of 1.5. However, this increase did not reach statistical significance (overlapping confidence intervals), most likely due to limited sample size and noise in the data.
Figure 4.
Dose modifying effect of cytokines on LKB model of ALBI. (a) with change in TGF-β1. (b) with change in Eotaxin. Red circles represeng the available data superimposed on the dosimetric only NTCP for ALBI change model. The solid lines represent the optimal fits and the dotted lines represent the 95% confidence band.
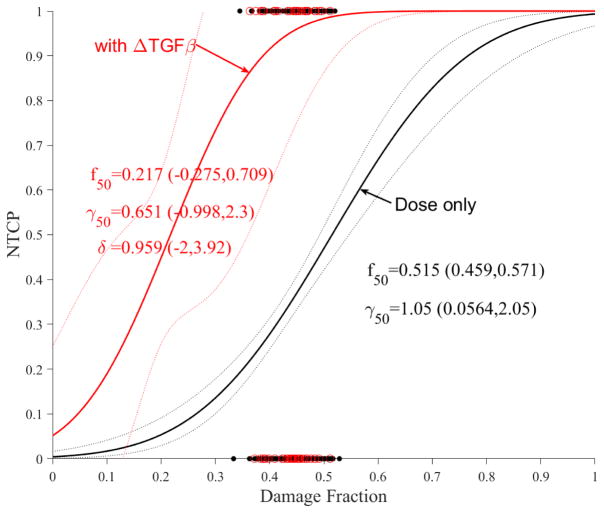
The impact of these cytokines on accumulative functional reserve is shown in Figure 5a for TGF-β1 and Figure 5b for Eotaxin. It is also noticed that increased cytokine expressions reduce the fractional function reserve threshold for NTCP risk in the case of TGF-β1 but is unclear in the case of Eotaxin where the curves crossed over, but this did not reach statistical significance most likely due to limited sample sizes.
Figure 5.
Dose modifying effect of cytokines on functional reserve PA model of ALBI. (a) change in TGF-β1. (b) change in Eotaxin. Red circles represent the available data superimposed on the dosimetric only NTCP for ALBI change model. The solid lines represent the optimal fits and the dotted lines represent the 95% confidence band.
Impact of ICG-R15 on NTCP modeling of liver SBRT
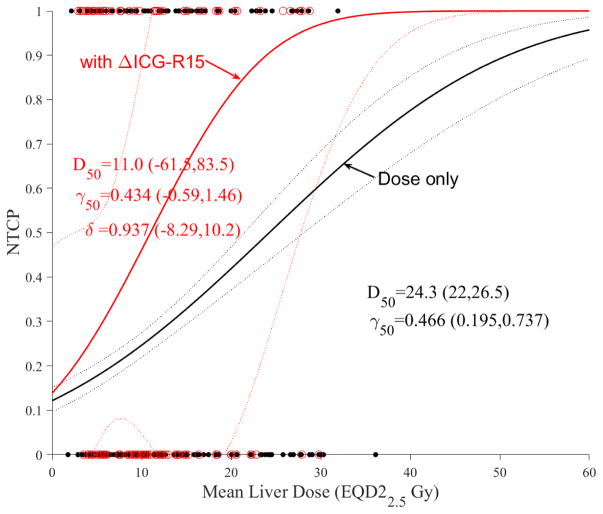
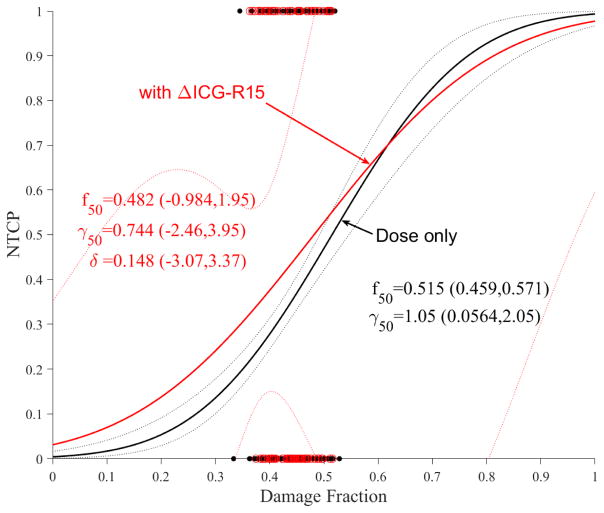
As mentioned in the introduction, ICG-R15 is a non-enzymatic functional test that is used to assess liver function during radiotherapy [20]. It is noted that ICG clearance is expected to correlate with ALBI or C-P change, however, this correlation was only marginal here (p=0.07). The addition of ICG-R15 change to LKB modeling seemed to produce a large effect (Figure 6a) but this effect seems to disappear in case of PA model (Figure 6b), likely due to the correlation with portal venous perfusion [25].
Figure 6.
Dose modifying effect of ICG on NTCP models. (a) LKB, (b) PA. Red circles represent the available data superimposed on the dosimetric only NTCP model. The solid lines represent the optimal fits and the dotted lines represent the 95% confidence band.
Discussion
This work investigated NTCP modeling of liver SBRT in primary HCC patients. Despite wider application of SBRT for the treatment of metastatic and primary liver cancers, NTCP modeling is still lagging in this area compared to other sites, such as the lung. NTCP modeling of conventional fractionation has led to significant advances in liver treatment and almost eradication of RILD events in clinical practice. This is equally important for SBRT or mixed regimens as multiple dose prescriptions and larger volumes are being contemplated in clinical trials. We assumed parallel architecture of the liver in our NTCP modeling, which is established in cases of RILD and enzymatic changes, but still emerging in cases of C-P and ALBI change. A summary of models presented in this study and their corresponding parameters is provided in supplemental Table A1.
Our study highlights the need for more consideration of parameters that can be known up front, such as dose, vs. those that need to be measured during treatment and would require replanning. Our dosimetric only model demonstrated that ALBI/C-P changes are more radiosensitive than enzymatic liver changes and could be a precursor for them. However, the small number of enzymatic liver changes precluded definite assessment of this effect. Sample implementation and comparisons with LKB RILD estimates for common liver constraints are provided in supplemental Table A2.1.
The use of functional imaging based on portal venous perfusion in NTCP modeling would allow relating imaging information to toxicity whether it is represented by functional endpoints such as ALBI/C-P or represented by more severe ones such as enzymatic changes. This information could be further used to optimize liver treatment plans [49] as well as to assess their quality when designing standard or adaptive treatment regimens. The portal venous perfusion from DCE-MRI imaging information was incorporated into the PA functional reserve model resulting in steeper response curves compared to the dosimetric only LKB model. This could be attributed to having different sensitivities of the functional units within the liver, or possible differences in how many functional units were damaged before producing the clinical change. In any case, this highlights the potential and added value of incorporating functional imaging information into NTCP model development, which are traditionally treated independently in treatment planning. Moreover, sample implementation and comparison with PA RILD estimates using anatomical volume for common liver constraints is provided in supplemental Table A2.2.
The addition of cytokines could improve risk stratification. Patients with increased levels of TGF-β1 or Eotaxin expressions during treatment are at higher levels of liver dysfunction than the general liver population. Interestingly, the impact of TGF-β1 was more pronounced than Eotaxin in the PA versus the LKB model reflecting the complex relationship between inflammatory cytokines and blood flow [50]. However, the impact of these cytokine risk trends did not reach statistical significance and would need to be further explored in larger datasets. These trends were explored here in case of ALBI only, as it is highly correlated with C-P (similar trends were seen, data not shown) while the event rate was too small (n=2) for modeling in case of enzymatic changes.
Despite the promising findings in our study, there are limitations that need to be acknowledged. Our use of conventional patients in the study is a limitation, however, this heterogeneity has allowed us to realize a more complete response curve when doses were converted into EQD2 using the LQL model. In addition, the functional imaging and the cytokine analyses were done on limited subsets of the SBRT data presenting promise but not necessarily proof yet. Therefore, larger and multi-institutional datasets are still needed to confirm the observations made in our study.
Conclusions
This work presented and analyzed several NTCP models for HCC liver patients who receive SBRT/RT treatment. In addition, we demonstrated that the incorporation of functional imaging/tests and biological markers into NTCP modeling of SBRT liver toxicity is not only feasible but could be beneficial to further improve estimates of expected NTCP risk in these patients and personalization of treatment planning compared to using dose only models.
Supplementary Material
Summary.
Delivery of liver radiotherapy is limited by its impact on liver function. This work develops and evaluates new NTCP models for liver irradiation utilizing functional imaging and biological markers using generalized functional reserve. These models are contrasted with traditional Lyman models.
Acknowledgments
This work was supported in part by the National Institutes of Health P01-CA059827 and R01-CA132834.
Footnotes
Conflict of Interest: All authors report grants from NIH during the conduct of the study. MM reports grants from Varian Medical Systems outside the submitted work. RTH reports non-financial support from Varian Medical Systems outside the submitted work.
Publisher's Disclaimer: This is a PDF file of an unedited manuscript that has been accepted for publication. As a service to our customers we are providing this early version of the manuscript. The manuscript will undergo copyediting, typesetting, and review of the resulting proof before it is published in its final citable form. Please note that during the production process errors may be discovered which could affect the content, and all legal disclaimers that apply to the journal pertain.
References
- 1.Chang JY, et al. Stereotactic ablative radiotherapy versus lobectomy for operable stage i non-small-cell lung cancer: A pooled analysis of two randomised trials. The Lancet Oncology. 16:630–637. doi: 10.1016/S1470-2045(15)70168-3. [DOI] [PMC free article] [PubMed] [Google Scholar]
- 2.Liu E, et al. Stereotactic body radiation therapy for primary and metastatic liver tumors. Translational Oncology. 2013;6:442–446. doi: 10.1593/tlo.12448. [DOI] [PMC free article] [PubMed] [Google Scholar]
- 3.Goodman KA, et al. Dose-escalation study of single-fraction stereotactic body radiotherapy for liver malignancies. Int J Radiat Oncol Biol Phys. 2010:78. doi: 10.1016/j.ijrobp.2009.08.020. [DOI] [PubMed] [Google Scholar]
- 4.Herman JM, et al. Phase 2 multi-institutional trial evaluating gemcitabine and stereotactic body radiotherapy for patients with locally advanced unresectable pancreatic adenocarcinoma. Cancer. 2015;121:1128–1137. doi: 10.1002/cncr.29161. [DOI] [PMC free article] [PubMed] [Google Scholar]
- 5.Timmerman RD, Herman J, Cho LC. Emergence of stereotactic body radiation therapy and its impact on current and future clinical practice. J Clin Oncol. 2014;32:2847–2854. doi: 10.1200/JCO.2014.55.4675. [DOI] [PMC free article] [PubMed] [Google Scholar]
- 6.Timmerman R, et al. Stereotactic body radiation therapy for inoperable early stage lung cancer. JAMA : the journal of the American Medical Association. 2010;303:1070–1076. doi: 10.1001/jama.2010.261. [DOI] [PMC free article] [PubMed] [Google Scholar]
- 7.Pan CC, et al. Radiation-associated liver injury. Int J Radiat Oncol Biol Phys. 2010;76:S94–100. doi: 10.1016/j.ijrobp.2009.06.092. [DOI] [PMC free article] [PubMed] [Google Scholar]
- 8.Schefter TE, et al. A phase i trial of stereotactic body radiation therapy (sbrt) for liver metastases. Int J Radiat Oncol Biol Phys. 2005;62:1371–1378. doi: 10.1016/j.ijrobp.2005.01.002. [DOI] [PubMed] [Google Scholar]
- 9.Lee MT, et al. Phase i study of individualized stereotactic body radiotherapy of liver metastases. J Clin Oncol. 2009:27. doi: 10.1200/JCO.2008.20.0600. [DOI] [PubMed] [Google Scholar]
- 10.Bujold A, et al. Sequential phase i and ii trials of stereotactic body radiotherapy for locally advanced hepatocellular carcinoma. J Clin Oncol. 2013;31:1631–1639. doi: 10.1200/JCO.2012.44.1659. [DOI] [PubMed] [Google Scholar]
- 11.Cardenes HR, et al. Phase i feasibility trial of stereotactic body radiation therapy for primary hepatocellular carcinoma. Clin Transl Oncol. 2010:12. doi: 10.1007/s12094-010-0492-x. [DOI] [PubMed] [Google Scholar]
- 12.Son SH, et al. Stereotactic body radiotherapy for patients with unresectable primary hepatocellular carcinoma: Dose-volumetric parameters predicting the hepatic complication. Int J Radiat Oncol Biol Phys. 2010;78:1073–1080. doi: 10.1016/j.ijrobp.2009.09.009. [DOI] [PubMed] [Google Scholar]
- 13.Andolino DL, et al. Stereotactic body radiotherapy for primary hepatocellular carcinoma. Int J Radiat Oncol Biol Phys. 2011;81:e447–453. doi: 10.1016/j.ijrobp.2011.04.011. [DOI] [PubMed] [Google Scholar]
- 14.Dawson LA, et al. Analysis of radiation-induced liver disease using the lyman ntcp model. Int J Radiat Oncol Biol Phys. 2002:53. doi: 10.1016/s0360-3016(02)02846-8. [DOI] [PubMed]
- 15.Cheng JC, et al. Biologic susceptibility of hepatocellular carcinoma patients treated with radiotherapy to radiation-induced liver disease. Int J Radiat Oncol Biol Phys. 2004;60:1502–1509. doi: 10.1016/j.ijrobp.2004.05.048. [DOI] [PubMed] [Google Scholar]
- 16.Jackson A, et al. Analysis of clinical complication data for radiation hepatitis using a parallel architecture model. Int J Radiat Oncol Biol Phys. 1995;31:883–891. doi: 10.1016/0360-3016(94)00471-4. [DOI] [PubMed] [Google Scholar]
- 17.NCI. CTCAE ver 4.0. National Cancer Institute; 2010. [Google Scholar]
- 18.Johnson PJ, et al. Assessment of liver function in patients with hepatocellular carcinoma: A new evidence-based approach—the albi grade. Journal of Clinical Oncology. 2015;33:550–558. doi: 10.1200/JCO.2014.57.9151. [DOI] [PMC free article] [PubMed] [Google Scholar]
- 19.Imamura H, et al. Assessment of hepatic reserve for indication of hepatic resection: Decision tree incorporating indocyanine green test. Journal of Hepato-Biliary-Pancreatic Surgery. 2005;12:16–22. doi: 10.1007/s00534-004-0965-9. [DOI] [PubMed] [Google Scholar]
- 20.Stenmark MH, et al. Estimating functional liver reserve following hepatic irradiation: Adaptive normal tissue response models. Radiotherapy and Oncology. 2014;111:418–423. doi: 10.1016/j.radonc.2014.04.007. [DOI] [PMC free article] [PubMed] [Google Scholar]
- 21.Lee IJ, et al. Radiotherapeutic parameters predictive of liver complications induced by liver tumor radiotherapy. Int J Radiat Oncol Biol Phys. 2009;73:154–158. doi: 10.1016/j.ijrobp.2008.04.035. [DOI] [PubMed] [Google Scholar]
- 22.Velec M, et al. Predictors of liver toxicity following stereotactic body radiation therapy for hepatocellular carcinoma. Int J Radiat Oncol Biol Phys. 2017;97:939–946. doi: 10.1016/j.ijrobp.2017.01.221. [DOI] [PubMed] [Google Scholar]
- 23.Schaue D, Kachikwu EL, McBride WH. Cytokines in radiobiological responses: A review. Radiation research. 2012;178:505–523. doi: 10.1667/RR3031.1. [DOI] [PMC free article] [PubMed] [Google Scholar]
- 24.Guha C, Kavanagh BD. Hepatic radiation toxicity: Avoidance and amelioration. Seminars in radiation oncology. 2011;21:256–263. doi: 10.1016/j.semradonc.2011.05.003. [DOI] [PMC free article] [PubMed] [Google Scholar]
- 25.Cao Y, et al. Liver function after irradiation based on computed tomographic portal vein perfusion imaging. Int J Radiat Oncol Biol Phys. 2008;70:154–160. doi: 10.1016/j.ijrobp.2007.05.078. [DOI] [PMC free article] [PubMed] [Google Scholar]
- 26.Wang H, et al. Local and global function model of the liver. International Journal of Radiation Oncology*Biology*Physics. 2016;94:181–188. doi: 10.1016/j.ijrobp.2015.09.044. [DOI] [PMC free article] [PubMed] [Google Scholar]
- 27.Cao Y, et al. Prediction of liver function by using magnetic resonance-based portal venous perfusion imaging. International Journal of Radiation Oncology*Biology*Physics. 2013;85:258–263. doi: 10.1016/j.ijrobp.2012.02.037. [DOI] [PMC free article] [PubMed] [Google Scholar]
- 28.Iguchi T, et al. Comparison of tc-99m-gsa scintigraphy with hepatic fibrosis and regeneration in patients with hepatectomy. Annals of Nuclear Medicine. 2003;17:227–233. doi: 10.1007/BF02990026. [DOI] [PubMed] [Google Scholar]
- 29.Wang H, et al. Predictive models for regional hepatic function based upon 99mtc-ida spect and local radiation dose for physiological adaptive rt. Int J Radiat Oncol Biol Phys. 2013;86:1000–1006. doi: 10.1016/j.ijrobp.2013.04.007. [DOI] [PMC free article] [PubMed] [Google Scholar]
- 30.Yoshida M, et al. A quantitative index measured on 99mtc gsa spect/ct 3d fused images to evaluate severe fibrosis in patients with chronic liver disease. Japanese Journal of Radiology. 2012;30:435–441. doi: 10.1007/s11604-012-0072-9. [DOI] [PubMed] [Google Scholar]
- 31.El Naqa I, et al. Radiation sensitivity of the liver: Models and clinical data. In: Meyers J, Schefter TE, editors. Radiation therapy for liver tumors: Fundamentals and clinical practice. Springer International Publishing; 2017. [Google Scholar]
- 32.Xu Z-Y, et al. Prediction of radiation-induced liver disease by lyman normal-tissue complication probability model in three-dimensional conformal radiation therapy for primary liver carcinoma. Int J Radiat Oncol Biol Phys. 2006;65:189–195. doi: 10.1016/j.ijrobp.2005.11.034. [DOI] [PubMed] [Google Scholar]
- 33.Defraene G, et al. The benefits of including clinical factors in rectal normal tissue complication probability modeling after radiotherapy for prostate cancer. International Journal of Radiation Oncology*Biology*Physics. 2012;82:1233–1242. doi: 10.1016/j.ijrobp.2011.03.056. [DOI] [PubMed] [Google Scholar]
- 34.Rancati T, et al. Inclusion of clinical risk factors into ntcp modelling of late rectal toxicity after high dose radiotherapy for prostate cancer. Radiotherapy and Oncology. 2011;100:124–130. doi: 10.1016/j.radonc.2011.06.032. [DOI] [PubMed] [Google Scholar]
- 35.Coates J, et al. Contrasting analytical and data-driven frameworks for radiogenomic modeling of normal tissue toxicities in prostate cancer. Radiotherapy and Oncology. 2015;115:107–113. doi: 10.1016/j.radonc.2015.03.005. [DOI] [PubMed] [Google Scholar]
- 36.Tucker SL, et al. Incorporating single-nucleotide polymorphisms into the lyman model to improve prediction of radiation pneumonitis. Int J Radiat Oncol Biol Phys. 2013;85:251–257. doi: 10.1016/j.ijrobp.2012.02.021. [DOI] [PMC free article] [PubMed] [Google Scholar]
- 37.Astrahan M. Some implications of linear-quadratic-linear radiation dose-response with regard to hypofractionation. Med Phys. 2008;35:4161–4172. doi: 10.1118/1.2969065. [DOI] [PubMed] [Google Scholar]
- 38.Johansson A, et al. An overdetermined system of transform equations in support of robust dce-mri registration with outlier rejection. TOMOGRAPHY. 2016;2:88–196. doi: 10.18383/j.tom.2016.00145. [DOI] [PMC free article] [PubMed] [Google Scholar]
- 39.Wang H, Cao Y. Gpu-accelerated voxelwise hepatic perfusion quantification. Phys Med Biol. 2012;57:5601–5616. doi: 10.1088/0031-9155/57/17/5601. [DOI] [PMC free article] [PubMed] [Google Scholar]
- 40.Otsu N. A threshold selection method from gray-level histograms. IEEE Transactions on Systems, Man, and Cybernetics. 1979;9:62–66. [Google Scholar]
- 41.Anscher MS, Crocker IR, Jirtle RL. Transforming growth factor-β1 expression in irradiated liver. Radiation Research. 1990;122:77–85. [PubMed] [Google Scholar]
- 42.Tacke F, et al. Up-regulated eotaxin plasma levels in chronic liver disease patients indicate hepatic inflammation, advanced fibrosis and adverse clinical course. Journal of Gastroenterology and Hepatology. 2007;22:1256–1264. doi: 10.1111/j.1440-1746.2006.04621.x. [DOI] [PubMed] [Google Scholar]
- 43.Pennisi PA, et al. Role of growth hormone (gh) in liver regeneration. Endocrinology. 2004;145:4748–4755. doi: 10.1210/en.2004-0655. [DOI] [PubMed] [Google Scholar]
- 44.Adawi A, et al. Blockade of cd40–cd40 ligand interactions protects against radiation-induced pulmonary inflammation and fibrosis. Clinical Immunology and Immunopathology. 1998;89:222–230. doi: 10.1006/clin.1998.4606. [DOI] [PubMed] [Google Scholar]
- 45.Cheng JC-H, et al. Radiation-induced liver disease after radiotherapy for hepatocellular carcinoma: Clinical manifestation and dosimetric description. Radiotherapy and Oncology. 2002;63:41–45. doi: 10.1016/s0167-8140(02)00061-0. [DOI] [PubMed] [Google Scholar]
- 46.Agresti A, Coull BA. Approximate is better than “exact” for interval estimation of binomial proportiions. The Am Statistician. 1998;52:119–126. [Google Scholar]
- 47.McCullagh P, Nelder JA. Generalized linear models. Boca Raton: Chapman & Hall/CRC; 1998. [Google Scholar]
- 48.Burman C, et al. Fitting of normal tissue tolerance data to an analytic function. Int J Radiat Oncol Biol Phys. 1991;21:123–135. doi: 10.1016/0360-3016(91)90172-z. [DOI] [PubMed] [Google Scholar]
- 49.Wu VW, et al. Optimizing global liver function in radiation therapy treatment planning. Phys Med Biol. 2016;61:6465–6484. doi: 10.1088/0031-9155/61/17/6465. [DOI] [PMC free article] [PubMed] [Google Scholar]
- 50.Robinson MW, Harmon C, O/’Farrelly C. Liver immunology and its role in inflammation and homeostasis. Cell Mol Immunol. 2016;13:267–276. doi: 10.1038/cmi.2016.3. [DOI] [PMC free article] [PubMed] [Google Scholar]
Associated Data
This section collects any data citations, data availability statements, or supplementary materials included in this article.


