

Abstract
Background
Previously reported data has guided the treatment and prevention of blindness. This study aimed to evaluate the current prevalence and causes of visual impairment among adults who were 50 years old and older in the Binhu District of Wuxi City, China.
Material/Methods
A randomized sample of stratified clusters was used to analyze individuals from 30 basic sampling units in Wuxi Binhu District. Visual impairment was defined according to World Health Organization (WHO) standards.
Results
A total of 6725 people who were at least 50 years old participated in this study. According to WHO standards, bilateral low vision and blindness prevalence were both higher in women than in men (low vision: 6.5% vs. 5.2%; and blindness: 1.4% vs. 0.8%; P=0.022 and P=0.039, respectively). The incidence of bilateral visual impairment increased significantly with age (P<0.001 and P<0.001, respectively). Further studies showed that the main causes of bilateral low vision were cataract, high myopic macular degeneration (MMD), and age-related macular degeneration (AMD). The main causes of bilateral blindness were cataract, MMD, and eye loss/atrophy, while the main causes of monocular low vision were cataract, MD, and AMD. The main causes of monocular blindness were cataract, eye loss/atrophy, and AMD.
Conclusions
The prevalence of low vision and blindness remains high in the Binhu District of Wuxi City in China, especially among older women. In our study, cataracts were the leading cause of visual impairment. Our study highlights that some efforts should be initiated to prevent and treat blindness and low vision. Additional causes of visual impairment were MMD, AMD, and eye loss/atrophy.
MeSH Keywords: Blindness; Cataract; Root Cause Analysis; Vision Disorders; Vision, Low
Background
Low vision and blindness represent a serious public health problem. The World Health Organization (WHO) encourages countries and institutions to identify the severity and causes of visual impairment in order to treat and eliminate avoidable cases of blindness [1]. Registered patient data can provide valuable information about blindness. Blindness registries are mainly established in developed countries and are maintained by state-funded organizations to provide assistance to the visually impaired [2]. Large-scale epidemiological investigations of eye disease began in China in the 1980s, documenting the prevalence and pathological causes of visual impairment in some areas. However, China has undergone rapid medical, public health, and economic improvement over the past decade [3–5]. Because of the importance of public health management at all levels of government, new developments have been made to advance the prevention and treatment of eye disease at the community level. Additionally, the Chinese population is rapidly aging, becoming more mobile, and advancing in socioeconomic status, which, along with other factors, may affect the rates and demographics of vision impairment and eye disease.
Wuxi, an economically developed city, is located in the southern part of Jiangsu Province. The Binhu District is located in the southwest area of Wuxi City. To characterize the pathogenic causes of visual impairment in individuals 50 years of age or older in the region, we conducted an epidemiological study of visual impairment in the Binhu District of Wuxi City from February 2016 to August 2017. We aimed to obtain a more accurate assessment of vision parameters among this population and to identify the main cause of visual impairment in this region. Furthermore, we sought to provide a scientific basis for the development of a prevention and treatment strategy for blindness in Wuxi City that was based on a rigorous epidemiological investigation.
Material and Methods
Subjects
Binhu District consists of 10 streets and its own government. It has a total population of ~460 000, which accounts for 10% of the total population of Wuxi City. The target population for this study was individuals who were 50 years of age or older. Prior to the formal investigation, training courses were carried out at a pilot site to ensure that the entire survey project was successfully completed. Survey data were used to assess the observer protocols in visual acuity measurements and diagnoses. No formal report of the data from the pilot survey is included in this article. The study staff distributed recruitment materials to each household in the target community 3 to 7 days before the survey. All subjects were identified as Han Chinese.
This survey was based on the China Nine-Province Eye Disease Investigation Program of 2006 [6] and was approved by the Jiangsu Provincial Health Department for compliance with medical ethics guidelines. Subjects signed an informed consent form before the examination, and any patient who was diagnosed with eye disease was immediately provided with a treatment opinion. This study upholds the principles of the Declaration of Helsinki and follows the guiding principles approved by the Ethics Committee of our institution. Based on the prevalence of bilateral blindness within a ±25% error range, an estimate of the 95% confidence level, and the Beijing Shunyi county eye disease survey of 1985 [7], the prevalence of blindness in the 50-year-old and above cohort was estimated to be 0.026% [5]. Based on a theoretical response rate of 90%, the required number of samples for this study would be 5018. We used a stratified cluster random sampling method, according to the China Nine-Province Eye Disease Investigation Program in 2006 [6], and constructed a sampling frame based on Public Security Bureau and Community Committee data. Finally, we randomly sampled 30 basic sampling units with a total population of 28 450, including 6725 (23.6%) individuals over the age of 50.
Clinical examinations
The locations selected for our investigation were mostly community activity centers, community hospitals, or other similar places. For convenience, the ophthalmologist would carry the necessary equipment to the home of some individuals for the necessary assessments. All subjects underwent a full ophthalmic examination, including a review of the history of disease. We used the light box of the E-word standard early diabetic retinopathy treatment study (ETDRS) vision table (Precision Vision No. 2305) to assess distant vision, a computer automatic refractometer (Topcon RM a 8000, Tokyo, Japan) combined with lens correction to check the refractive status and corrected visual acuity, a slit lamp microscope (YZ5F1, Suzhou visual, China) to check the ocular surface and front section, and a direct ophthalmoscope (YZ6F, Suzhou visual, China) in small pupil in the darkroom for fundus examinations. If there was any refractive stromal opacity influence on the fundus examination, we used compound tropicamide eye drops (from a Japanese company) to dilate the pupil and then assess the fundus [8].
Visual impairment standards were based on WHO standards, in which bilateral blindness was defined as BCVA worse than 20/400 in the better eye, and bilateral low vision was defined as BCVA 20/63 or worse, but 20/400 or better. In addition to reporting bilateral visual impairment, we also present data on monocular visual impairment. A cataract was defined according to established criteria [7]. Diabetic retinopathy was defined according to diagnostic criteria for the ocular fundus group of the Chinese Medical Association Ophthalmology Society in 2014 [9]. Myopic macular degeneration (MMD) was defined as a patient with spherical refraction greater than -6.00D that was accompanied by yellow-white fundus atrophy, posterior scleral staphyloma, or macular hemorrhage [10]. Age-related macular degeneration(AMD) was divided into dry macular degeneration and wet macular degeneration; the former was mainly macular area warts and atrophy, whereas the latter was mainly exudative or neovascular macular degeneration [11].
The survey was conducted from February 2016 to August 2017. With reference to the literature [8], community staff and ophthalmologists who were trained by the epidemiological investigators carried out household and basic information registration. Clinical ophthalmology examinations were performed by 5 ophthalmologists. If the principal cause of visual impairment was in question, a consensus was reached by consultation with 2 senior ophthalmologists based on general and ocular records. All results were entered in the standard form of an ophthalmology epidemiology survey form. The overall survey was conducted by a chief physician. The examining ophthalmologist made the primary diagnoses for residents with visual impairment. If the main causes of visual impairment were in question, a consensus was reached by discussion with 2 senior ophthalmologists based on general and ocular records. In eyes in which 2 or more diseases may have caused visual impairment, we considered the condition that would cause the greatest impact on visual impairment to be the primary diagnosis.
Data analysis
We performed statistical analyses using SPSS Statistics version 17.0 (IBM/SPSS, Inc., Chicago, IL, USA). Differences between 2 groups were assessed using the t test or Fisher exact test. The incidence of visual impairment was calculated based on a stratified age (age 50–59, 60–69, 70–79, and ≥80 years old). Using the exponential function of 2 parameters to represent the change in prevalence of visual impairment with age {prevalence=b1*exp (b2*age)}, we used the χ2 test to analyze categorical variables and defined P≤0.05 as a threshold for statistically significant differences.
Results
Among 6725 eligible subjects, there were slightly more responding cases – 6150 (91.44%) – than the expected value (90%). The reasons for not including subjects was classified as follows: temporarily left the examination area (145), had a busy schedule (125), psychological or physical illness (121), refused to participate in the investigation and/or worried about the exam causing eye damage (94), and thought that it is meaningless to conduct an eye examination for the elderly (90). The mean age ± standard deviation of the 6150 participants was greater than that of the 575 non-participants (60.8±10.1 and 59.41±9.9 years, respectively; P<0.001, unpaired t test), and there was a higher percentage of women among the participants (male-to-female ratio, 2826: 3324 vs. 304: 271; P<0.001, χ2 test).
Using the WHO standard, the prevalence of low vision was 1.7% among adults who were 50–59 years old, and increased to 29.9% (P<0.001) in subjects ≥80 years old, with an overall prevalence of 5.4% (95% CI, 5.3–6.5). For individuals aged 50–59 and ≥80 years, the corresponding low visual acuity data for PVA were 3.3% and 39.1% (P<0.001), respectively, with an overall prevalence rate of 8.2%. The rates of prevalence of best corrected and presenting blindness were 0.9% and 1.0%, respectively (Table 1).
Table 1.
Age-and gender-specific prevalence of visual impairment based on the low vision and blindness definitions of the WHO(CI=confidence interval).
| Group age (yrs) | Low vision | Blindness | |||||||
|---|---|---|---|---|---|---|---|---|---|
| BCVA | PVA | BCVA | PVA | ||||||
| No. | % (95%CI) | No. | % (95%CI) | No. | % (95%CI) | No | % (95%CI) | ||
| Female | 50–59 | 24 | 1.9 (1.2–2.9) | 47 | 3.8 (2.8–5.1) | 3 | 0.2 (0.0–0.7) | 4 | 0.3 (0.0–0.8) |
| 60–69 | 56 | 3.9 (3.0–5.1) | 102 | 7.2 (5.9–8.7) | 11 | 0.7 (0.3–1.3) | 13 | 0.9 (0.4–1.5) | |
| 70–79 | 85 | 15.7 (12.7–19.0) | 113 | 20.9 (17.5–24.6) | 15 | 2.7 (1.5–4.5) | 14 | 2.5 (1.4–4.3) | |
| ≥80 | 54 | 32.9 (25.7–40.6) | 66 | 40.2 (32.6–48.1) | 11 | 6.7 (3.3–11.6) | 12 | 7.3 (3.8–12.4) | |
| Total | 219 | 6.5 (5.7–7.4) | 328 | 9.8 (8.8–10.9) | 47 | 1.4 (10.4–18.7) | 43 | 1.2 (0.9–1.7) | |
| Male | 50–59 | 14 | 1.4 (0.7–2.3) | 27 | 2.7 (1.8–3.9) | 4 | 0.4 (0.1–1.0) | 4 | 0.4 (0.1–1.0) |
| 60–69 | 35 | 2.9 (2.0–4.0) | 59 | 4.9 (3.7–6.3) | 7 | 0.5 (0.2–1.2) | 9 | 0.7 (0.3–1.4) | |
| 70–79 | 54 | 10.9 (8.3–13.9) | 77 | 15.5 (12.4–19.0) | 5 | 1.0 (0.3–2.3) | 5 | 1.0 (0.3–2.3) | |
| ≥80 | 44 | 26.9 (20.3–34.4) | 62 | 38.0 (30.5–45.9) | 8 | 4.9 (2.1–9.4) | 9 | 5.5 (2.5–10.2) | |
| Total | 147 | 5.2 (4.4–6.0) | 225 | 7.9 (6.9–9.0) | 24 | 0.8 (0.5–1.2) | 27 | 0.9 (0.6–1.3) | |
| All | 50–59 | 38 | 1.7 (1.2–2.3) | 74 | 3.3 (2.6–4.2) | 7 | 0.3 (0.1–0.6) | 8 | 0.3 (0.1–0.7) |
| 60–69 | 91 | 3.4 (2.8–4.2) | 161 | 6.1 (5.2–7.1) | 18 | 0.6 (0.4–1.0) | 22 | 0.8 (0.5–1.2) | |
| 70–79 | 139 | 13.4 (7.4–10.3) | 190 | 18.3 (10.4–13.7) | 20 | 1.9 (0.7–1.9) | 19 | 1.8 (0.7–1.8) | |
| ≥80 | 98 | 29.9 (25.0–35.2) | 128 | 39.1 (33.8–44.6) | 19 | 5.8 (3.5–8.9) | 21 | 6.4 (4.0–9.6) | |
| Total | 366 | 5.4 (5.3–6.5) | 553 | 8.2 (8.2–9.7) | 64 | 0.9 (0.8–1.3) | 70 | 1.0 (0.8–1.4) | |
According to the WHO standard, the rate of prevalence of bilateral visual impairment among women was higher than that among men (low vision: 6.5% vs. 5.2% [OR {odds ratio}, 1.285]; and blindness: 1.4% vs. 0.8% [OR, 1.674]; χ2=5.248, P=0.022 and χ2=4.279, P=0.039, respectively; Tables 2 and 3). Additionally, we observed that the prevalence of bilateral visual impairment significantly increased with age (χ2=492.271, P<0.001; χ2=94.212, P<0.001; Tables 4 and 5). Age was found to be related to bilateral low vision or blind exponential function (Figures 1, 2). The prevalence of visual impairment in both eyes increased exponentially with age (R2=0.984, F=123.143, P=0.008; R2=0.989, F=176.740, P=0.006).
Table 2.
Comparison of low vision with gender.
| Gender | No. of participants | No. | Prevalence (%) OR | χ2 | P value |
|---|---|---|---|---|---|
| Male | 2826 | 147 | 5.2 | ||
| Female | 3324 | 219 | 6.51.285 | 5.248 | 0.022 |
Table 3.
Comparison of blindness with gender.
| Gender | No. of participants | No. | Prevalence (%) OR | χ2 | P value |
|---|---|---|---|---|---|
| Male | 2826 | 24 | 0.8 | ||
| Female | 3324 | 47 | 1.41.674 | 4.279 | 0.039 |
Table 4.
Comparison of low vision in different age groups.
| Gender | No. of participants | No. | Prevalence (%) OR | χ2 | P value |
|---|---|---|---|---|---|
| 50–59 | 2187 | 38 | 1.7 | ||
| 60–69 | 2601 | 91 | 3.4 | ||
| 70–79 | 1575 | 139 | 13.4 | ||
| ≥80 | 327 | 98 | 29.9 | 492.271 | <0.001 |
Table 5.
Frequency of blindness in different age groups.
| Gender | No. of participants | No. | Prevalence (%) OR | χ2 | P value |
|---|---|---|---|---|---|
| 50–59 | 2187 | 7 | 0.3 | ||
| 60–69 | 2601 | 18 | 0.6 | ||
| 70–79 | 1575 | 20 | 1.9 | ||
| ≥80 | 327 | 19 | 5.8 | 94.212 | <0.001 |
Figure 1.
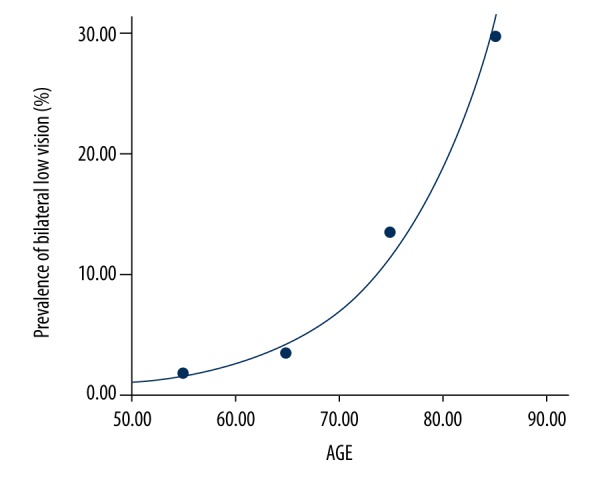
The prevalence of bilateral low vision was 0.0064457188*exp (0.0997316996*age) (F=123.143, P=0.008) with a correlation factor of R=0.984.
Figure 2.
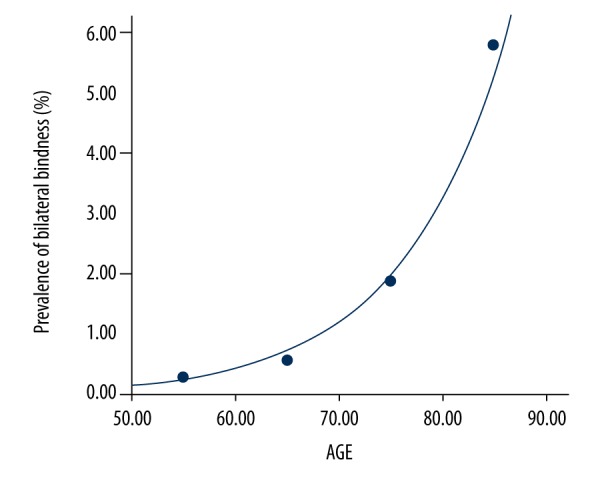
The prevalence of bilateral blindness was 0.0010536532*exp (0.1003817167*age) (F=176.740, P=0.006) with a correlation factor of R=0.989.
Using the WHO standard, the main reasons for bilateral low vision were cataract (50.00%), MMD (15.85%), and AMD (15.30%). The main reasons for bilateral blindness were cataract (48.43%), MMD (10.93%), eyeball (absent/atrophy; 7.81%), corneal opacity, and glaucoma (6.25%). The main reasons for monocular low vision were cataract (55.38%), MMD (12.6%), and AMD (9.71%). The main reasons for monocular blindness were cataract (47.37%), eyeball absent/atrophy (8.27%), and AMD (Table 6).
Table 6.
Distribution of principal causes of bilateral and monocular blindness and low vision using the World Health Organization standard.
| Bilateral | Monocular | ||||
|---|---|---|---|---|---|
| Blindness | Low vision | Blindness | Low vision | Total | |
| N (%) | N (%) | N (%) | N (%) | N (%) | |
| Cataract | 31 (48.43) | 183 (50.00) | 63 (47.37) | 211 (55.38) | 274 (53.31) |
| MMD | 7 (10.93) | 58 (15.85) | 8 (6.02) | 48 (12.60) | 56 (10.89) |
| Eyeball (absent/atrophy) | 5 (7.81) | 1 (0.27) | 11 (8.27) | 3 (0.79) | 14 (2.72) |
| AMD | 3 (4.68) | 5 (1.37) | 4 (3.00) | 6 (1.57) | 10 (1.95) |
| Cornea opacity | 3 (4.68) | 56 (15.30) | 9 (6.77) | 37 (9.71) | 46 (8.95) |
| Cornea opacity | 4 (6.25) | 10 (2.73) | 8 (6.02) | 10 (2.62) | 18 (3.50) |
| Amblyopia | 0 (0.00) | 11 (3.00) | 1 (0.75) | 14 (3.67) | 15 (2.92) |
| Posterior capsular opacification | 1 (1.56) | 9 (2.46) | 5 (3.76) | 13 (3.41) | 18 (3.50) |
| Glaucoma | 4 (6.25) | 5 (1.37) | 6 (4.51) | 15 (3.94) | 21 (4.09) |
| Retinal detachment | 1 (1.56) | 1 (0.27) | 3 (2.26) | 4 (1.05) | 7 (1.36) |
| Diabetic retinopathy | 2 (3.12) | 8 (2.19) | 3 (2.26) | 5 (1.31) | 8 (1.56) |
| Refractive error | 0 (0.00) | 9 (2.46) | 0 (0.00) | 14 (3.67) | 14 (2.72) |
| Other/undeterminable | 3 (4.68) | 10 (2.73) | 12 (9.02) | 1 (0.26) | 13 (2.53) |
| Total | 64 (100) | 366 (100) | 133 (100) | 381 (100) | 514 (100) |
MMD – high myopic macular degeneration; AMD – age-related macular degeneration.
Discussion
Low vision and blindness cause serious psychological harm to affected individuals and their families, and represents an important public health problem. The WHO, other international organizations, and some countries have worked to reduce the global blindness burden as quickly as possible with a goal of eliminating avoidable cases blindness by the year 2020 [12,13]. If we can accurately identify the causes of eye disease related to blindness and low vision, especially for diseases of the fundus, we can then establish a basis for a robust system for blindness prevention and treatment. Based on the investigation methods of Zhao et al. [7], we conducted an epidemiological investigation of eye disease in the Binhu District of Wuxi City in China using stratified random sampling.
This study assessed the prevalence and etiology of low vision and blindness in adults who were aged 50 years and older. We observed severe visual impairment in adults who were over 70 years of age (Figures 1, 2), which may be a consequence of the high rate of incidence of AMD, such as cataracts and macular degeneration, as well as the lack of appropriate early treatment of eye-related diseases. Additionally, we identified a trend for a higher likelihood of visual impairment in women compared with men (Tables 2, 3). This finding was consistent with that of both the China Nine-Province Survey (female-to-male OR of 1.41 for low vision and 1.51 for blindness) [14] and other eye studies conducted in China and other countries [15,–17].
In our study, we found that the frequencies of bilateral blindness, monocular blindness, bilateral low vision, and monocular low vision were 1.04%, 2.16%, 5.95%, and 6.19%, respectively. Compared with previous studies of eye disease [7,14], the rates of incidence of bilateral blindness, and both binocular and monocular low vision were low, whereas the prevalence of monocular blindness was relatively high. Among these criteria, the low prevalence of bilateral blindness was related to local economic levels and the implementation of policies to prevent and treat blindness. However, the prevalence of monocular blindness was also high, perhaps because the vision in the other eye was sufficient for everyday life, so these patients may have chosen not to treat their eye disease. Our analyses of the prevalence of visual impairment in different age groups showed that the prevalence of visual impairment gradually increased with age. Our data are consistent with the findings of epidemiological studies carried out in China and elsewhere [17–20]. In the present survey, the prevalence of low vision and blindness in individuals over age 80 years was higher than that of individuals of other age groups, indicating that future prevention of blindness should focus on the elderly, especially in the oldest age groups. However, only 327 individuals who were older than 80 years old were surveyed, so our conclusion needs to be confirmed in additional, larger cohorts.
In the present study, cataract was the leading cause of visual impairment in individuals who were 50 years old or older, which indicates that the prevention and treatment of blindness in the Binhu District of Wuxi City should largely focus on treatment of cataract. Hospitals and governments should develop additional plans to increase both the rate of surgery and availability of treatment. Compared with the results of a survey conducted in the 1980s [21], glaucoma and trachoma complications are no longer leading causes of blindness, as they have been replaced by MMD, eye loss/atrophy, and AMD. This finding is consistent with findings that visual impairment cases are frequently caused by fundus lesions in Beijing, Shanghai, and other places [22–24]. The rising prevalence of MMD and AMD may mainly be a consequence of social factors, such as the aging population and increases in economic levels. The increased prevalence of eye loss or atrophy was mainly a consequence of ocular trauma. In the present study, only bilateral blindness (4 cases, 2.5%) and monocular blindness (6 cases, 4.51%) were definitively diagnosed in those with glaucoma. We believe that this result may be slightly underestimated, likely because of the presence of severe cataract, which makes observing optic nerve changes associated with glaucoma difficult.
Currently, the level of economic development in Wuxi City and the degree of population aging throughout China are at a high level [8]. In the future, in the developed areas of Jiangsu Province, we need to continue to make efforts to increase the coverage of cataract surgery and reduce the occurrence of treatable blindness and low vision. Additionally, we need to improve our ability to treat ophthalmic diseases, especially the diagnosis and treatment of fundus disease. We should also improve the condition of community hospitals and encourage training of general practitioners in the diagnosis of eye diseases, especially MMD, AMD, and diabetic retinopathy. Achieving these goals will require long-term screening, early detection, early treatment, and regular follow-up to prevent further visual impairment in affected individuals.
Conclusions
Results of the present study suggest that the prevalence of visual impairment remains high in the Binhu District of Wuxi City, China, especially among older women. Cataracts remain the leading cause of visual impairment. We need to continue to increase access to cataract surgery and improve the ability to treat ophthalmic diseases, especially the diagnosis and treatment of fundus disease.
Footnotes
Source of support: Departmental sources
References
- 1.Resnikoff S, Pascolini D, Etya’ale D, et al. Global data on visual impairment in the year 2002. Bull World Health Org. 2004;82:844–51. [PMC free article] [PubMed] [Google Scholar]
- 2.Munier A, Gunning T, Kenny D, O’Keefe M. Causes of blindness in the adult population of the Republic of Ireland. Br J Ophthalmol. 1998;82:630–33. doi: 10.1136/bjo.82.6.630. [DOI] [PMC free article] [PubMed] [Google Scholar]
- 3.Wang L. Study on the reform and improvement of the medical device registration system in China. ZhongguoYi Liao Qi Xie Za Zhi. 2012;36:426–32. [PubMed] [Google Scholar]
- 4.Maignan M, Xiaoyan X, Fiere E. China’s health system reform and medical education. JAMA. 2009;302:1270–71. doi: 10.1001/jama.2009.1353. [DOI] [PubMed] [Google Scholar]
- 5.Tang YT, Wang XF, Wang JC, et al. Prevalence and causes of visual impairment in a Chinese adult population. Ophthalmology. 2015;122:1480–88. doi: 10.1016/j.ophtha.2015.03.022. [DOI] [PubMed] [Google Scholar]
- 6.Zhao JL, Wang Y, Gao XC, et al. Sampling and measurement methods of the protocol design of the China Nine-Province Survey for blindness, visual impairment and cataract surgery. Zhonghua Yan Ke Za Zhi. 2011;47:779–84. [PubMed] [Google Scholar]
- 7.Zhao J, Jia L, Sui R, et al. Prevalence of blindness among adults aged 50 years or above in Shunyi county of Beijing. Zhonghua Yan Ke Za Zhi. 1999;35:341–47. [PubMed] [Google Scholar]
- 8.Lu H, Guan HJ, Dai Z, et al. [Prevalence of blindness and moderate and severe visual impairment among adults aged 50 years or above in Qidong City of Jiangsu Province: The China Nine-Province Survey]. Zhonghua Yan Ke Za Zhi. 2012;48:205–10. [in Chinese] [PubMed] [Google Scholar]
- 9.Chinese Medical Association Ophthalmology Society of ocular fundology group. [Guidelines for clinical diagnosis and treatment of diabetic retinopathy in China (2014)]. Zhonghua Yan Ke Za Zhi. 2014;50:851–65. [in Chinese] [Google Scholar]
- 10.Hsu WM, Cheng CY, Liu JH, et al. Prevalence and causes of visual impairment in an elderly Chinese population in Taiwan: The Shihpai Eye Study. Ophthalmology. 2004;111:62–69. doi: 10.1016/j.ophtha.2003.05.011. [DOI] [PubMed] [Google Scholar]
- 11.Ambati J, Ambati BK, Yoo SH, et al. Age- related macular degeneration: Etiology, pathogenesis, and therapeutic strategies. Surv Ophthalmol. 2003;48:257–93. doi: 10.1016/s0039-6257(03)00030-4. [DOI] [PubMed] [Google Scholar]
- 12.Pararajasegaram R. VISION 2020 – the right to sight: From strategies to action. Am J Ophthalmol. 1999;128:359–60. doi: 10.1016/s0002-9394(99)00251-2. [DOI] [PubMed] [Google Scholar]
- 13.Thylefors B. A global initiative for the elimination of avoidable blindness. Am J Ophthalmol. 1998;125:90–93. doi: 10.1016/s0002-9394(99)80239-6. [DOI] [PubMed] [Google Scholar]
- 14.Zhao J, Ellwein LB, Cui H, et al. Prevalence of vision impairment in older adults in rural China: The China Nine-Province Survey. Ophthalmology. 2010;117:409–16. doi: 10.1016/j.ophtha.2009.11.023. [DOI] [PMC free article] [PubMed] [Google Scholar]
- 15.Wang Y, Liang YB, Sun LP, et al. Prevalence and causes of amblyopia in a rural adult population of Chinese the Handan Eye Study. Ophthalmology. 2011;118:279–83. doi: 10.1016/j.ophtha.2010.05.026. [DOI] [PubMed] [Google Scholar]
- 16.Li EY, Liu Y, Zhan X, et al. Prevalence of blindness and outcomes of cataract surgery in Hainan Province in South China. Ophthalmology. 2013;120:2176–83. doi: 10.1016/j.ophtha.2013.04.003. [DOI] [PubMed] [Google Scholar]
- 17.Tang YT, Wang XF, Wang JC, et al. Prevalence and causes of visual impairment in a Chinese adult population. Ophthalmology. 2015;122:1480–88. doi: 10.1016/j.ophtha.2015.03.022. [DOI] [PubMed] [Google Scholar]
- 18.Li L, Guan HJ, Xun P, et al. Prevalence and causes of visual impairment among the elderly in Nantong, China. Eye. 2008;22:1069–75. doi: 10.1038/eye.2008.53. [DOI] [PubMed] [Google Scholar]
- 19.Huang S, Zheng Y, Foster PJ, et al. Liwan Eye Study. Prevalence and causes of visual impairment in Chinese adults in urban southern China. Arch Ophthalmol. 2009;127:1362–67. doi: 10.1001/archophthalmol.2009.138. [DOI] [PubMed] [Google Scholar]
- 20.Nakamura Y, Tomidokoro A, Sawaguchi S, et al. Prevalence and causes of low vision and blindness in a rural Southwest Island of Japan: The Kumejima study. Ophthalmology. 2010;117:2315–21. doi: 10.1016/j.ophtha.2010.03.043. [DOI] [PubMed] [Google Scholar]
- 21.Chen H, Fan YC, He QH, et al. Changed trends of major causes of visual impairment in Sichuan, China from 1987 to 2006. Int J Ophthalmol. 2014;7:139–44. doi: 10.3980/j.issn.2222-3959.2014.01.26. [DOI] [PMC free article] [PubMed] [Google Scholar]
- 22.Tong XW, Zhou R, Zou HD, et al. [A prevalence investigation of blindness and vision impairment in 2009 in older adults of Dachang Blocks of Baoshan District, Shanghai, China]. Zhonghua Yan Ke Za Zhi. 2011;47:785–90. [in Chinese] [PubMed] [Google Scholar]
- 23.Xu L, Wang Y, Li Y. Causes of blindness and visual impairment in urban and rural areas in Beijing: The Beijing Eye Study. Ophthalmology. 2006;113:1134.e1–11. doi: 10.1016/j.ophtha.2006.01.035. [DOI] [PubMed] [Google Scholar]
- 24.Yao Y, Shao J, Sun W, et al. Prevalence of blindness and causes of visual impairment among adults aged 50 years or above in southern Jiangsu Province of China. Pak J Med Sci. 2013;29:1203–7. doi: 10.12669/pjms.295.3866. [DOI] [PMC free article] [PubMed] [Google Scholar]