

Abstract
Please cite this paper as: Slomka et al. (2012) Evaluation of lateral flow devices for identification of infected poultry by testing swab and feather specimens during H5N1 highly pathogenic avian influenza outbreaks in Vietnam. Influenza and Other Respiratory Viruses 6(5), 318–327.
Background Evaluation of two commercial lateral flow devices (LFDs) for avian influenza (AI) detection in H5N1 highly pathogenic AI infected poultry in Vietnam.
Objectives Determine sensitivity and specificity of the LFDs relative to a validated highly sensitive H5 RRT PCR.
Methods Swabs (cloacal and tracheal) and feathers were collected from 46 chickens and 48 ducks (282 clinical specimens) and tested by both LFDs and H5 RRT PCR. A subset of 59 chicken and 34 duck specimens was also tested by virus isolation (VI), the ‘gold standard’.
Results Twenty‐six chickens and 15 ducks were shown to be infected by at least one RRT PCR positive clinical specimen per bird. Bird‐level sensitivity for the Anigen LFD was 84·6% for chickens and 53·3% for ducks, and for the Quickvue LFD 65·4% for chickens and 33·3% for ducks. Comparison of the three clinical specimens revealed that chicken feathers were the most sensitive with 84% and 56% sensitivities for Anigen and Quickvue respectively. All 21 RRT PCR positive swabs from ducks were negative by both LFDs. However, duck feather testing gave sensitivities of 53·3% and 33·3% for Anigen and Quickvue respectively. Specificity was 100% for both LFDs in all investigations.
Conclusions Although LFDs were less sensitive than AI RRT PCR and VI, high titre viral shedding in H5N1 highly pathogenic avian influenza (HPAI) infected and diseased chickens is sufficient for a proportion of birds to be identified as AI infected by LFDs. Feathers were the optimal specimen for LFD testing in such diseased HPAI scenarios, particularly for ducks where swab testing by LFDs failed to identify any infected birds. However, specimens should be forwarded to the laboratory for confirmation by more sensitive diagnostic techniques.
Keywords: Flockside, H5N1 highly pathogenic avian influenza, lateral flow devices
Introduction
Notifiable avian influenza (NAI) is caused by poultry infections with the H5 and H7 subtypes, and highly pathogenic avian influenza (HPAI) caused by an H5N1 subtype virus has been a major problem in poultry in Vietnam and other Far Eastern countries in recent years. 1 , 2 , 3 , 4 , 5 , 6 High mortality and morbidity is apparent in infected chickens and other galliformes, but clinical signs may not always be obvious in farmed ducks, which may well be responsible for the maintenance of a reservoir of H5N1 HPAI in countries where duck rearing and production is significant. 6 , 7 , 8 This is the case in Vietnam, where a combined approach of depopulation and vaccination is used to control H5N1 HPAI outbreaks. 9 , 10 , 11 The epidemiology of HPAI in Asia is complicated by the emergence and spread of new clades of the H5N1 virus in Vietnam and neighbouring countries. 12 , 13 , 14 , 15
Carefully optimised and validated reverse transcriptase Real Time PCR (RRT‐PCR) methods for laboratory avian influenza (AI) diagnosis have been shown to be at least as sensitive as virus isolation (VI). 16 , 17 , 18 , 19 These molecular tests have gained acceptance in recent years by virtue of their high sensitivity, high specificity, rapidity, and are recommended by the World Organisation for Animal Health (OIE) and the European Union (EU). 20 , 21 , 22 , 23
However, in countries that continue to experience regular H5N1 HPAI outbreaks, there is an attraction to the use of small disposable lateral flow devices (LFDs) for flockside testing of poultry. It must be noted that, until recently, there has been an absence of publications presenting rigorous validation data for AI LFDs, particularly where evaluations have been done in field settings with clinical specimens that have also been thoroughly characterised by other more sensitive and specific tests. LFD evaluations have been conducted retrospectively in the context of H5N1 HPAI bird outbreaks in Hong Kong, 24 and prospectively in Indonesia 25 and Egypt. 26 The Indonesian and Egyptian studies each evaluated two different makes of AI LFD and affirmed that while they are not as sensitive as AI RRT‐PCRs to which they were compared, they do have sufficient sensitivity to detect a proportion of infected birds in diseased galliforme flocks. The current version of the OIE Manual of Diagnostic Tests 22 cites the Hong Kong study 24 to caution that AI LFDs lack sensitivity. LFD evaluation using swabs collected from chickens experimentally infected with H5N1 HPAI virus also demonstrated successful LFD detection in diseased birds, i.e. at the latter stages of infection when the amount of virus shed is at a peak, and failure of LFDs to detect at the earlier pre‐clinical stages when virus titres are known to be lower. 27 The Indonesian and Egyptian field studies also identified a small number of false positive LFD results. 25 , 26 Therefore, it has been emphasised that, regardless of the AI LFD result that may be obtained at flockside, clinical specimens must be forwarded to the laboratory for more sensitive and specific confirmatory testing. 26
Although swabs are the classic samples that are taken during AI outbreak investigations, the feather tropism of H5N1 HPAI in experimentally infected ducks and chickens has been observed. 28 , 29 High titres of virus were also observed in the feathers of turkeys infected experimentally with HPAI H7N1 virus that were displaying clinical signs. 18 The Egyptian field evaluation used the Anigen and Quickvue LFDs to also test feathers collected from all birds in diseased flocks that included H5N1 HPAI infected galliformes. A sensitivity of 65% relative to AI RRT‐PCR was reported for both LFDs. 26
In the present study, tracheal swabs, cloacal swabs and feather specimens taken from chickens and ducks infected with clade 2.3.2 and/or 2.3.4 HPAI H5N1 viruses during outbreaks on four separate premises in Vietnam in 2009 were used to assess the value of AI LFD testing in comparison to a validated AI RRT PCR. 17 A subset of the samples was used to compare LFDs and VI.
Materials and methods
Clinical specimens
Forty‐six chickens, including five carcasses, and 48 ducks, including nine carcasses, were sampled at four poultry flocks in the north of Vietnam where H5N1 HPAI infection caused by clades 2.3.2 and 2.3.4 had been confirmed by VI, AI RRT‐PCR with sequencing and phylogenetic analysis (accepted for publication; Avian Pathology, Slomka, To, Tong et al.; AHVLA‐Weybridge, UK and NCVD Hanoi, Vietnam). The ducks consisted of 38 Pekin ducks (Anas platyrynchos var domestica) and 10 Muscovy ducks (Cairina moschata), further details of the four flocks and the infecting viruses are summarised in Table 1. Swabs (tracheal and cloacal) and feathers were collected from all 94 birds. On return to the laboratory at the National Center for Veterinary Diagnosis (NCVD) in Hanoi, Vietnam, the swabs were each expressed into 1 ml virus transport medium (VTM) that consisted of brain‐heart infusion broth containing antibiotics (BHIB). Three or four small feathers collected from each bird, approximate length 2–3 cm, were placed into 1 ml BHIB with the non‐calcified calami at the bottom of the tube. All these 282 clinical specimens were stored frozen at −70°C at NCVD, and shipped on dry‐ice to the Animal Health and Veterinary Laboratories Agency, Weybridge (AHVLA‐Weybridge) in the UK in July 2009.
Table 1.
Description of four Vietnamese H5N1 HPAI‐infected poultry flocks sampled in 2009
| Location: abbreviated identifier: name (type of poultry holding, species) | Date sampled | Total numbers of birds: In flock/Sampled/Infected/Uninfected (parentheses indicate numbers of carcasses) | VI positive specimens (n = 52), denoted by infected species and number of isolates and anatomical site* | VI positive isolates sequenced in H5 gene (n = 29) to identify infecting clade with species and number of birds** | ||
|---|---|---|---|---|---|---|
| Chickens | Pekin ducks | Muscovy ducks | ||||
| A: Thai Nguyên Duong Van Loc (backyard, mixed) | 8/4/2009 | 80(10)/15 (0)/5/10 | 2 (0)/0/na/na | 200(14)/10(2)/3(2)/7 | Muscovy ducks 3F and chickens 5T, 4C, 5F | 2·3·2 Muscovy ducks: 3 2·3·4 chickens: 5 |
| B: Lang Son Hoang Van Thanh (backyard, mixed) | 18/4/2009 | 120(15)/10(0)/8/2 | 80(4)/15(2)/0/15(2) | None | Chickens 3T, 1C, 7F | 2·3·2 chickens: 7 |
| C: Thai Nguyên Pham Thi Lan (industrial, chickens) | 29/4/2009 | >11000(>3000)/21(5)/13 (1)/8 (4) | None | None | Chickens 2T, 3C, 7F | 2·3·2 chicken: 1 2·3·4 chickens: 6 |
| D: Quang Ninh Nguyen Van Hai (backyard, mainly ducks) | 22/6/2009 | 50(0)/0(0)/na/na | 1400(193)/23(5)/12(2)/11(3) | 10(0)/0(0)/na/na | Ducks 3T, 2C, 7F | 2·3·2 ducks: 7 |
HPAI, highly pathogenic avian influenza; VI, virus isolation.
Infected and uninfected status at bird level determined by H5 reverse transcriptase Real Time PCR as described in text.
*Anatomical site denoted by: T = trachea, C = cloaca, F = feathers.
**Refer to manuscript accepted for publication: Slomka et al., Avian Pathology; na, not applicable.
Virus isolation
This was attempted on a subset of 93 clinical specimens. These included all three clinical samples from 18 chickens and 10 ducks plus feather samples from five chickens and three ducks and a tracheal swab of a duck. On arrival at VLA‐Weybridge, BHIB supernatants from these 93 swabs and feathers were thawed, a portion was withdrawn and diluted with an equal volume of antibiotics and 200 μl volumes inoculated into each of three 9‐ to 10‐day‐old embryonated specific pathogen free fowls’ eggs (EFEs) per clinical specimen. Harvested allantoic fluids from dead and viable EFEs were tested by haemagglutination assay, and haemagglutination negative harvests were inoculated into EFEs for a second passage. 20 , 22
RNA extraction and H5 RRT‐PCR
RNA was extracted robotically by a Universal Biorobot (Qiagen, Crawley, UK) as described 18 from 140 μl of each of the BHIB specimens. The H5 RRT‐PCR was as described and validated 17 for the detection of H5 Eurasian avian influenza viruses (AIVs), and amplifies within the relatively conserved HA2 portion of the H5 gene. Ct values of <36 were considered H5 positive, ‘No Ct’ was negative and Ct values in the range 36·01–39·99 were indeterminate. 17
Lateral flow device testing for AI
For each BHIB sample, 125 μl were mixed with an equal volume of the extraction buffer supplied with the Quickvue Influenza Test (Quidel, San Diego, CA, USA), and a seperate 100 μl of BHIB were mixed with an equal volume of the AIV Ag Test kit (Anigen, Animal Genetics Inc, Gyeonggi‐Do, Korea) extraction buffer. 24 This was followed by addition of the sample to the respective LFD and incubation according to the manufacturers’ instructions.
Statistical analysis
Comparisons of % sensitivity used McNemar’s exact test for paired samples. Mean PCR Ct values for LFD positive and negative samples were compared using a two sample t‐test with adjustment for unequal variances for tracheal samples. Bartlett’s test for equal variances was used. P values are given without adjustment for multiple comparisons. Significance is set at the 5% level. If it is considered that comparisons are made typically for three sample types (i.e. tracheal swabs, cloacal swabs and feathers), using Bonferroni’s adjustment a P value of <0·0167 would allow significance to be assessed at the 5% level. Data were manipulated in Excel (Microsoft UK, Reading, UK) and statistical analyses used stata10 (Stata Corp, College Station, TX, USA).
Results
AI LFD testing relative to H5 HA2 RRT‐PCR
Two hundred and eighty‐two BHIB fluids obtained from the three types of clinical specimen taken from all 94 sampled birds were tested using the Anigen and Quickvue LFDs and H5 HA2 RRT‐PCR. AI positive and negative LFD results are plotted according to the corresponding RRT PCR Ct values obtained for each clinical specimen from the 46 chickens in Figure 1 and from the 48 ducks in Figure 2. The H5 HA2 RRT PCR was considered as a validated and highly sensitive method 17 to which the two LFDs were compared, and its efficiency in the range of 90–110% enabled quantitative interpretation of the observed Ct values. 30
Figure 1.
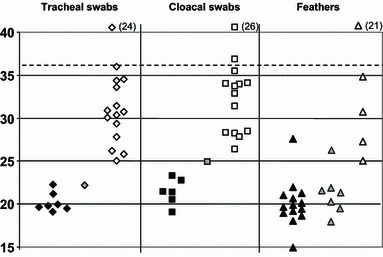
Distribution of Ct values (H5 HA2 RRT‐PCR) for chicken specimens according to lateral flow devices (LFD) results. Ct values are shown for specimens from all 46 chickens, which included tracheal swabs, cloacal swabs and feathers, indicated by diamond, square and triangle symbols respectively. All were tested by H5 HA2 RRT‐PCR and both Anigen and Quickvue LFDs. Black, grey and white fills correspond to samples that were respectively (i) positive by the RRT PCR and both LFDs, (ii) positive by the RRT PCR and the Anigen LFD but negative by the Quickvue LFD and (iii) negative by both LFDs. Parentheses adjacent to the white‐filled symbols at the head of the graph indicate the numbers of specimens that were negative by the H5 RRT PCR (‘No Ct’) and negative by both LFDs. Broken horizontal line indicates indicates positive cut‐off at Ct 36, with Ct 36·01–39·99 classed as indeterminate. RRT‐PCR, reverse transcriptase real time PCR.
Figure 2.
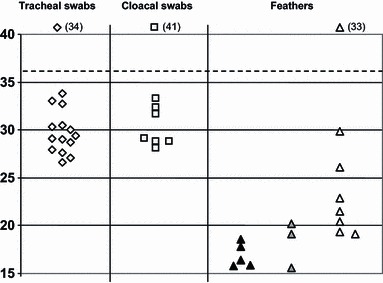
Distribution of Ct values (H5 HA2 RRT PCR) for duck specimens according to lateral flow devices (LFD) results. Ct values are shown for specimens from all 48 ducks, which included tracheal swabs, cloacal swabs and feathers, indicated by diamond, square and triangle symbols respectively. Details are as explained in the footnote to Figure 1. There were no LFD positives among the duck swabs.
For the chickens, seven of the tracheal swabs positive by RRT‐PCR were positive by both LFDs; a further RRT‐PCR positive tracheal swab was positive in the Anigen LFD, but not the Quickvue LFD (Figure 1). Both LFDs identified as positive six cloacal swabs that were positive by the RRT PCR, the Anigen LFD identified an additional positive cloacal swab (Figure 1). These 15 LFD positive chicken swab samples each registered Ct values of <25 in the RRT‐PCR test. However, among all the chicken swabs that were positive by the RRT‐PCR (Ct < 36), 14 tracheal and 12 cloacal swabs were negative by both LFDs, each of these gave a Ct value between 25 and 36 (Figure 1). For RRT‐PCR positive chicken feathers, 14 were positive by both LFDs and an additional seven were positive by the Anigen LFD, all except two of these samples registered a Ct of <25 (Figure 1). Four RRT‐PCR positive chicken feathers were negative by both LFDs (Figure 1). From these results it was calculated that for chickens the Quickvue LFD had RRT‐PCR relative sensitivities of 31·8% for tracheal swabs, 31·6% for cloacal swabs and 56·0% for feathers (Table 2a). The Anigen LFD had higher RRT‐PCR relative sensitivities for the chicken samples of 36·4% for tracheal swabs, 36·8% for cloacal swabs and a notable 84·0% for feathers (Table 2a). However, of these observed differences in sensitivity between the two LFDs, only in the case of chicken feather testing was the difference significant with the Anigen showing superior sensitivity (P = 0·016, McNemar’s exact test, Table 2a). All 71 RRT‐PCR negative chicken clinical specimens and the indeterminate chicken cloacal swab were negative by both LFDs (Figure 1), indicating a specificity of 100% for both the Anigen and Quickvue LFDs (Table 2b).
Table 2.
Comparison of Anigen and Quickvue LFDs’ performance: assessment at the level of individual specimens
| (a) Differences between % sensitivities of both LFDs | |||||
|---|---|---|---|---|---|
| Specimen tested | % sensitivity of Anigen LFD* | % sensitivity of Quickvue LFD* | Difference in % sensitivity between Anigen and Quickvue LFDs* | 95% CI** | P value*** |
| Chicken T | 36·4 | 31·8 | 4·5 | (−9, 18) | NS |
| Chicken C | 36·8 | 31·6 | 5·3 | (−10, 21) | NS |
| Chicken F | 84·0 | 56·0 | 28 | (6, 50) | 0·016 |
| Duck F | 53·3 | 33·3 | 20 | (−7, 47) | NS |
| (b) % Specificity confidence intervals for testing different clinical specimens by both LFDs | |
|---|---|
| Sample | 95% CI for specificity |
| Chicken F | 84–100 |
| Chicken T | 86–100 |
| Chicken C | 87–100 |
| Duck all | 97–100 |
Abbreviations for swabs and feathers (T, C and F) as for Table 1.
*% Sensitivities are the individual LFD result for each clinical specimen relative to the corresponding specimen’s individual H5 RRT PCR result. Sensitivity values for both LFDs and the % differences in sensitivity are shown to one decimal place. (a)** 95% Confidence Interval (CI) of the sensitivity difference and ***Unadjusted P values for the sensitivity difference. NS, not significant.
95% confidence intervals for the LFD mean specificities of 100% are shown. Confidence intervals for selected % specificities by sample type (not bird), where a true negative specimen is considered a negative specimen by H5 HA2 RRT PCR.
LFD, lateral flow device.
All 21 RRT‐PCR positive and 75 RRT‐PCR negative duck swabs, were negative by both LFDs (Figure 2). None of the positive samples registered a Ct value of <25 in the RRT‐PCR test. The only LFD RRT‐PCR positive duck samples were among the feathers, where five were positive by both LFDs and an additional three were positive by the Anigen LFD alone (Figure 2). Again, these LFD positive feathers registered Ct values of <25, but among the seven RRT‐PCR positive feathers that were negative by both LFDs, five had Ct values of <25. Analysis of these results gave each LFD a sensitivity of 0% for both duck tracheal and duck cloacal swabs relative to the H5 HA2 RRT PCR. For duck feathers the calculated sensitivities were, 33·3% for the Quickvue LFD and 53·3% for the Anigen LFD relative to the RRT‐PCR test (Table 2a). All the RRT‐PCR negative duck clinical specimens (n = 108) were negative by both LFDs (Figure 2), indicating a specificity of 100% for each LFD (Table 2b).
Distinct clustering of positive and negative LFD results with lower and higher Ct values respectively (1, 2) was also analysed statistically. The mean Ct values for LFD positive and negative samples were shown to be significantly different in all three chicken specimens and for duck feathers (Table 3a). The mean Ct values for Anigen and Quickvue positive specimens shown in 1, 2 were also determined and were shown to be very similar (Table 3b).
Table 3.
Examination of mean Ct values observed for LFD positive and negative clinical specimens
| (a) Comparison of H5 HA2 RRT PCR mean Ct values of LFD positive and LFD negatives | |||
|---|---|---|---|
| Sample type | Mean Ct for LFD negatives* (n) | Mean Ct for LFD positives** (n) | P value |
| Chicken T | 30·6 (14) | 20·6 (8) | <0·001 |
| Chicken C | 31·3 (12) | 22·0 (7) | <0·001 |
| Chicken F | 29·6 (4) | 20·6 (21) | <0·001 |
| Duck F | 22·9 (7) | 17·5 (8) | 0·0035 |
| (b) H5 HA2 RRT PCR mean Ct values and 95% CIs for Anigen and Quickvue positives | ||||||
|---|---|---|---|---|---|---|
| Sample type | Mean Anigen positive | n | Anigen 95% CI | Mean Quickvue positive | n | Quickvue 95% CI |
| Chicken T | 20·6 | 8 | 19·5,21·6 | 20·3 | 7 | 19·3,21·4 |
| Chicken C | 22·0 | 7 | 20·2,23·8 | 21·5 | 6 | 19·9,23·1 |
| Chicken F | 20·6 | 21 | 19·4,21·8 | 20·2 | 14 | 18·6,21·8 |
| Duck F | 17·5 | 8 | 16·0,19·0 | 17·0 | 5 | 15·5,18·6 |
Identification of bird‐level infection by H5 RRT‐PCR and LFDs
H5 infection at the bird‐level was established by at least one of the three clinical specimens giving a positive Ct value (i.e. <36) by the RRT–PCR test, and in the case of 17 chickens and seven ducks, all three specimens were positive (Table 4). Five chickens and seven ducks (four Pekin and three Muscovy) were judged to be H5 infected on the basis of two of the three clinical specimens being positive, whereas four chickens and one Pekin duck were considered infected on the basis of one of the three clinical specimens being positive by RRT‐PCR (Table 4). Therefore, a total of 26 chickens, 12 Pekin and three Muscovy ducks were H5 infected (Table 4). ‘No Ct’ results for all three clinical specimens were observed in 20 chickens, 26 Pekin ducks and seven Muscovy ducks, which were therefore considered to be H5 uninfected (Table 4).
Table 4.
Bird‐level diagnosis of avian influenza infection by a positive H5 HA2 RRT‐PCR result on at least one clinical specimen
| Species | Identification of infected birds by different permutations of positive clinical specimens by H5 HA2 RRT PCR results | Total number of infected plus (+) uninfected* birds | |||||
|---|---|---|---|---|---|---|---|
| All three clinical specimens positive | Two clinical specimens positive | One clinical specimen positive | |||||
| T, C, & F | T & F | C & F | T alone | C alone | F alone | ||
| Chickens | 17 | 3 (1**) | 1 | 0 | 1 | 2 (1***) | 26 + 20* |
| Pekin ducks | 7 | 4 | 0 | 0 | 0 | 1 | 12 + 26* |
| Muscovy ducks | 0 | 3 | 0 | 0 | 0 | 0 | 3 + 7* |
Abbreviations: T, C and F: As in Table 1.
RRT‐PCR, reverse transcriptase Real Time PCR.
*Uninfected birds identified by being ‘No Ct’ by H5 HA2 RRT PCR on all three clinical specimens.
**One additional bird where the cloacal swab gave an indeterminate result by the H5 HA2 RRT‐PCR.
***One additional bird where the tracheal swab gave an indeterminate result by the H5 HA2 RRT‐PCR.
Bird‐level testing was also done by the Anigen and Quickvue LFDs, and AI infection was established by at least one of the three clinical specimens being positive by the respective LFD. Negative LFD results for clinical specimens for a given bird resulted in it being considered AI uninfected. The bird‐level LFD and RRT‐PCR results were compared by considering the testing of different combinations of clinical specimens by the former (Table 5). For chickens, the highest bird‐level sensitivity relative to RRT‐PCR of 84·6% was obtained by testing all three clinical specimens by the Anigen LFD (Table 5). It was noted, however, that testing of chicken feathers alone by the Anigen LFD gave a slightly lower bird‐level sensitivity of 80·8% (Table 5). Any combination of cloacal or tracheal swab testing by either LFD registered lower relative sensitivities in the range 23·1–34·6%. In the case of ducks, as noted previously (Figure 2), failure to observe any LFD positive swabs resulted in 0% bird‐level sensitivity, but testing of feathers alone gave bird‐level sensitivities relative to RT‐PCR of 53·3% for Anigen LFD and 33·3% for Quickvue (Table 5), there was no advantage to bird‐level sensitivity by combining feathers and swabs in this duck cohort. A significant sensitivity difference between the two LFDs at bird‐level was noted only in the case of testing chicken feathers (P = 0·016, McNemar’s exact test, Table 5). This again underlined the superior sensitivity of the Anigen LFD compared with the Quickvue LFD. However, when all three clinical specimens were tested by the two LFDs, the sensitivity difference at the bird‐level between these two tests was reduced (Table 5).
Table 5.
Bird‐level sensitivity for different combinations of clinical specimens when tested by Anigen and Quickvue LFDs in comparison to H5 HA2 RRT PCR
| Species | Clinical specimen (single or combination) | Bird‐level sensitivity of LFD | Difference in % sensitivities between Anigen and Quickvue LFDs | 95% CI of difference | P value of difference | |
|---|---|---|---|---|---|---|
| Anigen | Quickvue | |||||
| Chicken | T alone | 8/26 = 30·8% | 7/26 = 26·9% | 3·9 | (−7, 15) | NS |
| C alone | 7/26 = 26·9% | 6/26 = 23·1% | 3·8 | (−7, 15) | NS | |
| T & C | 9/26 = 34·6% | 9/26 = 34·6% | 0 | NA | NS | |
| F | 21/26 = 80·8% | 14/26 = 53·9% | 26·9 | (6, 48) | 0·016 | |
| T, C & F | 22/26 = 84·6% | 17/26 = 65·4% | 19·2 | (0·2, 38) | 0·06 | |
| Ducks | Swabs (single or both T & C combined) | 0/15 = 0% | 0/15 = 0% | NA | NA | NA |
| F | 8/15 = 53·3% | 5/15 = 33·3% | 20·0 | (−7, 47) | NS | |
Sensitivity and specificity of LFDs relative to VI
This was determined for the subset of 93 clinical specimens that all been also tested by VI. The VI success rate was 37/59 (62·7%) for chicken samples and 15/34 (44·1%) for duck specimens (6, 7). All 52 VI positives were also positive by H5 HA2 RRT PCR, and when the 41 VI negative samples were tested by the RRT‐PCR 11/22 chicken and 6/19 duck samples gave positive results. Therefore, VI had a sensitivity of 75·4% relative to H5 HA2 RRT PCR in this poultry study population. For the 59 chicken specimens tested by VI, LFD sensitivities relative to VI were 67·6% for the Anigen and 54·1% for the Quickvue tests, with both LFDs having a specificity of 100% (Table 6). For the 34 duck specimens tested by VI, the sensitivities relative to VI were 53·3% for the Anigen and 33·3% for the Quickvue LFDs, although the broad 95% CI values reflect the small number of VI positive duck specimens in this study (Table 7). Both LFDs had a specificity of 100% relative to VI in the duck specimens (Table 7). As noted previously (Figure 2), the only duck specimens that were positive by either LFD were feathers (Table 7).
Table 6.
Sensitivity and specificity of avian influenza LFDs relative to VI in chicken clinical specimens (n = 59)
| (a) Anigen LFD | |||
|---|---|---|---|
| VI | Total | ||
| + | − | ||
| Anigen LFD | |||
| + | 5T, 3C & 17F = 25 | 0 | 25 |
| − | 5T, 5C & 2F = 12 | 8T, 10C & 4F = 22 | 34 |
| Total | 37 | 22 | 59 |
| (b) Quickvue LFD | |||
|---|---|---|---|
| VI | Total | ||
| + | − | ||
| Quickvue LFD | |||
| + | 5T, 3C & 12F = 20 | 0 | 20 |
| − | 5T, 5C & 7F = 17 | 8T, 10C & 4F = 22 | 39 |
| Total | 37 | 22 | 59 |
LFD, lateral flow device; VI, virus isolation.
Anigen Sensitivity: 25/25 + 12 = 67·6% (95% CI: 50·2–82·0%); Specificity: 22/0 + 22 = 100% (95% CI: 84·6–100%).
Quickvue Sensitivity: 20/20 + 17 = 54·1% (95% CI: 36·9–70·5%); Specificity: 22/0 + 22 = 100% (95% CI: 84·6–100%).
Abbreviations for clinical specimens (T, C and F) as explained in Table 1.
Table 7.
Sensitivity and specificity of avian influenza LFDs relative to VI in duck clinical specimens (n = 34)
| (a) Anigen LFD | |||
|---|---|---|---|
| VI | Total | ||
| + | − | ||
| Anigen LFD | |||
| + | 8F = 8 | 0 | 8 |
| − | 3T, 2C & 2F = 7 | 8T, 8C & 3F = 19 | 26 |
| Total | 15 | 19 | 34 |
| (b) Quickvue LFD | |||
|---|---|---|---|
| VI | Total | ||
| + | − | ||
| Quickvue LFD | |||
| + | 5F = 5 | 0 | 5 |
| − | 3T, 2C & 5F = 10 | 8T, 8C & 3F = 19 | 29 |
| Total | 15 | 19 | 34 |
LFD, lateral flow device; VI, virus isolation.
Anigen Sensitivity: 8/8 + 7 = 53·3% (95% CI: 26·6–78·7%); Specificity: 19/0 + 19 = 100% (82·4–100%).
Quickvue Sensitivity: 5/5 + 10 = 33·3% (95% CI: 11·8–61·6%); Specificity: 19/0 + 19 = 100% (95% CI: 82·4%–100%).
Abbreviations for clinical specimens (T, C and F) as explained in Table 1.
Discussion
In this field study, the Anigen and Quickvue LFDs were not as sensitive as the H5 HA2 RRT‐PCR test (1, 2). Similar observations were made in previous field studies in Indonesia and Egypt which assessed LFD performance relative to AI RRT PCR. 25 , 26 Both LFDs were also shown to be less sensitive than VI (6, 7). The present study, however, included use of the H5 HA2 RRT PCR as a quantitative tool, and examination of the Ct value distributions indicated a higher viral titre in chicken feathers compared with either of the swabs (Figure 1). Consequently, inclusion of feather testing by the two AI LFDs demonstrated that these flockside devices, in particular the Anigen LFD, can detect a significant number of chickens infected with H5N1 HPAI virus in diseased flocks, whereas the Quickvue LFD was less sensitive (Figure 1 and Table 5). The greater sensitivity of the Anigen LFD compared with the Quickvue LFD was shown to be significant for the testing of feathers, both at the individual specimen‐type level (Table 2a) and at the bird‐level (Table 5). The Egyptian field evaluation of these two LFDs in H5N1 HPAI virus infected galliformes also demonstrated greater sensitivity when feathers were sampled along with tracheal and cloacal swabs 26 : A bird‐level sensitivity of 84·2% for the Anigen LFD was observed relative to AI RRT PCR when testing swabs and feathers from each bird, 26 this being very similar to the 84·6% bird‐level sensitivity observed for the Anigen LFD when testing the same three clinical specimens in the present study (Table 5).
However, the Egyptian and the Vietnamese LFD investigations differed in the results observed when only one type of clinical specimen was tested from diseased galliformes: The Egyptian field evaluation demonstrated sensitivities relative to RRT‐PCR for tracheal swabs of 69·8% (both LFDs), for cloacal swabs 76·5% (Anigen) and 75·0% (Quickvue) and for feathers 65·1% (both LFDs), i.e. LFD testing of either of the swabs gave a greater sensitivity than the feathers. 26 In contrast, in the present study LFD testing of the same individual clinical specimens revealed chicken feathers to be more sensitive with values of 84·0% by the Anigen LFD and 56·0% for Quickvue LFD than either tracheal or cloacal swabs where sensitivity ranged between 31·6% and 36·8%, depending on which LFD was assessed (Figure 1 and Table 2). The sensitivity differences for different galliforme clinical specimens in the two studies may be related to a number of possible factors. These may include the nature of the virus in the two countries, the distribution of sampled infected birds in the flocks and their viral titre at the three anatomical sites. The protocol for swab collection and LFD evaluation also differed in detail between these two H5N1 HPAI field studies.
The Egyptian LFD evaluation which tested clade 2.2 infected galliformes showed similar sensitivities for both the Anigen and Quickvue LFDs. The present study in Vietnam differed in the Anigen LFD being more sensitive in both chickens and ducks (1, 2; 2, 5), although statistical analysis revealed that these differences were not always significant when testing different categories of clinical specimens (2, 5). Quantitative H5 HA2 RRT PCR testing of a dilution series of a clade 2.2 H5N1 HPAI virus (A/turkey/Turkey/05) had a detection limit of 104 EID50/ml for both the Anigen and Quickvue LFDs, according to unpublished data cited previously. 26 The present study revealed a detection limit for the Anigen LFD at approximately Ct 25 for the chicken specimens, which corresponds to about 104 EID50/ml (Figure 1). The Quickvue LFD failed to detect AI in eight of the chicken specimens that were positive by the Anigen LFD, even though these samples had Ct values of <25 in RRT‐PCR tests (Figure 1). However, comparison of the mean Ct values for each clinical specimen category revealed very similar values for both the Anigen and Quickvue LFDs (Table 3b). Therefore, it appears that failure of Quickvue to detect 12 Anigen positive specimens (from both chickens and ducks) in this study (1, 2) is unrelated to viral titres. One possibility is that the immunological reagents included in the Anigen AI LFD may be more appropriate for detection of the clade 2.3.2 and 2.3.4 viruses in the present study than those included in the Quickvue LFD. In the case of galliforme infections with H5N1 HPAI, the detection limit of 104 EID50/ml, approximately Ct 25 by an efficient AI RRT‐PCR, tends to be exceeded only when advanced HPAI clinical signs are observed, 23 which was the case at all four locations in the present study. This has been substantiated by experimental infections of chickens with H5N1 HPAI, in which no positive LFD results were obtained when swabs were collected at the early pre‐clinical stage of infection (24 hours post‐infection), when lower viral titres were being shed. 27 It remains to be seen whether feathers may be a useful clinical specimen for testing apparently healthy poultry at the early stages of H5N1 HPAI infection.
With respect to the specimens from ducks, none of the 21 RRT‐PCR positive swabs were detected by either of the LFDs in this study and none had a lower Ct value than 26 (Figure 2). As in the case of the chickens, examination of the Ct value distributions indicated a higher viral titre in duck feathers compared to swabs (Figure 2). Eight duck feather samples that were RRT‐PCR positive were positive by one or both of the LFDs, these had Ct values of <20 (Figure 2). Hence the Anigen LFD was again apparently more sensitive than the Quickvue LFD, but the number of samples of H5 positive duck feathers was small and this difference in sensitivity was not significant (2, 5). The mean Ct values of the duck feathers that were positive by each of the two LFDs were very similar (Table 3b), so again this suggested that any sensitivity difference was not simply due to viral titre. Five RRT‐PCR positive duck feathers had Ct values in the range 19·30–23·04, i.e. Ct < 25, but none was detected by either LFD (Figure 2). It was speculated that these feather calami may not have optimally released the AIV antigen for LFD detection. Other factors were considered, such as whether these five feathers were from ducks infected with one particular clade, from carcasses or live birds, or obtained from Pekin or Muscovy ducks, but no apparent association was observed, albeit with this small number of feather specimens. The four diseased locations sampled in this study included the sampling of 14 carcasses (five chickens, seven Pekin ducks and two Muscovy ducks) among the total of 94 birds (Table 1). However, nine of these carcasses were observed to be uninfected (Table 1), suggesting that death may have been due to another cause or possibly recorded as a consequence of culling during outbreak control. Consequently, the small number of sampled infected carcasses (one chicken, two Pekin ducks and two Muscovy ducks) precluded any investigation of whether there may be any LFD sensitivity advantage in testing carcasses or live birds in H5N1 HPAI diseased flocks.
Although no false positives were observed by LFD testing in this Vietnamese field study, these have been reported previously in both the AI LFD field evaluations conducted in Indonesia and Egypt. 25 , 26 The Egyptian study emphasised that clinical specimens must be forwarded to the laboratory for more sensitive and specific AI testing and NAI confirmation, regardless of the LFD results that are obtained at flockside. 26 When, however, flock‐level sensitivity is considered in the present study, LFDs successfully identified AI infection at all four diseased locations. The number of sampled birds of each species at the four locations ranged from 23 to 10 (Table 1). Although LFD sensitivity is clearly less than that of AI RRT PCR or VI, testing a sufficient number of birds at a diseased poultry premises may be adequate to identify an infected flock. 22 The Indonesian study recommended testing multiple animals to increase flock sensitivity, and presented statistical calculations of flock sensitivity for LFD tests for flocks with different infection prevalences and different number of birds tested. 25 A flock‐level LFD AI positive result could enable rapid implementation of control policies before confirmation in a central laboratory, whereas a negative result would still need confirmation. The sampling protocol described in this study allows for flockside LFD testing and return of the same specimen as VTM to the laboratory for VI and/or RNA extraction followed by AI RRT PCR.
The OIE notes the importance of test validation, 31 and it is hoped that studies such as the present evaluation in Vietnamese H5N1 HPAI infected poultry will provide guidance for correct and informed use of LFDs in outbreak settings. All 282 clinical specimens that were tested by both LFDs were thoroughly characterised by AI RRT PCR testing, and 93 were also tested by VI (accepted for publication; Avian Pathology, Slomka, To, Tong et al.; AHVLA‐Weybridge, UK and NCVD Hanoi, Vietnam). The high proportion of feathers with high virus titres observed in the H5N1 HPAI infected chickens and ducks in this study was reflected in the relatively high sensitivity demonstrated by LFD testing of this type of clinical specimen (1, 2, 2, 3, 5). This confirmed earlier descriptions of high virus titres in the feathers of HPAI diseased poultry, 18 , 28 , 29 and the previously described value of testing feathers from H5N1 HPAI diseased galliformes in Egypt by the Anigen and Quickvue LFDs. 26
Acknowledgements
The authors extend their thanks to the European Union Framework 6 (EU FP6) Programme for funding the FLUAID and FLUTEST international collaborative projects. Comments on the manuscript from Dr Dennis Alexander are gratefully acknowledged. © Crown copyright 2011. Reproduced with the permission of the Controller of Her Majesty’s Stationery Office/Queen’s Printer for Scotland and Animal Health and Veterinary Laboratories Agency.
References
- 1. Sims LD, Domenech J, Benigno C et al. Origin and evolution of highly pathogenic H5N1 avian influenza in Asia. Vet Rec 2005; 157:159–164. [DOI] [PubMed] [Google Scholar]
- 2. Alexander DJ. Summary of avian influenza activity in Europe, Asia, Africa and Australasia 2002–2006. Avian Dis 2007; 51(Suppl 1):161–166. [DOI] [PubMed] [Google Scholar]
- 3. Alexander DJ. An overview of the epidemiology of avian influenza. Vaccine 2007; 25:5637–5644. [DOI] [PubMed] [Google Scholar]
- 4. Brown IH. Summary of avian influenza activity in Europe, Asia, and Africa, 2006–2009. Avian Dis 2010; 54(Suppl 1):187–193. [DOI] [PubMed] [Google Scholar]
- 5. Suarez D. Avian influenza: our current understanding. Anim Health Res Rev 2010; 11:19–33. [DOI] [PubMed] [Google Scholar]
- 6. Food and Agriculture Organization of the United Nations (FAO) . Approaches to controlling, preventing and eliminating H5N1 highly pathogenic avian influenza in endemic countries. Animal Production and Health Paper. No. 171. Rome: Food and Agriculture Organization of the United Nations, 2011. Available at http://www.fao.org/docrep/014/i2150e/i2150e.pdf (Accessed 8 June 2011). [Google Scholar]
- 7. Kim J‐K, Negovetich NJ, Forrest HL, Webster RG. Ducks: the “Trojan Horses” of H5N1 influenza. Influenza Other Respi Viruses 2009; 3:121–128. [DOI] [PMC free article] [PubMed] [Google Scholar]
- 8. Henning J, Henning KA, Morton JM et al. Highly pathogenic avian influenza (H5N1) in ducks and in‐contact chickens in backyard and smallholder commercial duck farms in Viet Nam. Prev Vet Med 2010. doi: 10.1016/j.prevetmed.2010.05.016 [DOI] [PubMed] [Google Scholar]
- 9. Sims LD. Lessons learned from Asian H5N1 outbreak control. Avian Dis 2007; 51(Suppl 1):174–181. [DOI] [PubMed] [Google Scholar]
- 10. Domenech J, Dauphin G, Rushton J et al. Experiences with vaccination in countries endemically infected with highly pathogenic avian influenza: the Food and Agriculture Organization perspective. Rev Sci Tech 2009; 28:293–305. [DOI] [PubMed] [Google Scholar]
- 11. Soares Magalhães RJ, Pfeiffer DU, Otte J. Evaluating the control of HPAIV H5N1 in Vietnam: virus transmission within infected flocks reported before and after vaccination. BMC Vet Res 2010; 6:31. [DOI] [PMC free article] [PubMed] [Google Scholar]
- 12. Dung Nguyen T, Vinh Nguyen T, Vijaykrishna D et al. Multiple sublineages of influenza A virus (H5N1), Vietnam, 2005–2007. Emerg Infect Dis 2008; 14:632–636. [DOI] [PMC free article] [PubMed] [Google Scholar]
- 13. Chen J, Fang F, Yang Z et al. Characterization of highly pathogenic H5N1 avian influenza viruses isolated from poultry markets in central China. Virus Res 2009; 146:19–28. [DOI] [PubMed] [Google Scholar]
- 14. Pfeiffer J, Pantin‐Jackwood M, To TL, Nguyen T, Suarez DL. Phylogenetic and biological characterization of highly pathogenic H5N1 avian influenza viruses (Vietnam 2005) in chickens and ducks. Virus Res 2009; 142:108–120. [DOI] [PubMed] [Google Scholar]
- 15. Li Y, Shi J, Zhong G et al. Continued evolution of H5N1 influenza viruses in wild birds, domestic poultry, and humans in China from 2004 to 2009. J Virol 2010; 84:8389–8397. [DOI] [PMC free article] [PubMed] [Google Scholar]
- 16. Spackman E, Senne DA, Myers TJ et al. Development of a real‐time reverse transcriptase PCR assay for type A influenza virus and the avian H5 and H7 hemagglutinin subtypes. J Clin Microbiol 2002; 40:3256–3260. [DOI] [PMC free article] [PubMed] [Google Scholar]
- 17. Slomka MJ, Pavlidis T, Banks J et al. Validated H5 Eurasian real‐time reverse transcriptase–polymerase chain reaction and its application in H5N1 outbreaks in 2005–2006. Avian Dis 2007; 51(Suppl 1):373–377. [DOI] [PubMed] [Google Scholar]
- 18. Slomka MJ, Pavlidis T, Coward VJ et al. Validated real time reverse transcriptase PCR methods for the diagnosis and pathotyping of Eurasian H7 avian influenza viruses. Influenza Other Respi Viruses 2009; 3:151–164. [DOI] [PMC free article] [PubMed] [Google Scholar]
- 19. Monne I, Ormelli S, Salviato A et al. Development and validation of a one step real time PCR assay for simultaneous detection of subtype H5, H7, and H9 avian influenza viruses. J Clin Microbiol 2008; 46:1769–1773. [DOI] [PMC free article] [PubMed] [Google Scholar]
- 20. European Union (EU) . Diagnostic manual for avian influenza [Internet]. Official Journal of European Union L237/1 (31 Aug). Available at http://eur‐lex.europa.eu/LexUriServ/site/en/oj/2006/l_237/l_23720060831en00010027.pdf 2006 (Accessed 8 June 2011).
- 21. Hoffmann B, Beer M, Reid SM et al. A review of RT‐PCR technologies used in veterinary virology and disease control: sensitive and specific diagnosis of five livestock diseases notifiable to the World Organisation for Animal Health. Vet Microbiol 2009; 139:1–23. [DOI] [PubMed] [Google Scholar]
- 22. OIE (World Organisation for Animal Health) . Manual of diagnostic tests and vaccines for terrestrial animals, chapter 2.3.4. “Avian influenza”. Paris: OIE; Available at http://www.oie.int/fileadmin/Home/eng/Health_standards/tahm/2.03.04_AI.pdf 2010 (Accessed 8 June 2011). [Google Scholar]
- 23. Slomka MJ, Irvine RM, Pavlidis T, Banks J, Brown IH. Role of real time RT‐PCR platform technology in the diagnosis and management of notifiable avian influenza outbreaks: experiences in Great Britain. Avian Dis 2010; 54(Suppl 1):591–596. [DOI] [PubMed] [Google Scholar]
- 24. Chua T‐H, Ellis TM, Wong CW et al. Performance evaluation of five detection tests for avian influenza antigen with various avian samples. Avian Dis 2007; 51:96–105. [DOI] [PubMed] [Google Scholar]
- 25. Loth L, Prijono WD, Wibawa H, Usman TB. Evaluation of two avian influenza type A rapid antigen tests under Indonesian field conditions. J Vet Diagn Invest 2008; 20:642–644. [DOI] [PubMed] [Google Scholar]
- 26. Soliman M, Selim A, Coward VJ et al. Evaluation of two commercial lateral flow devices (LFDs) used for flockside testing of H5N1 highly pathogenic avian influenza infections in backyard gallinaceous poultry in Egypt. J Mol Genet Med 2010; 4:247–251. [DOI] [PMC free article] [PubMed] [Google Scholar]
- 27. Marché S, van den Berg T. Evaluation of rapid antigen detection kits for the diagnosis of highly pathogenic avian influenza H5N1 infection. Avian Dis 2010; 54:650–654. [DOI] [PubMed] [Google Scholar]
- 28. Yamamoto Y, Nakamura K, Okamatsu M, Miyazaki A, Yamada M, Mase M. Detecting avian influenza virus (H5N1) in domestic duck feathers. Emerg Infect Dis 2008; 14:1671–1672. [DOI] [PMC free article] [PubMed] [Google Scholar]
- 29. Yamamoto Y, Nakamura K, Yamada M, Mase M. Comparative pathology of chickens and domestic ducks infected with highly pathogenic avian influenza viruses (H5N1) isolated in Japan in 2007 and 2008. Jpn Agric Res Q 2010; 44:73–80. [Google Scholar]
- 30. McPherson MJ, Møller SG. Real‐Time RT‐PCR, Chapter 9; in PCR, 2nd edn New York and Oxford: Taylor and Francis, 2006; 209–231. [Google Scholar]
- 31. OIE (World Organisation for Animal Health) . Manual of diagnostic tests and vaccines for terrestrial animals, chapter 1.1.4/5. “Principles and methods of validation of diagnostic assays for infectious diseases”. Paris: OIE; Available at http://www.oie.int/fileadmin/Home/eng/Health_standards/tahm/1.1.04_VALID.pdf 2010 (Accessed 8 June 2011). [Google Scholar]