

Abstract
Objectives: Influenza surveillance systems have been established in many countries in the world, yielding timely information about the intensity and features of seasonal outbreaks. Such data have also been used to estimate epidemiological parameters and to evaluate the effect of factors on infection dynamics. However, little is known about the extent of under‐reporting in surveillance data, and thus of the true influenza incidence in the population.
Design: Through mathematical and statistical modelling, we analysed Italian epidemiological and virological surveillance data collected together with serological data derived from influenza vaccine clinical trials performed in Italy.
Results: Depending on the season, the reporting rate estimates ranged between 20% and 33% of the total incidence with higher reporting rates in seasons dominated by A/H3N2 virus. Despite a generally higher number of individuals immune against A/H3N2 viruses, effective reproduction ratios were quite similar in all seasons varying between 1·2 and 1·4. We observed an age‐dependent transmissibility for different subtypes: susceptible children were more likely than susceptible adults and elderly to get infected when A/H1N1 or B strains were circulating, while no clear age‐dependence was found for A/H3N2. We also perform sensitivity analysis under different assumptions for vaccine effectiveness, generation time (GT) and model variants; we found that the overall results in predicted patterns were extremely similar, with a slightly better fit obtained with shorter GTs.
Conclusions: Our results provide relevant information on the influenza dynamics to fine‐tune intervention strategies and for data collection improvement.
Keywords: Mathematical modelling, parameter estimation, seasonal influenza, sentinel surveillance system, virological and serological data
Introduction
Owing to the substantial morbidity and mortality impact 1 of influenza epidemics and also to their economic burden, 2 their containment has become a major public health goal. Surveillance programs have been established in many countries in the world, 3 and data are regularly collected during seasonal outbreaks. Such data have been used to estimate crucial epidemiological parameters, 2 , 4 to forecast or simulate the dynamics of these epidemics, 5 , 6 to evaluate the effect of specific factors or interventions on the disease dynamics. 7 , 8 , 9 However, it is generally believed that the surveillance systems underestimate the true number of cases, 10 and little is known about the extent of under‐reporting.
During the 2009/2010 pandemic season, the importance of monitoring influenza activity has been emphasized because the existing surveillance system in Italy was not sufficient to describe the pandemic. In fact, a number of additional surveillance systems were developed in Italy to provide a more complete picture of influenza. 11
For this reason, we have analysed the dynamics of seasonal influenza in Italy before the pandemic spread, using data derived from the national sentinel surveillance system (epidemiological and virological), coupled with data on susceptibility derived from influenza vaccine clinical trials conducted at the national level. By a joint analysis of these two data sets, we have estimated age‐specific transmission rates, levels of immunity in different age groups and reporting rates, and derived an estimate for the basic reproductive ratio.
Materials and methods
The National Influenza Sentinel Surveillance System
In Italy, the Influenza Sentinel Surveillance System (INFLUNET) was implemented nationwide in season 1999–2000 by the INFLUNET working group. 12 INFLUNET is based on voluntary participation of an average of 830 (range, 648–902) general practitioners (including paediatricians) per year, covering about 1·5–2% of the national population distributed in all Italian regions. The system aims to monitor the incidence of influenza‐like illness (ILI), defining the extent and the timing of seasonal epidemics. In our analysis, we excluded the first season of INFLUNET surveillance system activity (1999/2000) because data collected could be affected by bias related to the fact that was the first season of implementation of the system [e.g. ILI case definition used by general practicioners (GPs) for the first time].
GPs are asked to report ILI cases (defined as acute onset of fever >38°C, + respiratory symptoms + one of these symptoms: headache, general discomfort, asthenia) weekly (from week 42 to week 17) using standardized forms. Specific information regarding age (0–14, 15–64, >64 years) and influenza vaccine status are also collected. We excluded the first year of data collection and focus the analysis on INFLUNET data collected from the 2000/2001 to 2008/2009 seasons.
The national virological surveillance system
The influenza virological surveillance in Italy is routinely carried out, between week 46 and week 17 of the following year, by the National World Health Organization (WHO) Influenza Centre at Istituto Superiore di Sanita’ (NIC‐ISS), in collaboration with a network of 15 peripheral laboratories distributed in 14 of the 21 Italian regions. Main objective of these activities is to rapidly characterize the influenza viruses circulating in the country and to identify antigenic variants emerging in human populations during the winter season, to update the vaccine composition, in collaboration with WHO and European Centre for Disease Prevention and Control (ECDC). During the virological surveillance period, sampling kits are sent out to a random sample of GPs participating in the INFLUNET surveillance system, to collect throat swabs of the first patients with ILI seen each week. Collected swabs are then sent to the regional reference laboratories for influenza diagnosis, and the isolated strains are characterized at the regional laboratory or directly sent to NIC‐ISS for further molecular and antigenic analyses. Overall results obtained throughout the country are weekly reported to NIC‐ISS using web‐based electronic forms.
Every year, approximately 2000 samples are collected, with a proportion of positive specimens of about 34%.
Serology data
Each year, to test immunogenicity of the seasonal vaccines available, serological tests are performed in September and October on a sample (approximately 100 for each season) of voluntary patients older than 18 years. The amount of a specific antigen and the concentration of antibodies to a specific virus in a blood serum sample are measured using the hemagglutination inhibition (HI) and single radial haemolysis (SRH) assays. The HI and SRH tests are performed in accordance with standard procedures. 13 , 14 Serology assays for immunogenicity of seasonal vaccines are performed at the Department of Physiopathology, Experimental Medicine and Public Health of the University of Siena.
When the tested strains are included those that have circulated in the incoming season, the results of the tests yield an estimate of the level of immunity in the adult and elderly population at the start of the influenza season. Moreover, when the tested strain coincides with the one circulating in the previous season, an estimate of the proportion of immune individuals at the end of the previous season is obtained, given that during the summer influenza activity is negligible.
As in Italy, seasonal influenza vaccination is recommended for individuals older than 64 years, and in our estimation procedure, the observed level of immunity in the elderly class has been corrected to account for vaccination coverage, which increased from 51 to 68% in the last decade. 15 For vaccine effectiveness (VE), we made two different assumptions: (i) VE of 70% for al1 categories and (ii) VE of 50% for al1 categories; for both assumptions, we assumed that the VE would be reached starting 15 days after the second dose. 16
The model
We have used an susceptible–exposed–infectious–removed (SEIR) deterministic model with age structure, employing the same age groups used for surveillance: 0–14, 15–64 and older than 64. We did not consider spatial heterogeneity in the model because no clear pattern in data collected was found (Figure 1), and the model would have been more complex. In each age class, the individuals are classified as susceptible (S), exposed (E), infectious (I) or removed (R). Individuals progress through these four groups following the course of the infection. We used the SEIR model to analyse the epidemic seasons for which we could derive estimates of the proportion of susceptible individuals at the beginning and/or at the end of the season.
Figure 1.
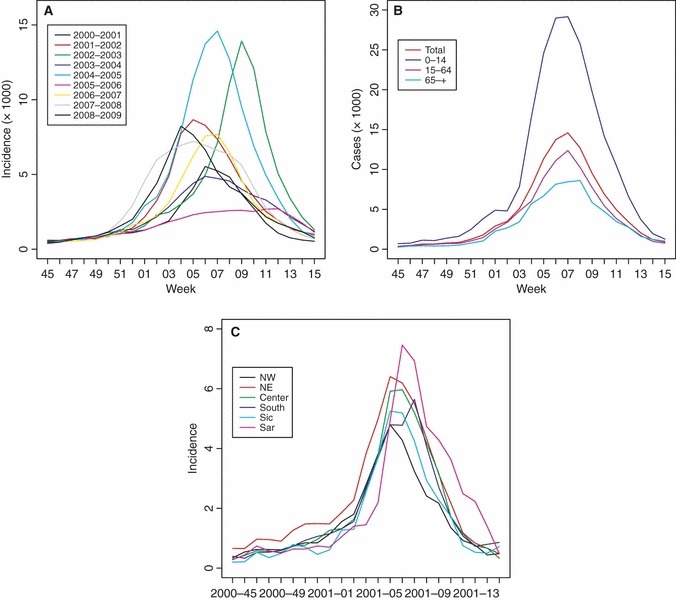
Observed epidemic curves (weekly incidence data) in Italy. (A) Entire population, all seasons. (B) Three age groups and entire population, season 2004–2005. (C) Distribution by geographic area, season 2000–2001.
The model is defined by a set of differential equations reported in the Supporting Information. We have used a mean incubation period of 1 day 17 and a mean infectious period of 3 days. 4 , 5 , 6 , 17 , 18 , 19 Transmission between and within age classes is proportional to the number of contacts between individuals, derived from the results of the population‐based survey conducted by Mossong et al. 20 Given a contact between two individuals, we have distinguished between the probability of transmission to children (θC) and to adults and elderly (θAE), allowing for a higher probability of children to be infected. However, in our analysis, we have tested also the hypothesis θC = θAE.
The basic reproductive ratio R 0, corresponding to the average number of individuals infected by an infectious in a wholly susceptible population, is defined as the dominant eigenvalue of the next generation matrix, as proposed by Diekmann and Heesterbeek. 21
Parameter inference
While many authors 5 , 6 , 22 , 23 , 24 , 25 provide reliable estimates of the average length of the latent and infectious periods, there exist no direct measures of the transmission rate, and very few estimates of the fraction of individuals initially susceptible in the population. 9
In this study, we have estimated from the data the probabilities per contact of acquiring the infection for children and adults/elderly respectively, the initial fraction of susceptible individuals in each age class, the reporting rate ρ(assumed constant over the course of the season and by age) plus some other technical parameters, among which the average number of ILI cases because of causes other than influenza viruses. From the values of these parameters, we have derived an estimate for the reproductive ratio.
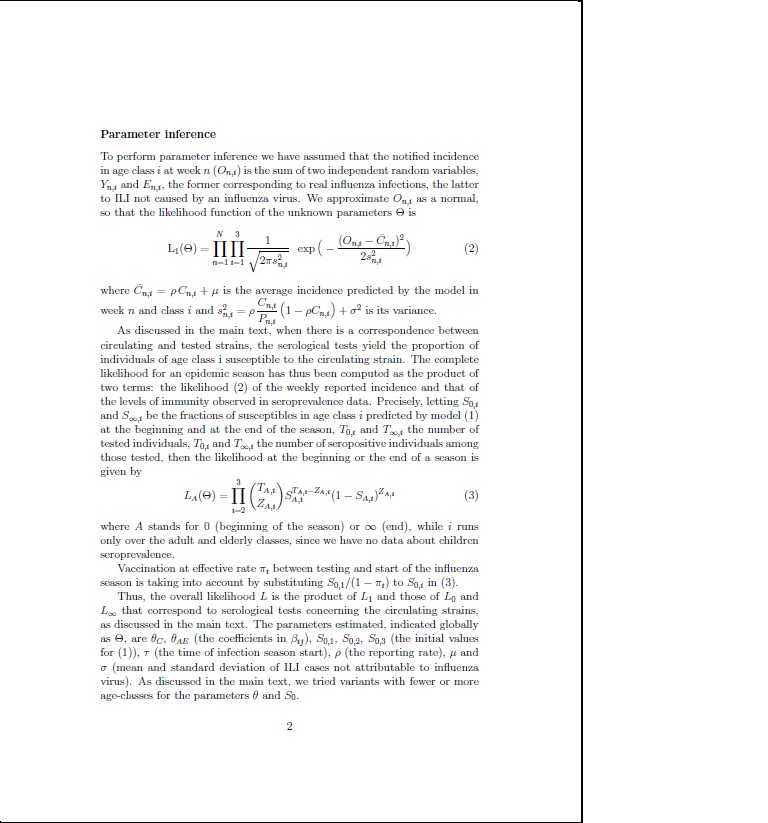
Parameter inference has been performed using maximum likelihood techniques, where the likelihood is the product of two terms, one denoting the probability of the reported weekly incidence given the model predictions, the other one denoting the probability of the observed serological tests, given the estimate of the immune fractions; the exact likelihood function is presented in the Supporting Information.
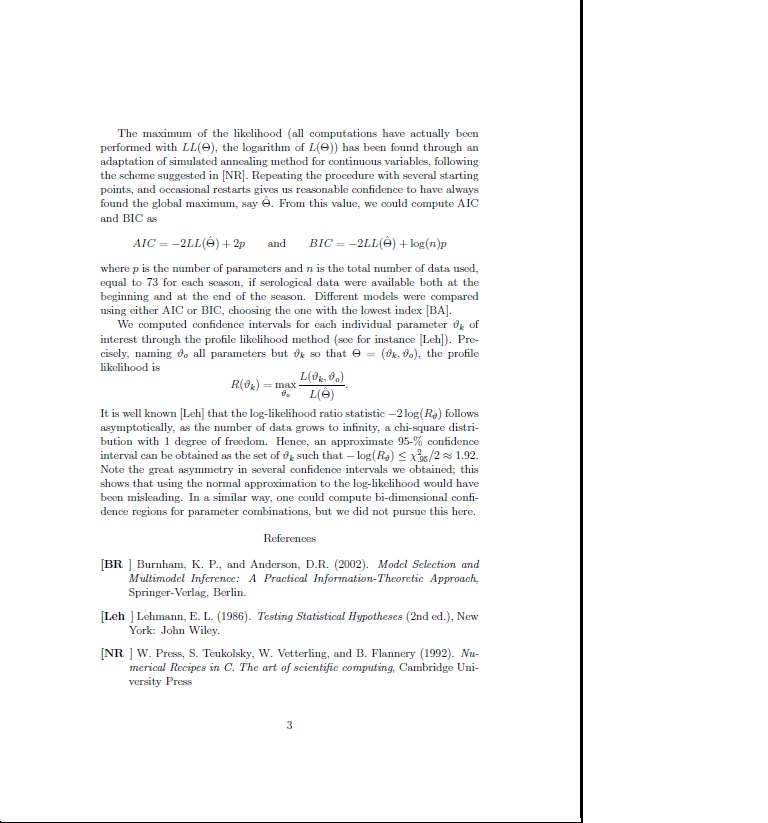
Confidence intervals for each parameter have been based on a limiting distribution of the empirical likelihood ratio. 26
To test the hypothesis of equal transmissibility in all age groups, we have compared, using the Akaike and Bayesian information criterion (AIC and BIC), 27 the baseline model (where the probability of acquiring the infection differs between children, on one hand, and adults and elderly, on the other one) with a model with constant probability of acquiring the infection and with the one where this probability differs in all age groups. We have also considered a variant where the probability of acquiring the infection is age independent, but the reporting rate differs between all age groups.
Results
Epidemiological surveillance
INFLUNET data were processed to estimate the incidence of ILI cases in the three age classes considered (Figure 1). We exclude from the analysis the data collected during the 1999/2000 season as this was the first season of implementation of INFLUNET in Italy. From 2000/2001 to 2007/2008, the attack rate of epidemics varies from a minimum of 4% to a maximum of 11% during the study period. Age‐structured data show a much higher incidence in children than in adults and elderly. Overall, each year, the epidemic curves in different age groups were well synchronized, and they all peaked approximately at the same time (Figure 1B), while in different seasons, the peak was reached in different weeks. No clear pattern by geographic area in Italy was found in data collected (Figure 1C).
Virological surveillance
The proportions of cases ascribed to the three influenza viruses subtypes, derived from the analysis of virological data, are reported in Table 1. We consider a virus predominant when the proportion of the circulating virus was ≥70%.
Table 1.
Proportion of cases ascribed to the three predominant circulating (sub)types, predominant types and strains, proportion of susceptible individuals estimated from serological data in the last nine epidemic seasons
| Season | Proportion of (%) | Predominant (sub)type and strain | ||
|---|---|---|---|---|
| A/H1N1 | A/H3N2 | B | ||
| 2000–2001 | 93 | 1 | 6 | A/H1N1/NewCaledonia/20/99 |
| 2001–2002 | 1 | 19 | 81 | B/Hong Kong/330/01 |
| 2002–2003 | 6 | 88 | 6 | A/H3N2/Moscow/10/99 |
| 2003–2004 | 2 | 92 | 6 | A/H3N2/Fujian/411/02 |
| 2004–2005 | 9 | 65 | 26 | Multiple strains |
| 2005–2006 | 56 | 21 | 23 | Multiple strains |
| 2006–2007 | 30 | 65 | 6 | Multiple strains |
| 2007–2008 | 45 | 7 | 48 | A: Multiple strains B: B/Florida/4/06 |
| 2008–2009 | 4 | 90 | 6 | A/H3N2/Brisbane/10/07 |
During the 2000/2001 season, the predominant virus was the subtype A/H1N1 (A/New Caledonia/20/99) circulating virus (93%). The same subtype virus was isolated at the beginning of season 2001/02, but after the first isolation, the predominant subtype (81%) was a B virus (B/HongKong/330/01). Viruses of subtype A/H3N2 were predominant in seasons 2002/03 (88%), 2003/04 (92%) and 2008/09 (90%), while in other seasons, two or three (sub)types co‐circulated, without a clear predominance.
Serological results
Results regarding the proportion of susceptible individuals estimated at the beginning and at the end of each season using serological data, in the last nine epidemic seasons, are reported in Table 2, including the correction to account for vaccination in elderly. Seasons for which serological data were available were 2000–2001, 2001–2002, 2002–2003, 2003–2004, 2007–2008, because relevant immunity data are available for B‐type virus (48% of the cases), and 2008–2009. For 2001–2002, 2003–2004, 2007–2008 seasons, serological results were available at the end of the seasons while for season 2008–2009 at the start. For both seasons (i.e. 2000–2001 and 2002–2003) in which serological data were available at the start and at the end of the season, we observed a reduction in the susceptible population.
Table 2.
Proportion of susceptible individuals estimated at the start and at the end of the season using serological data in the last nine epidemic seasons, including the correction to account for vaccination in elderly
| Season | Predominant (sub)type and strain | Susceptible adults (%) | Susceptible elderly (%) | ||
|---|---|---|---|---|---|
| Start | End | Start | End | ||
| 2000–2001 | A/H1N1/NewCaledonia/20/99 | 80 | 64 | 41 | 27 |
| 2001–2002 | B/Hong Kong/330/01 | N.A. | 59 | N.A. | 29 |
| 2002–2003 | A/H3N2/Moscow/10/99 | 64 | 19 | 39 | 3 |
| 2003–2004 | A/H3N2/Fujian/411/02 | N.A. | 27 | N.A. | 11 |
| 2004–2005 | Multiple strains | N.A. | N.A. | N.A. | N.A. |
| 2005–2006 | Multiple strains | N.A. | N.A. | N.A. | N.A. |
| 2006–2007 | Multiple strains | N.A. | N.A. | N.A. | N.A. |
| 2007–2008 | A: Multiple strains B: B/Florida/4/06 | N.A. N.A. | N.A. 68 | N.A. N.A. | N.A. 21 |
| 2008–2009 | A/H3N2/Brisbane/10/07 | 83 | N.A. | 42 | N.A. |
N.A., not available (tested and circulated strains did not coincide).
Estimates of model parameters
Using the SEIR model, we have analysed the epidemic seasons for which we could derive the estimates of the proportion of susceptible individuals at the beginning and/or at the end of the season (i.e. 2000–2001, 2001–2002, 2002–2003, 2003–2004, 2007–2008 and 2008–2009).
Estimated parameter values for the analysed seasons are given in Table 3, together with 95% confidence intervals. Incidences observed and predicted are shown in Figure 2.
Table 3.
Parameter estimations obtained for the three predominant influenza (sub)types A/H1N1. A/H3N2 and B in seasons where the calculations where possible
| Parameters | Description | A/H1N1 | A/H3N2 | B | |||
|---|---|---|---|---|---|---|---|
| 2000–2001 | 2002–2003 | 2003–2004 | 2008–2009 | 2001–2002 | 2007–2008 | ||
| θC | Children transmissibility | 0·375 (0·374–0·501) | 0·339 (0·329–0·356) | 0·275 (0·268–0·332) | 0·334 (0·323–1·804) | 0·352 (0·344–1·536) | 0·314 (0·309–0·442) |
| θAE | Adults and elderly transmissibility | 0·179 (0·164–0·194) | 0·429 (0·379–0·487) | 0·600 (0·481–0·750) | 0·198 (0·174–0·218) | 0·214 (0·192–0·254) | 0·207 (0·187–0·232) |
| ρ | Reporting rate | 19·7% (18·6–26·2) | 24·1% (21·9–26·3) | 33·4% (28·3–40·1) | 22·4% (19·1–98·2) | 26·5% (25·2–99·3) | 20·1% (18·2–27·5) |
| S0 C | Fraction of susceptible children at the start of the epidemic | 1·0 (0·752–1·0) | 1·0 (0·944–1·0) | 1·0 (0·838–1·0) | 1·0 (0·256–1·0) | 1·0 (0·256–1·0) | 1·0 (0·713–1·0) |
| S0 A | Fraction of susceptible adults at the start of the epidemic | 0·775 (0·730–0·819) | 0·446 (0·400–0·493) | 0·304 (0·245–0·372) | 0·821 (0·765–0·837) | 0·703 (0·554–0·775) | 0·771 (0·697–0·842) |
| S0 E | Fraction of susceptible elderly at the start of the epidemic | 0·275 (0·207–0·352) | 0·349 (0·288–0·411) | 0·203 (0·153–0·262) | 0·469 (0·359–0·583) | 0·342 (0·230–0·450) | 0·375 (0·265–0·486) |
| S∞ C | Fraction of susceptible children at the end of the epidemic | 0·465 | 0·485 | 0·758 | 0·522 | 0·504 | 0·609 |
| S∞ A | Fraction of susceptible adults at the end of the epidemic | 0·668 | 0·274 | 0·218 | 0·676 | 0·584 | 0·655 |
| S∞ E | Fraction of susceptible elderly at the end of the epidemic | 0·251 | 0·257 | 0·166 | 0·416 | 0·304 | 0·340 |
| Re | Effective reproductive ratio | 1·36 | 1·35 | 1·17 | 1·28 | 1·31 | 1·21 |
| μ | Average number of cases because of other respiratory infections | 0·71 × 10−3 (0·58–0·84) | 0·91 × 10−3 (0·68–1·15) | 0·36 × 10−3 (0·19–0·51) | 0·86 × 10−3 (0·53–1·06) | 0·74 × 10−3 (0·50–0·96) | 0·31 × 10−3 (0·15–0·47) |
| R 2 C | Children | 0·99 | 0·98 | 0·95 | 0·94 | 0·97 | 0·98 |
| R 2 A | Adults | 0·90 | 0·94 | 0·97 | 0·82 | 0·91 | 0·75 |
| R 2 E | Elderly | 0·26 | 0·89 | 0·88 | 0·72 | 0·78 | 0·73 |
| R 2 tot | Total | 0·97 | 0·97 | 0·98 | 0·92 | 0·97 | 0·91 |
Numbers in parenthesis represent 95% confidence intervals.
Figure 2.
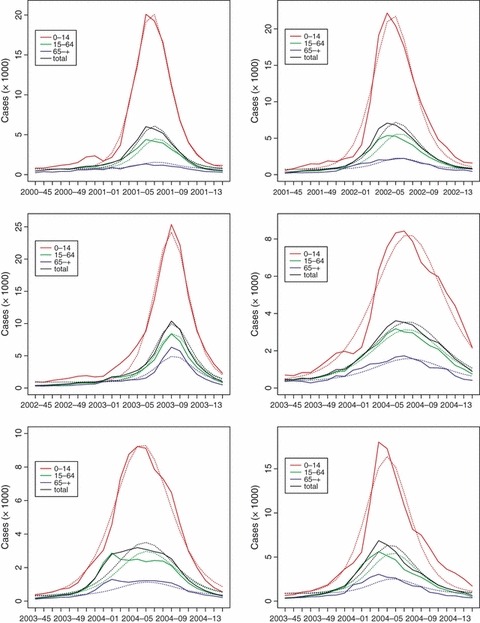
Graphical comparison between the observed influenza epidemics in Italy (dashed lines) during the analysed seasons and the epidemic curves predicted by model (1) (solid lines). Figure shows the curves for each age class (colour, coded as in the key) and for the entire population (in black).
The fit to the ILI data is very good for all seasons, except for the elderly, for which the discrepancy between the model prediction and the data is sometimes remarkable, if measured by R 2. However, in the elderly class, we have few cases, with incidences as low as one or two cases per 1000 individuals during the peak week; thus, a high relative error corresponds to a very small absolute error.
Our estimates for the reporting rate vary between 19·7 and 33·4% (below 26% for all but one season 2003/2004), depending on the circulating virus, and tend to be higher for A/H3N2. This means that the actual incidence would be three to six times higher than the incidence reported by the surveillance system. Note that our model does not allow for changes in reporting rate during an epidemic season.
Regarding the probability of acquiring the infection (θ), the estimated values show that for seasonal viruses A/H1N1 and B transmissibility is approximately twice higher in children than in other age groups. Results for the two B seasons are very similar. Results for virus A/H3N2 are less clear: in two of the seasons, transmissibility is higher in adults and elderly, but in season 2008–2009, the estimates are similar to those observed for viruses A/H1N1 and B.
The estimated initial fraction of susceptible individuals strongly decreases with age, from around 100% in children to values between 30 and 82% in adults and from 20 to 46% in elderly.
These estimates allow us to compute the effective reproductive ratio for each season and for each circulating (sub)type. According to our results, R e varies between 1·2 and 1·4. This estimate is actually quite robust and similar to what can be estimated by a simple fit to the exponential part of the incidence curves. 28 The estimates available in the literature for R 0 vary widely, mainly within a range of 3–10, 29 , 30 while those for R e, which takes into account the pre‐existing immunity, are similar (R e = 1–2·4) to those observed with our data. 2 , 6
Another interesting result of our analysis is the estimate of the average number of misnotifications μ, that is, cases that are notified as influenza but are attributed to other respiratory viruses with similar symptoms. The estimates vary between 0·4 and 1 cases per 1000 individuals per week, meaning that on average around 40·000 cases are notified each week as influenza cases but are actually attributed to other causes. This value is slightly higher than the value of 0·3 found 10 for England, Wales and the Netherlands.
Sensitivity analysis and model variants
As mentioned above, we examined the effect of assuming that vaccination efficacy (VE) was 50% instead of 70% taken as baseline. We also considered the effect of shorter or longer infectious periods, with generation time (GT) of 2·6 or 4 days, instead of the baseline of 3 days. The results for the season 2000–2001 are shown in Table 4, together with the analysis of model variants. Analogous ones, with few differences, can be obtained for all other seasons.
Table 4.
Parameter estimates obtained for season 2000–2001 under different assumptions for vaccine efficacy (VE) or generation time (GT), or under model variants
| Model variant | AIC | R 2 | Transmissibility θ | Susceptible fraction S 0 | Reporting rate ρ (%) | RE |
|---|---|---|---|---|---|---|
| Baseline | 549·4 | C 0·99 A 0·90 E 0·26 Tot 0·97 | C 0·375 A–E 0·179 | C 1·0 A 0·775 E 0·275 | 19·7 | 1·36 |
| VE = 50% | 556·9 | C 0·99 A 0·90 E 0·21 Tot 0·97 | C 0·375 A–E 0·178 | C 1·0 A 0·777 E 0·304 | 19·8 | 1·36 |
| GT = 2·6 days | 546·7 | C 0·99 A 0·92 E 0·28 Tot 0·97 | C 0·449 A–E 0·223 | C 1·0 A 0·772 E 0·272 | 21·7 | 1·31 |
| GT = 4 days | 558·2 | C 0·99 A 0·85 E 0 Tot 0·96 | C 0·277 A–E 0·118 | C 1·0 A 0·786 E 0·282 | 16·7 | 1·50 |
| θC = θA = θE | 722·9 | C 0·98 A 0·58 E 0 Tot 0·89 | 0·335 | C 1·0 A 0·545 E 0·243 | 22·0 | 1·32 |
| θC ≠ θA ≠ θE | 548·2 | C 0·99 A 0·90 E 0·33 Tot 0·97 | C 0·376 A 0·181 E 0·089 | C 1·0 A 0·772 E 0·309 | 19·6 | 1·37 |
| θC = θA = θE ρC ≠ ρA ≠ ρE | 556·3 | C 0·99 A 0·96 E 0·41 Tot 0·99 | 0·284 | C 1·0 A 0·837 E 0·351 | C 20·3 A 5·9 E 2·9 | 1·35 |
It can be seen that a different VE has a very limited effect: parameter estimates changed by at most one digit in the last reported decimal, except for the estimated susceptibility of elderly that consistently increased: because serological data concern a pre‐vaccination moment, assuming a lower VE results in more elderly being susceptible to infection. Assuming a different GT has the well‐known effect 28 of changing the estimate reproduction number R 0, given that the growth rate is yielded by data; still, the overall results in predicted patterns are extremely similar, with a slightly better fit obtained with shorter GTs.
As for model variants, it clearly emerges that the model without age differences either in transmissibility or in reporting rate fits the data significantly worse. The models with two or three different transmission coefficients are statistically equivalent according to Akaike’s criterion, 27 so that we preferred the simpler model as baseline. Finally, an important observation from Table 4 is that, with all model variants statistically acceptable, we obtained extremely similar estimates of all quantities, such as susceptible fractions or reproduction number (with the caveat of its relation with the assumed GT) that are in common across models.
Discussion
We have analysed the spread of influenza in Italy during the last decade, integrating the data coming from the INFLUNET system, from the virological surveillance system coupled with the results of serological tests conducted at the national level. The estimated parameter values obtained from our analysis may help to gain a deeper insight into the dynamics of the seasonal influenza infections.
One key factor in determining these dynamics is certainly population susceptibility. Estimates of the fraction of susceptible individuals, varying between 25 and 100%, are available in the literature, 6 , 9 , 31 , 32 but, up to our knowledge, there are no estimates based on a joint analysis of incidence and serological data as performed in this study. Our model assumes that individuals are either immune or not, even if in reality they could be partially immune to a subtype after a contact with a similar virus. Moreover, our model does not account for any possible decay in antibody levels over the summer period. However, widespread evidence suggests that the decay is limited in a few months span (3–6 months), 33 and for this reason, we decide not to include a new parameter basically unidentifiable through the available data. With this caveats, the estimated initial fraction of susceptible is very high (about 100%) in children (0–14), and lower for the other age groups, ranging between 30 and 82%, in adults (15–64) and from 20 to 46% in elderly (64 and over). This is in agreement with the results of the previous studies 4 , 34 and with the epidemiology of influenza: in fact, adults, and especially elderly, are more likely to have a partial immunity to the circulating strain, because of the previous contacts with similar viruses. 35 , 36 Moreover, these estimates include the effect of vaccination, with about 60% of people older than 65 being vaccinated at the beginning of each season. 15
An estimate of 100% susceptibility in children may be considered implausible, as a reasonable proportion of them will have had multiple influenza exposures. First of all, one may note that often the same strains had not circulated for several years before the season under study, so that exposure to the same antigen may had been rare. Still, the extreme estimate of 100% appears unlikely biologically and presumably is selected by the model to account for the much higher reported incidence in children than in adults, because the lack of serological tests in children does not set any constraints to susceptibility levels. Possibly, this could be corrected by allowing for a higher reporting rate in children than in adults (while our model assumes, as stated above, constant reporting rate) and/or for the possibility that serological tests underestimate the actual degree of protection existing in the population. However, we had no independent data to verify these hypotheses; adding more unknown parameters would have made the models unidentifiable.
A comparison with the susceptible fractions estimated from serological data (when available) shows that, except for few values, there is a very good correspondence between the data and the estimates. A relevant discrepancy between observed and predicted values is found only in season 2002–2003, when the observed changes in seroprevalences differ from what could be gathered from the reported flu incidences. In this case, we could say that the dynamical model corrects the serological measures into the epidemiological relevant quantities.
In our model, we did not couple outbreaks in different years, only one season at a time is considered. However, seasonality is a driving force that has a major effect on the spatio‐temporal dynamics of influenza transmission. 37 Recently, a forced SIR epidemic model has been recognized to be able to identify a new threshold effect, taking into account the population’s susceptibility measured after the last outbreak and the rate at which new susceptible individuals are recruited into the population to give clear analytical conditions for predicting the occurrence of either a future epidemic outbreak or a ‘skip’ a year in which an epidemic fails to initiate. 38 This is something that should be better investigated in the future.
In our model, we allowed for a difference in ‘susceptibility’ (i.e. probability of acquiring the infection if exposed) among the individuals of different ages. According to our hypothesis, a strain to which individuals are more susceptible can be considered more transmissible. Our analysis suggests that A/H3N2 is generally more transmissible than A/H1N1 and B viruses, especially to adults and elderly. In fact, while for A/H1N1 and B transmissibility to children is about twice as large as in other age groups, for A/H3N2 transmissibility to adults and elderly is as high as to children in two of the three analysed seasons. Our results are in overall agreement with the previous studies. 9 , 31 , 39 , 40 , 41 A study by Pérez‐Trallero et al. 42 shows that all age classes get infected more often with A/H3N2 than with A/H1N1, possibly due to less frequent antigenic mutation in the latter, but this is especially true for elderly, possibly because of old antigenic memory. Moreover, recent studies on 2009 pandemic have shown that even the large diffusion of the pandemic virus in youngest individuals, many, of all ages, remained susceptible after the main 2009 wave in Hong Kong and Italy. 43 , 44
The issue of reporting is one of the limits of the influenza surveillance system, because of the impossibility to monitor the occurrence of influenza in those individuals who do not seek medical assistance. The risk associated with this limit is an underestimation of influenza incidence rates in the community. The subtype‐specific reporting rate estimated in our analysis is higher for A/H3N2 (varying between 18 and 30% for the three selected seasons) and slightly lower for B (between 16 and 22%) and A/H1N1 (around 17%). In general, available estimates vary between 12·5% 45 and 50% 9 and are consistent with our values. Our estimates provide a first measure of evaluation of the surveillance system, which is commonly believed to underestimate the true number of cases. 10
We have assumed that reporting rates do not vary with age, which could represent an alternative explanation to the observed differences in population susceptibility. Indeed, Xia et al. 46 had pointed out that elderly are more likely to visit their GP when infected. To have model predictions with equal ‘susceptibilities’ compatible with actual notifications, one would have to assume that A/H1N1 and B cases are notified more often among children than among adults and elderly, while A/H3N2 are notified equally among all classes. The present data do not allow us to exclude this hypothesis; more extensive serological data, including also children, would be needed for that.
An interesting result of our analysis that is not affected by these uncertainties is the estimation of strain‐dependent effective reproductive ratios, with values ranging from 1·2 to 1·4. Earlier studies 9 , 31 proposed similar estimates. As mentioned above, these estimates depend on the assumed length of GT; clearly, allowing for uncertainty in this would result in wider confidence intervals for R 0.
The same type of analysis could be extended to all other seasons, but the lack of relevant immunological data prevents the use of the same methods. To perform the analysis without serological data, one could assume that reporting rate and transmissibility are intrinsic property of a (sub)type and do not change with antigenic drift, but our analysis suggests that this is not the case, especially for (sub)type A/H3N2. Another problem concerns those seasons in which two or more strains co‐circulated, for which further results on the potential role of short‐term cross‐protection 46 , 47 would be of great value.
Our model reproduces the observed dynamics of influenza remarkably well; a possible extension of our analysis could include spatial heterogeneities or, given the importance of transmission in children, 9 school holidays. A statistical analysis of the potential influence of school holidays and temperature patterns on transmission is underway.
Despite the model limitations, our results provide important information on the dynamics of influenza and estimates of subtype‐specific parameters that may be useful to calibrate intervention strategies or to improve data collection.
Supporting information
Appendix S1. Understanding the dynamics of seasonal influenza in Italy: supporting information.
Supporting info item
Supporting info item
Supporting info item
Acknowledgements
We thank the reviewers for their valuable comments. This work was supported by the European Union FP7 FluModCont project and the Italian Ministry of Health project (Grant no. 1M22) for research funding. There are no financial or other relationships that might lead to a conflict of interest.
References
- 1. Rizzo C. Trends for influenza‐related deaths during pandemic and epidemic seasons, Italy, 1969–2001. Emerg Infect Dis 2007; 13:694–699. [DOI] [PMC free article] [PubMed] [Google Scholar]
- 2. Chowell G, Miller MA, Viboud C. Seasonal influenza in the United States, France, and Australia: transmission and prospects for control. Epidemiol Infect 2008; 136:852–864. [DOI] [PMC free article] [PubMed] [Google Scholar]
- 3. World Health Organization . WHO global influenza preparedness plan: the role of WHO and recommendations for national measures before and during pandemics. WHO/CDS/CSR/GIP/2009 5 2009.
- 4. Cauchemez S, Carrat F, Viboud C, Valleron AJ, Boelle PY. A Bayesian MCMC approach to study transmission of influenza: application to household longitudinal data. Stat Med 2004; 23:3469–3487. [DOI] [PubMed] [Google Scholar]
- 5. Flahault A, Letrait S, Blin P, Hazout S, Menares J, Valleron AJ. Modelling the 1985 influenza epidemic in France. Stat Med 1988; 7:1147–1155. [DOI] [PubMed] [Google Scholar]
- 6. Grais RF, Ellis JH, Kress A, Glass GE. Modeling the spread of annual influenza epidemics in the U.S.: the potential role of air travel. Health Care Manag Sci 2004; 7:127–134. [DOI] [PubMed] [Google Scholar]
- 7. Brownstein JS, Kleinman KP, Mandl KD. Identifying pediatric age groups for influenza vaccination using a real‐time regional surveillance system. Am J Epidemiol 2005; 162:686–693. [DOI] [PMC free article] [PubMed] [Google Scholar]
- 8. Brownstein JS, Wolfe CJ, Mandl KD. Empirical evidence for the effect of airline travel on inter‐regional influenza spread in the United States. PLoS Med 2006; doi:10.1371/journal.pmed.0030401. [DOI] [PMC free article] [PubMed] [Google Scholar]
- 9. Cauchemez S, Valleron AJ, Boelle PY, Flahault A, Ferguson NM. Estimating the impact of school closure on influenza transmission from Sentinel data. Nature 2008; 452:750–754. [DOI] [PubMed] [Google Scholar]
- 10. Fleming DM, Zambon M, Bartelds AI, de Jong JC. The duration and magnitude of influenza epidemics: a study of surveillance data from sentinel general practices in England, Wales and the Netherlands. Eur J Epidemiol 1999; 15:467–473. [DOI] [PubMed] [Google Scholar]
- 11. Cnesps‐ISS . FLUNEWS. Available at: http://www epicentro iss it/focus/h1n1/archivioflunews asp 2010.
- 12. Istituto Superiore di Sanità . Influnet Surveillance System. Available at: http://www iss it/iflu, 2010 November 16.
- 13. Ellis JS, Zambon MC. Molecular analysis of an outbreak of influenza in the United Kingdom. Eur J Epidemiol 1997; 13:369–372. [DOI] [PMC free article] [PubMed] [Google Scholar]
- 14. Schild GC, Henry‐Aymard M, Pereira MS et al. Antigenic variation in current human type A influenza viruses: antigenic characteristics of the variants and their geographic distribution. Bull World Health Organ 1973; 48:269–278. [PMC free article] [PubMed] [Google Scholar]
- 15. Ministero della Salute . Influenza Vaccination Coverage. Available at: http://www salute gov it/influenza/paginaInternaMenuInfluenza jsp?id=679&menu=strumentieservizi2010.
- 16. Ciofi degli Atti ML, Rizzo C, Bella A, et al. . Scenarios of diffusion and control of influenza pandemic in Italy. 2006. Report No. 33. [DOI] [PMC free article] [PubMed]
- 17. Ferguson NM, Cummings DA, Cauchemez S et al. Strategies for containing an emerging influenza pandemic in Southeast Asia. Nature 2005; 437:209–214. [DOI] [PubMed] [Google Scholar]
- 18. Boelle PY, Ansart S, Cori A, Valleron AJ. Transmission parameters of the A/H1N1 (2009) influenza virus pandemic: a review. Influenza Other Respi Viruses 2011; 5:306–316. [DOI] [PMC free article] [PubMed] [Google Scholar]
- 19. Cowling BJ, Fang VJ, Riley S, Malik Peiris JS, Leung GM. Estimation of the serial interval of influenza. Epidemiology 2009; 20:344–347. [DOI] [PMC free article] [PubMed] [Google Scholar]
- 20. Mossong J, Hens N, Jit M et al. Social contacts and mixing patterns relevant to the spread of infectious diseases. PLoS Med 2008; 5:e74. [DOI] [PMC free article] [PubMed] [Google Scholar]
- 21. Diekmann O, Heesterbeek JAP. Mathematical Epidemiology of Infectious Diseases, 2000 edn Chichester, West Sussex, England: Wiley, 2000. [Google Scholar]
- 22. Chowell G, Ammon CE, Hengartner NW, Hyman JM. Estimation of the reproductive number of the Spanish flu epidemic in Geneva, Switzerland. Vaccine 2006; 24:6747–6750. [DOI] [PubMed] [Google Scholar]
- 23. Longini IM. The generalized discrete‐time epidemic model with immunity: a synthesis. Math Biosci 1986; 82:19–41. [Google Scholar]
- 24. Longini IM. A mathematical model for predicting the geographical spread of new infectious agents. Math Biosci 1987; 90:367–383. [Google Scholar]
- 25. Hyman JM, LaForce T. Modelling the spread of influenza among cities; in: Banks HT, Castillo‐Chavez C. (eds): Bioterrorism. SIAM, New York, 2003; 211–236. [Google Scholar]
- 26. Lehmann EL. Testing Statistical Hypotheses, 2nd edn New York: Wiley, 1986. [Google Scholar]
- 27. Burnham KP, Anderson DR. Model Selection and Multimodel Inference: A Practical Information‐Theoretic Approach. Berlin: Springer‐Verlag, 2002. [Google Scholar]
- 28. Wallinga J, Lipsitch M. How generation intervals shape the relationship between growth rates and reproductive numbers. Proc Biol Sci 2007; 274:599–604. [DOI] [PMC free article] [PubMed] [Google Scholar]
- 29. Fraser C, Riley S, Anderson RM, Ferguson NM. Factors that make an infectious disease outbreak controllable. Proc Natl Acad Sci U S A 2004; 101:6146–6151. [DOI] [PMC free article] [PubMed] [Google Scholar]
- 30. Spicer CC, Lawrence CJ. Epidemic influenza in Greater London. J Hyg (Lond) 1984; 93:105–112. [DOI] [PMC free article] [PubMed] [Google Scholar]
- 31. Chowell G, Nishiura H, Bettencourt LM. Comparative estimation of the reproduction number for pandemic influenza from daily case notification data. J R Soc Interface 2007; 4:155–166. [DOI] [PMC free article] [PubMed] [Google Scholar]
- 32. Flahault A, Deguen S, Valleron AJ. A mathematical model for the European spread of influenza. Eur J Epidemiol 1994; 10:471–474. [DOI] [PubMed] [Google Scholar]
- 33. Wright PF, Sannella E, Shi JR, Zhu Y, Ikizler MR, Edwards KM. Antibody responses after inactivated influenza vaccine in young children. Pediatr Infect Dis J 2008; 27:1004–1008. [DOI] [PMC free article] [PubMed] [Google Scholar]
- 34. Viboud C, Boelle PY, Cauchemez S et al. Risk factors of influenza transmission in households. Br J Gen Pract 2004; 54:684–689. [PMC free article] [PubMed] [Google Scholar]
- 35. Mathews JD, McCaw CT, McVernon J, McBryde ES, McCaw JM. A biological model for influenza transmission: pandemic planning implications of asymptomatic infection and immunity. PLoS ONE 2007; 2:e1220. [DOI] [PMC free article] [PubMed] [Google Scholar]
- 36. Mathews JD, McBryde ES, McVernon J, Pallaghy PK, McCaw JM. Prior immunity helps to explain wave‐like behaviour of pandemic influenza in 1918‐9. BMC Infect Dis 2010; 10:128. [DOI] [PMC free article] [PubMed] [Google Scholar]
- 37. Truscott J, Fraser C, Cauchemez S et al. Essential epidemiological mechanisms underpinning the transmission dynamics of seasonal influenza. J R Soc Interface 2012; 9:304–312. [DOI] [PMC free article] [PubMed] [Google Scholar]
- 38. Stone L, Olinky R, Huppert A. Seasonal dynamics of recurrent epidemics. Nature 2007; 446:533–536. [DOI] [PubMed] [Google Scholar]
- 39. Mercer GN, Barry SI, Kelly H. Modelling the effect of seasonal influenza vaccination on the risk of pandemic influenza infection. BMC Public Health 2011; 11(Suppl. 1):S11. [DOI] [PMC free article] [PubMed] [Google Scholar]
- 40. Minayev P, Ferguson N. Improving the realism of deterministic multi‐strain models: implications for modelling influenza A. J R Soc Interface 2009; 6:509–518. [DOI] [PMC free article] [PubMed] [Google Scholar]
- 41. Omori R, Adams B, Sasaki A. Coexistence conditions for strains of influenza with immune cross‐reaction. J Theor Biol 2010; 262:48–57. [DOI] [PubMed] [Google Scholar]
- 42. Perez‐Trallero E, Pineiro L, Vicente D, Montes M, Cilla G. Residual immunity in older people against the influenza A(H1N1) – recent experience in northern Spain. Euro Surveill 2009; Available at: http://www.eurosurveillance.org/ViewArticle.aspx?ArticleId=19344. [DOI] [PubMed] [Google Scholar]
- 43. Riley S, Kwok KO, Wu KM et al. Epidemiological characteristics of 2009 (H1N1) pandemic influenza based on paired sera from a longitudinal community cohort study. PLoS Med 2011; 8:e1000442. [DOI] [PMC free article] [PubMed] [Google Scholar]
- 44. Rizzo C, Rota MC, Bella A et al. Cross‐reactive antibody responses to the 2009 A/H1N1v influenza virus in the Italian population in the pre‐pandemic period. Vaccine 2010; 28:3558–3562. [DOI] [PubMed] [Google Scholar]
- 45. Grais RF, Ellis JH, Glass GE. Assessing the impact of airline travel on the geographic spread of pandemic influenza. Eur J Epidemiol 2003; 18:1065–1072. [DOI] [PubMed] [Google Scholar]
- 46. Xia Y, Gog JR, Grenfell BT. Semiparametric estimation of the duration of immunity from infectious disease time series: influenza as a case study. J R Stat Soc Ser C Appl Stat 2005; 54:659–672. [Google Scholar]
- 47. Nuno M, Feng Z, Martcheva M, Castillo‐Chavez C. Dynamics of two strain influenza with isolation and partial cross immunity. SIAM J Appl Math 2005; 65:964–982. [Google Scholar]
Associated Data
This section collects any data citations, data availability statements, or supplementary materials included in this article.
Supplementary Materials
Appendix S1. Understanding the dynamics of seasonal influenza in Italy: supporting information.
Supporting info item
Supporting info item
Supporting info item