

Abstract
Objective To summarize evidence for the diagnostic accuracy of procalcitonin (PCT) tests for identifying secondary bacterial infections in patients with influenza.
Methods Major databases, including MEDLINE, EMBASE, and the Cochrane Library, were searched for studies published between January 1966 and May 2009 that evaluated PCT as a marker for diagnosing bacterial infections in patients with influenza infections and that provided sufficient data to construct two‐by‐two tables.
Results Six studies were selected that included 137 cases with bacterial coinfection and 381 cases without coinfection. The area under a summary ROC curve was 0·68 (95% CI: 0·64–0·72). The overall sensitivity and specificity estimates for PCT tests were 0·84 (95% CI: 0·75–0·90) and 0·64 (95% CI: 0·58–0·69), respectively. These studies reported heterogeneous sensitivity estimates ranging from 0·74 to 1·0. The positive likelihood ratio for PCT (LR+ = 2·31; 95% CI: 1·93–2·78) was not sufficiently high for its use as a rule‐in diagnostic tool, while its negative likelihood ratio was reasonably low for its use as a rule‐out diagnostic tool (LR− = 0·26; 95% CI: 0·17–0·40).
Conclusions Procalcitonin tests have a high sensitivity, particularly for ICU patients, but a low specificity for identifying secondary bacterial infections among patients with influenza. Because of its suboptimal positive likelihood ratio and good negative likelihood ratio, it can be used as a suitable rule‐out test but cannot be used as a standalone rule‐in test.
Keywords: Bacterial pneumonia, influenza, procalcitonin
Introduction
Coinfections with bacterial pathogens in patients with influenza pneumonia have been well documented for the 1918–19 influenza pandemic and have been shown to be a major cause of influenza‐related deaths. 1 , 2 , 3 , 4 Post‐mortem autopsies uniformly showed severe pathological changes compatible with bacterial pneumonia in patients who had died from influenza in 1918. 5 In the spring of 2009, a novel influenza A virus (H1N1) of swine origin was identified in the USA and Mexico, which rapidly led to a worldwide pandemic. During this pandemic, the incidence of bacterial coinfections was estimated to be 20–30%. 6 , 7 However, owing to the poor sensitivities of culture methods to identify respiratory bacterial etiologies, this figure may well have been an underestimate. 8
The early identification of secondary bacterial infections among patients with influenza infections may enable the early administration of antibiotics and, possibly, improve patient outcomes. However, clinical variables, such as patient characteristics, chest radiographic findings, or routine laboratory results, are unreliable for distinguishing between viral and bacterial lower respiratory tract infection, which may coexist influenza. 9
Procalcitonin (PCT) is a precursor protein of calcitonin whose production is stimulated by endotoxin and pro‐inflammatory cytokines, such as interleukin‐one beta and tumor necrosis factor‐alpha. Unlike C‐reactive protein (CRP), PCT production is inhibited by interferon‐gamma, a cytokine that is produced during viral infections. 10 , 11 Because of this characteristic, PCT has been shown to differentiate between bacterial and viral infections in many pediatric studies. Recently, several studies have examined its ability to differentiate influenza pneumonia from mixed bacterial and viral infections. However, the relatively small sample sizes in these studies have limited its generalizability. 12 , 13 , 14 , 15 , 16 , 17
The aim of our study was to systemically review and qualitatively summarize the current evidence for the diagnostic role of PCT in discriminating between viral and mixed pneumonia among patients with influenza infections.
Methods
We followed standard guidelines and methods for systematic reviews and meta‐analyses of diagnostic tests. 18 , 19
Data sources and searches
We conducted electronic searches, without language restrictions, of the MEDLINE, EMBASE, and Cochrane Library databases from their inceptions to November 2011. PubMed was searched by combining two separate queries comprised of medical subject headings (MeSH terms) and text word (tw) keywords for the diagnostic tests and target outcomes. Keywords used for searching included H1N1, influenza, swine flu, avian flu, and procalcitonin. We adapted this search strategy for the EMBASE and Cochrane Library databases. We also sought additional references from the bibliographies of the selected articles and other recent review articles.
Inclusion and exclusion criteria
Two reviewers independently identified articles that were eligible for in‐depth examinations using the following inclusion criteria: (i) evaluation of procalcitonin alone or compared with other laboratory markers, such as CRP, to diagnose bacterial pneumonia in patients with H1N1 influenza infection, and (ii) sufficient data to construct a 2 × 2 contingency table. We used studies of human subjects aged 18 years or older. We excluded case reports, case series, review articles, editorials, and clinical guidelines. Two of the authors independently assessed all titles and abstracts to determine that the inclusion criteria were satisfied. Full‐text articles were retrieved if any of the reviewers considered the abstract to be suitable. The two authors then independently assessed the full texts of the retrieved studies for their suitability for inclusion. Any discrepancies between reviewers regarding an article’s inclusion were resolved by a consensus meeting of three authors. Study selection is summarized in Figure 1.
Figure 1.
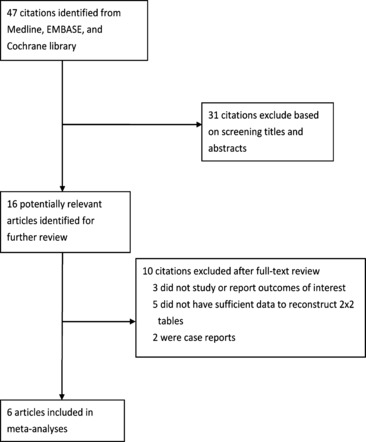
Flow chart used for study identification and inclusion.
Quality assessment
Quality of the selected studies was assessed using Quality Assessment of Diagnostic Accuracy Studies (QUADAS) criteria. 19 , 20 , 21
Data synthesis and analysis
We calculated the sensitivity and specificity for each included data set. For studies that reported multiple pairs of sensitivity or specificity, we used the pair of sensitivity and specificity that maximizes the Youden index. The Youden index is calculated by Sensitivity + Specificity−1, which enables the selection of an optimal threshold value for the marker. Given the negative correlation between sensitivity and specificity in different studies using different PCT cutoff values, we estimated the pooled sensitivity and specificity for PCT using a bivariate model. 22 The bivariate approach assumed a bivariate distribution for logit‐transformed sensitivity and specificity. In addition to accounting for study size, the bivariate model estimated and adjusted for the negative correlation between the sensitivity and specificity of an index test that may have arisen from different thresholds used in different studies. A summary receiver operating characteristic (ROC) curve was constructed to summarize the true‐ and false‐positive rates from different diagnostic studies. To deal with zero observations in 2 × 2 contingency tables, ½ was added to each cell, which reduced the performance for small studies. Overall sensitivity, specificity, and their 95% confidence intervals were calculated based on the binominal distributions of the true positives and true negatives.
To formally quantify the extent of between‐study variation (i.e., heterogeneity), we calculated an inconsistency index, I 2, which represents the proportion of heterogeneity not explained by random variation. 23 , 24 Statistically significant heterogeneity was considered for I 2 > 50%. 23 , 24
We also conducted a diagnostic odds ratio meta‐analysis. The diagnostic OR is defined as the ratio of the odds of the test being positive for a patient with the disease in relation to the odds of the test being positive for a patient without the disease. It can be used to estimate the risk of secondary bacterial pneumonia in an influenza patient tested positive for PCT. Unadjusted data were used exclusively in all meta‐analyses. Summary diagnostic odds ratios were estimated by random (DerSimonian‐Laird) or fixed (Peto) effect models, depending on whether I 2 was >50%. 25 We used linear regression for log odds ratios for the inverse root of effective sample sizes as a test for funnel plot asymmetry in our diagnostic meta‐analyses. A non‐zero slope was suggestive of significant small study bias (P < 0·10). 26 We defined a priori the following clinical and design characteristics of a study as potential relevant covariates: cutoff value, the definition of bacterial sepsis outcome, age range, and underlying disease of the study patients. Statistical analyses used stata 11·0 (Stata Corp, College Station, TX, USA), notably the midas and metandi commands. All statistical tests were two sided, and statistical significance was defined as P < 0·05.
Results
Identification of studies and study quality
Our initial search yielded 47 citations. We retrieved 16 studies for full‐text reading, of which 6 met our inclusion criteria (Figure 1). 12 , 13 , 14 , 15 , 16 , 17 The six included studies were conducted in Korea and France between 2010 and 2011 and comprised 416 patients (median = 77; range: 25–103). Bacterial pneumonia was diagnosed in 137 patients (overall prevalence = 32·9%; range: 18·5–46·6%). Song et al. 17 studied both PCT and CRP, while the others only studied PCT. 12 , 13 , 14 , 15 , 16 All studies had used an appropriate prospective cross‐sectional study design.
In general, a PCT test had a high sensitivity (range: 74·1–100%), but a low specificity (range: 52·5–70%) for identifying bacterial coinfections among patients with H1N1 influenza. Only one study examined a diagnostic role for CRP, which had a sensitivity of 81·8% and a specificity of 59·3%. Figure 2 provides an overall impression of the methodological quality of these studies. None of the included studies explained subject withdrawals or reported uninterpretable results, one study did not provide adequate descriptions of an index test, 17 and two studies were not blinded for index tests for verification of outcomes and may have been corrupted by incorporation bias. 14 , 15
Figure 2.
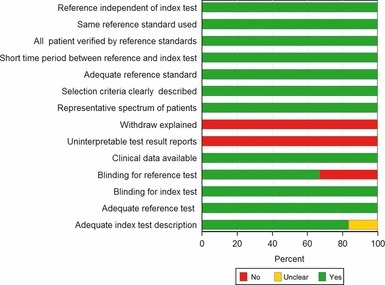
Assessment of study quality using Quality Assessment of Diagnostic Accuracy Studies criteria for the included studies.
Study and population characteristics
Table 1 lists the other study and population characteristics of the six included study patient populations. The outcome definitions used in the included studies could be classified into two broad categories: microbiologically documented infection (MDI) only and both microbiologically and clinically documented infection (MDI and CDI). Three studies were carried out in intensive care units (ICUs), 13 , 14 , 16 two in hospital wards, 15 , 17 and one in an emergency department. 12 The sensitivities and specificities of different markers are also shown in Table 1. Many of these studies reported multiple sensitivity and specificity pairs using different cutoff values or different measurement time points. When there were multiple sensitivity or specificity values reported in a study, we reported those sensitivity and specificity values that maximized a Youden index.
Table 1.
Summary of the included studies
| Author, year, country | Age range | Prevalence of case patients (Number of participants) | Biomarkers tested | Cutoff (PCT, ng/ml CRP, mg/l) | Outcomes | Setting | PCT sensitivity, Specificity | CRP sensitivity, Specificity |
|---|---|---|---|---|---|---|---|---|
| Guervilly C 2010 Italy 14 | Adult | 0·21 (38) | PCT | PCT ≥ 0·5 | Microbiologically documented infection | ICU | 100% 52·5% | N.A |
| Ingram PR 2010 Australia 16 | Adult | 0·36 (25) | PCT | PCT ≥ 0·8 | Clinically and microbiologically documented infection | ICU | 100% 62·0% | N.A |
| Ahn S 2011 Korea 12 | Adult | 0·31 (96) | PCT | PCT ≥ 0·3 | Microbiologically documented infection | ED | 76·2% 60·6% | N.A |
| Cuquemelle E 2011 France 13 | Adult | 0·47 (103) | PCT | PCT ≥ 0·8 | Microbiologically documented infection | ICU | 91·0% 68·0% | N.A |
| Song JY 2011 Korea 17 | Adult | 0·19 (81) | PCT, CRP | PCT ≥ 0·35 CRP ≥ 86·5 | Clinically and microbiologically documented infection | Inpatient | 81·0% 66·7% | 81·8% 59·3% |
| Han SS 2011 Korea 15 | Adult | 0·37 (73) | PCT | PCT ≥ 0·019 | Clinically and microbiologically documented infection | Outpatient | 74·1% 70·0% | N.A |
PCT, procalcitonin; CRP, C‐reactive protein; ICU, intensive care unit; ED, emergency department; NA, not available.
Diagnostic accuracy indices
Results of our meta‐analysis showed that PCT was a more sensitive rather than a specific test for diagnosing secondary bacterial pneumonia among influenza virus‐infected patients. Figure 3 shows a plot of our summary ROC curve. PCT had an area under the ROC curve of 0·68 (95% CI: 0·64–0·72). The pooled sensitivity and specificity estimates were 0·84 (95% CI: 0·75–0·90) and 0·64 (95% CI: 0·58–0·69), respectively (Figure 4).
Figure 3.
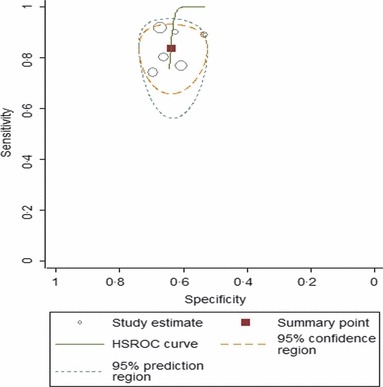
Summary receiver operating characteristic (ROC) curve. This figure shows the summary ROC (solid line), the bivariate summary estimate (solid square), and the corresponding 95% confidence ellipse (inner dashed line) and 95% prediction ellipse (outer dotted line). Symbol size for each study is proportional to the study size.
Figure 4.
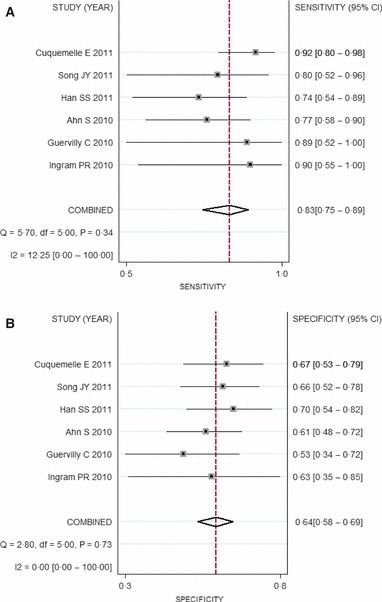
Forest plots. Forest plots for (A) sensitivity and (B) specificity for studies using procalcitonin to detect superimposed bacterial infection among patients with influenza virus infection.
As the positive likelihood ratio (LR+) usually needs to be >5 to be recommended as a good rule‐in test, the low LR+ of the PCT test (2·31; 95% CI: 1·93–2·78) did not provide sufficient power to recommend its use as a rule‐in test. However, its low negative likelihood ratio (LR− = 0·26; 95% CI: 0·17–0·40) suggests that the PCT test is a reasonably reliable rule‐out test. We did not observe any substantial degree of heterogeneity for PCT (I 2 = 0%; 95% CI; 0·0–74·62).
Subgroup analyses
We conducted subgroup analyses by restricting studies to those with similar study settings and outcome definitions. The pooled sensitivity estimates improved appreciably after considering ICU populations only (0·91; 95% CI: 0·82–0·97) or considering studies using MDI as the sole outcome definition (0·89; 95% CI: 0·77–0·92). Although the pooled specificities were slightly decreased in these two subgroups, the global measure of accuracy (i.e., AUROC or diagnostic OR) improved appreciably. The positive likelihood ratios for PCT tests for these two subgroups were still not sufficient to rule‐in bacterial pneumonia among patients with influenza pneumonia, but the negative likelihood ratios, particularly in the ICU populations, were sufficiently low to rule out the possibility of bacterial coinfection among these patients.
No significant evidence of possible publication bias was noted by Egger’s test for asymmetry of a funnel plot (Table 2). An exploratory meta‐regression analysis did not find that any pre‐specified covariate significantly changed the effect estimates.
Table 2.
Subgroup analysis of the included studies
| Variables | Number of studies | Sensitivity (95% CI) | Specificity (95% CI) | Likelihood ratio+ | Likelihood ratio‐ | AUROC (95% CI) | Diagnostic OR (95% CI) | I 2 (95% CI) | Publication bias (Egger’s test P) |
|---|---|---|---|---|---|---|---|---|---|
| Procalcitonin | |||||||||
| Overall analysis 12 , 13 , 14 , 15 , 16 , 17 | 6 | 0·84 (0·75–0·90) | 0·64 (0·58–0·69) | 2·31 (1·93–2·78) | 0·26 (0·17–0·40) | 0·68 (0·64–0·72) | 8·55 (5·04–14·5) | 0·0 (0·0–74·62) | 0·518 |
| ICU 13 , 14 , 16 | 3 | 0·91 (0·82–0·97) | 0·62 (0·52–0·72) | 2·53 (1·90–3·30) | 0·14 (0·06–0·31) | 0·73 (0·50–0·99) | 17·9 (6·98–45·8) | 0·0 (0·0–84·69) | 0·311 |
| MDI 12 , 13 , 14 | 3 | 0·89 (0·77–0·92) | 0·61 (0·53–0·67) | 2·30 (1·82–2·93) | 0·23 (0·14–0·39) | 0·79 (0·49–0·99) | 9·93 (3·49–28·3) | 46·1 (0·0–84·1) | 0·518 |
ICU, intensive care unit; MDI, microbiologically documented infection.
Discussion
Influenza virus causes a high disease burden worldwide. It is estimated that 50–80 million people would die if a pandemic flu would occur now that had a similar magnitude and severity to that of the 1918 pandemic flu. 27 Clinical and pathological evidence suggests that a secondary bacterial infection is the major cause of death among patients with influenza virus infections. 4 , 7
Given the limited stockpiles of respiratory antibiotics available during flu pandemics and the possibility of rapidly emerging drug resistance, prophylactic antibiotics are not recommended for all influenza‐infected patients with lower respiratory tract symptoms. A reliable screening test that can rapidly differentiate viral from bacterial pneumonia is of paramount importance for managing a large number of patients. Unfortunately, clinical characteristics, chest radiographic findings, and routine laboratory results are unreliable for distinguishing viral from bacterial pneumonia. 8 , 9
Several randomized clinical trials have recently shown that it may be possible to safely withhold antibiotics based on PCT test results. 28 , 29 The usefulness of a PCT test among patients with influenza virus infection, however, has just begun to be investigated. Owing to the small sample sizes in the reported studies, results are difficult to interpret. Therefore, a meta‐analysis might be useful for clinicians to understand the actual utility of PCT in this setting and at this stage.
However, it is worth noting that diagnostic test performance can be influenced by disease prevalence and other population characteristics. Therefore, clinicians are advised to use the results from the subgroup that most closely match their own clinical circumstances. For example, a superior performance of the PCT test was shown for ICU populations compared with emergency department or outpatient populations.
In our analysis, a PCT test exhibited a suboptimal rule‐in value for confirming bacterial coinfection. In a population with a 30% prevalence (pre‐test probability) of mixed influenza and bacterial pneumonia, the positive predictive value (post‐test probability) for PCT test would only be 50%. That is, approximately one in two patients with positive PCT results could be expected to have either clinically or microbiologically confirmed secondary bacterial pneumonia. In contrast, the diagnostic value for PCT to rule‐out bacterial coinfection among H1N1 influenza virus‐infected patients was reasonably high. In the same population with a 30% prevalence of mixed influenza and bacterial pneumonia, the negative predictive value for a PCT test could be as high as 90%. Thus, only one in 10 patients with negative PCT results might turn out to have either clinically or microbiologically confirmed secondary bacterial pneumonia.
It may be argued that the rule‐out role for a PCT test in a real clinical setting is still limited given the huge cost of missing a patient with bacterial pneumonia. However, a perfect biomarker with a near zero false‐negative rate cannot be expected in the foreseeable future. A practical way to make the best use of a PCT test may be either to do serial tests to increase its sensitivity (and, hence, lower the false‐negative rate) or to develop an algorithm that incorporates known risk factors, such as older age or an immuno‐compromised state, and clinical variables to make treatment decisions for patients with gray‐zone PCT test results (e.g., 0·25–0·5 ng/ml). A strategy such as this has been shown by randomized controlled trials to successfully reduce the use of empirical antibiotics without impairing the outcomes among patients with community‐acquired pneumonia. 28
The goal of our systematic review was to critically evaluate the diagnostic accuracy of PCT tests for the diagnosis of mixed bacterial and influenza pneumonia among influenza‐infected patients with lower respiratory tract symptoms. However, there are inherent limitations with regard to sensitivity, specificity, and likelihood ratios as measures of test performance. They do not address the possible added diagnostic value to current practice based on clinical information and routine imaging and laboratory tests. They also do not address whether incorporating a PCT test in the diagnostic workup of patients with influenza will change physicians’ antibiotics prescribing behaviors and ultimately improve patient outcomes. These questions can best be answered with randomized control trials. Prior to this, the currently available data suggest that PCT tests may add to conventional diagnostic workups for identifying bacterial coinfections in patients with influenza pneumonia.
Our meta‐analysis had several limitations. First, current standard criteria for defining a secondary bacterial infection among patients with influenza pneumonia tend to under‐diagnose the disease; the lack of a gold standard disease verification tool may thus affect the evaluation of the index test (PCT). Second, it is likely that unpublished data and ongoing studies were missed. Although we did not observe any signs of significant publication bias, it is also possible that studies that found poor PCT performance were less likely to be published.
In conclusion, the data suggest that PCT tests have a high sensitivity, particularly for ICU patients, but a low specificity for identifying secondary bacterial infections among patients with influenza. Because of its suboptimal positive likelihood ratio and good negative likelihood ratio, it can be used as a suitable rule‐out test but cannot be used as a standalone rule‐in test. These data should help inform evidence‐based practice guidelines for the management of influenza infection.
Conflict of interest
None declared.
References
- 1. Brundage JF, Shanks GD. What really happened during the 1918 influenza pandemic? The importance of bacterial secondary infections. J Infect Dis 2007; 196:1717–1718. [DOI] [PubMed] [Google Scholar]
- 2. Chien YW, Klugman KP, Morens DM. . Efficacy of whole‐cell killed bacterial vaccines in preventing pneumonia and death during the 1918 influenza pandemic. J Infect Dis 1918; 202:1639–1648. [DOI] [PMC free article] [PubMed] [Google Scholar]
- 3. Chowell G, Bertozzi SM, Colchero MA et al. Severe respiratory disease concurrent with the circulation of H1N1 influenza. N Engl J Med 2009; 361:674–679. [DOI] [PubMed] [Google Scholar]
- 4. Morens DM, Taubenberger JK, Fauci AS. The persistent legacy of the 1918 influenza virus. N Engl J Med 2009; 361:225–229. [DOI] [PMC free article] [PubMed] [Google Scholar]
- 5. Morens DM, Taubenberger JK, Fauci AS. Predominant role of bacterial pneumonia as a cause of death in pandemic influenza: implications for pandemic influenza preparedness. J Infect Dis 2008; 198:962–970. [DOI] [PMC free article] [PubMed] [Google Scholar]
- 6. Lessler J, Reich NG, Cummings DA, Nair HP, Jordan HT, Thompson N. Outbreak of 2009 pandemic influenza A (H1N1) at a New York City school. N Engl J Med 2009; 361:2628–2636. [DOI] [PubMed] [Google Scholar]
- 7. Shieh WJ, Blau DM, Denison AM et al. 2009 pandemic influenza A (H1N1): pathology and pathogenesis of 100 fatal cases in the United States. Am J Pathol 2010; 177:166–175. [DOI] [PMC free article] [PubMed] [Google Scholar]
- 8. Blyth CC, Iredell JR, Dwyer DE. Rapid‐test sensitivity for novel swine‐origin influenza A (H1N1) virus in humans. N Engl J Med 2009; 361:2493. [DOI] [PubMed] [Google Scholar]
- 9. Cunha BA, Syed U, Strollo S. Swine influenza (H1N1) pneumonia in hospitalized adults: chest film findings. Heart Lung 2011; 40:253–256. [DOI] [PubMed] [Google Scholar]
- 10. Dandona P, Nix D, Wilson MF et al. Procalcitonin increase after endotoxin injection in normal subjects. J Clin Endocrinol Metab 1994; 79:1605–1608. [DOI] [PubMed] [Google Scholar]
- 11. Maruna P, Nedelnikova K, Gurlich R. Physiology and genetics of procalcitonin. Physiol Res 2000; 49(Suppl 1):S57–S61. [PubMed] [Google Scholar]
- 12. Ahn S, Kim WY, Kim SH et al. Role of procalcitonin and C‐reactive protein in differentiation of mixed bacterial infection from 2009 H1N1 viral pneumonia. Influenza Other Respi Viruses 2011; 5:398–403. [DOI] [PMC free article] [PubMed] [Google Scholar]
- 13. Cuquemelle E, Soulis F, Villers D et al. Can procalcitonin help identify associated bacterial infection in patients with severe influenza pneumonia? A multicentre study Intensive Care Med 2011; 37:796–800. [DOI] [PMC free article] [PubMed] [Google Scholar]
- 14. Guervilly C, Coisel Y, Botelho‐Nevers E et al. Significance of high levels of procalcitonin in patients with influenza A (H1N1) pneumonia. J Infect 2010; 61:355–358. [DOI] [PubMed] [Google Scholar]
- 15. Han SS, Kim SH, Kim WJ, Lee SJ, Ryu SW, Cheon MJ. Diagnostic role of C‐reactive protein, procalcitonin and lipopolysaccharide‐binding protein in discriminating bacterial‐community acquired pneumonia from 2009 H1N1 influenza A infection. Tuberc Respir Dis 2011; 70:490–497. [Google Scholar]
- 16. Ingram PR, Inglis T, Moxon D, Speers D. Procalcitonin and C‐reactive protein in severe 2009 H1N1 influenza infection. Intensive Care Med 2010; 36:528–532. [DOI] [PMC free article] [PubMed] [Google Scholar]
- 17. Song JY, Cheong HJ, Heo JY et al. Clinical, laboratory and radiologic characteristics of 2009 pandemic influenza A/H1N1 pneumonia: primary influenza pneumonia versus concomitant/secondary bacterial pneumonia. Influenza Other Respi Viruses 2011; 5:e535–e543. [DOI] [PMC free article] [PubMed] [Google Scholar]
- 18. Leeflang MM, Deeks JJ, Gatsonis C, Bossuyt PM. Systematic reviews of diagnostic test accuracy. Ann Intern Med 2008; 149:889–897. [DOI] [PMC free article] [PubMed] [Google Scholar]
- 19. Gatsonis C, Paliwal P. Meta‐analysis of diagnostic and screening test accuracy evaluations: methodologic primer. AJR Am J Roentgenol 2006; 187:271–281. [DOI] [PubMed] [Google Scholar]
- 20. Whiting PF, Weswood ME, Rutjes AW, Reitsma JB, Bossuyt PN, Kleijnen J. Evaluation of QUADAS, a tool for the quality assessment of diagnostic accuracy studies. BMC Med Res Methodol 2006; 6:9. [DOI] [PMC free article] [PubMed] [Google Scholar]
- 21. Bossuyt PM, Reitsma JB, Bruns DE et al. Towards complete and accurate reporting of studies of diagnostic accuracy: the STARD initiative. BMJ 2003; 326:41–44. [DOI] [PMC free article] [PubMed] [Google Scholar]
- 22. Reitsma JB, Glas AS, Rutjes AW, Scholten RJ, Bossuyt PM, Zwinderman AH. Bivariate analysis of sensitivity and specificity produces informative summary measures in diagnostic reviews. J Clin Epidemiol 2005; 58:982–990. [DOI] [PubMed] [Google Scholar]
- 23. Whiting P, Rutjes AW, Reitsma JB, Glas AS, Bossuyt PM, Kleijnen J. Sources of variation and bias in studies of diagnostic accuracy: a systematic review. Ann Intern Med 2004; 140:189–202. [DOI] [PubMed] [Google Scholar]
- 24. Lijmer JG, Bossuyt PM, Heisterkamp SH. Exploring sources of heterogeneity in systematic reviews of diagnostic tests. Stat Med 2002; 21:1525–1537. [DOI] [PubMed] [Google Scholar]
- 25. DerSimonian R, Laird N. Meta‐analysis in clinical trials. Control Clin Trials 1986; 7:177–188. [DOI] [PubMed] [Google Scholar]
- 26. Song F, Khan KS, Dinnes J, Sutton AJ. Asymmetric funnel plots and publication bias in meta‐analyses of diagnostic accuracy. Int J Epidemiol 2002; 31:88–95. [DOI] [PubMed] [Google Scholar]
- 27. Murray CJ, Lopez AD, Chin B, Feehan D, Hill KH. Estimation of potential global pandemic influenza mortality on the basis of vital registry data from the 1918‐20 pandemic: a quantitative analysis. Lancet 2006; 368:2211–2218. [DOI] [PubMed] [Google Scholar]
- 28. Schuetz P, Christ‐Crain M, Thomann R et al. Effect of procalcitonin‐based guidelines vs standard guidelines on antibiotic use in lower respiratory tract infections: the ProHOSP randomized controlled trial. JAMA 2009; 302:1059–1066. [DOI] [PubMed] [Google Scholar]
- 29. Christ‐Crain M, Jaccard‐Stolz D, Bingisser R et al. Effect of procalcitonin‐guided treatment on antibiotic use and outcome in lower respiratory tract infections: cluster‐randomised, single‐blinded intervention trial. Lancet 2004; 363:600–607. [DOI] [PubMed] [Google Scholar]